Air Pollution in Liangsidu: Real-time Air Quality Index and smog alert.
Pollution and air quality forecast for Liangsidu. Today is Tuesday, June 2, 2026. The following air pollution values have been recorded for Liangsidu:- particulate matter (PM10) suspended dust - 179 (Very bad Hazardous)
- particulate matter (PM2.5) dust - 35 (Unhealthy for Sensitive Groups)
- ozone (O3) - 0 (Good)
- nitrogen dioxide (NO2) - 0 (Good)
- sulfur dioxide (SO2) - 0 (Good)

What is the air quality in Liangsidu today? Is the air polluted in Liangsidu?. Is there smog?
What is the level of PM10 today in Liangsidu? (particulate matter (PM10) suspended dust)
The current level of particulate matter PM10 in Liangsidu is:
179 (Very bad Hazardous)
The highest PM10 values usually occur in month: 204 (January 2019).
The lowest value of particulate matter PM10 pollution in Liangsidu is usually recorded in: July (57).
What is the current level of PM2.5 in Liangsidu? (particulate matter (PM2.5) dust)
Today's PM2.5 level is:
35 (Unhealthy for Sensitive Groups)
For comparison, the highest level of PM2.5 in Liangsidu in the last 7 days was: 56 (Friday, May 27, 2022) and the lowest: 56 (Friday, May 27, 2022).
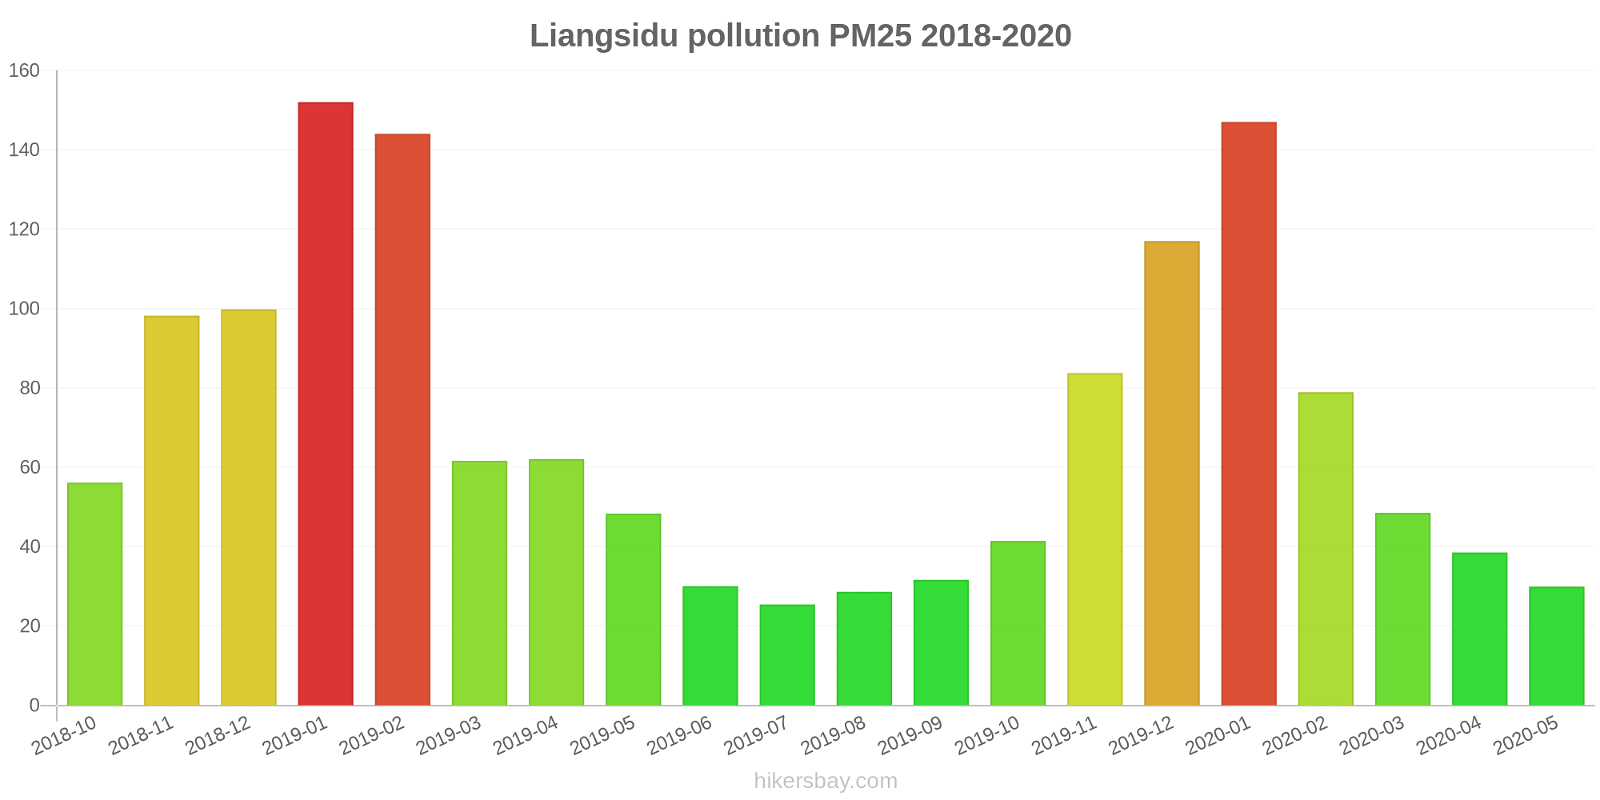
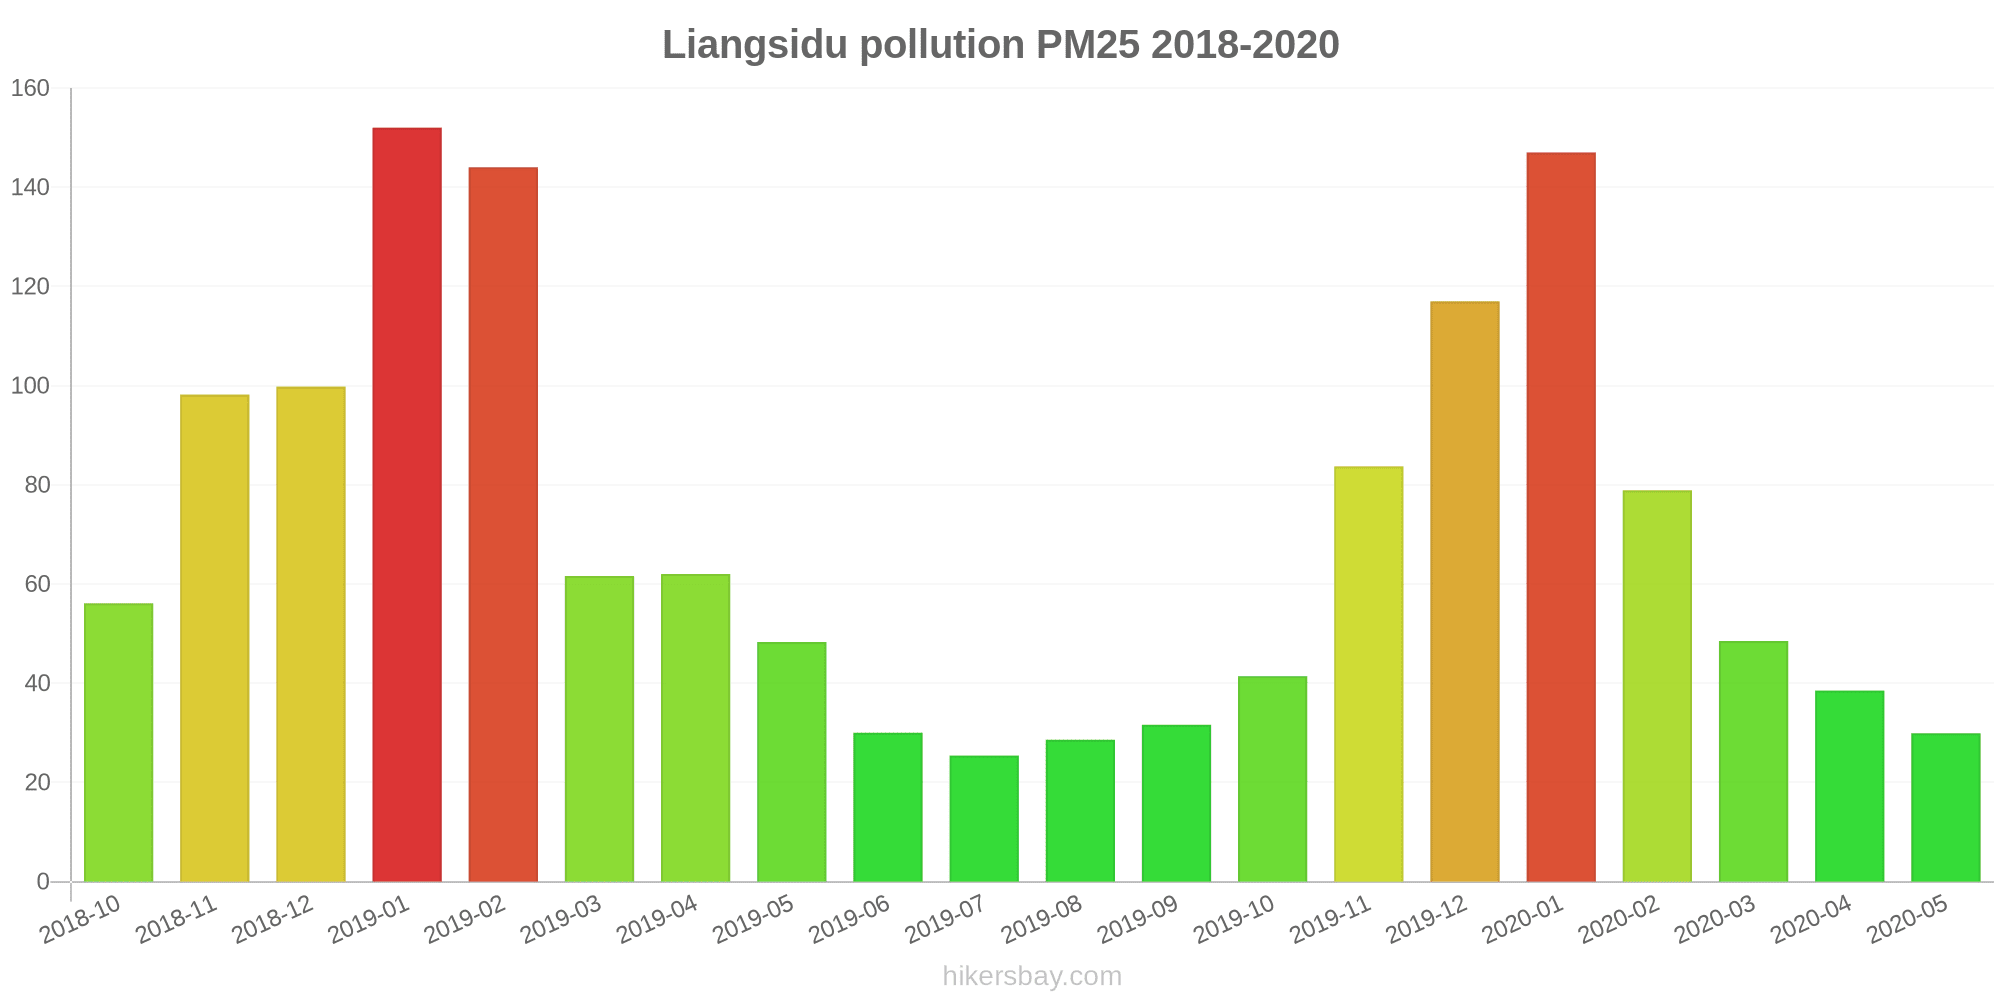
The highest PM2.5 values were recorded: 152 (January 2019).
The lowest level of particulate matter PM2.5 pollution occurs in month: July (25).
How is the O3 level today in Liangsidu? (ozone (O3))
0 (Good)
How high is the level of NO2? (nitrogen dioxide (NO2))
0 (Good)
What is the level of SO2 pollution? (sulfur dioxide (SO2))
0 (Good)
Current data Friday, May 27, 2022, 12:00 PM
PM10 179 (Very bad Hazardous)
PM2,5 35 (Unhealthy for Sensitive Groups)
O3 0 (Good)
NO2 0 (Good)
SO2 0 (Good)
Data on air pollution from recent days in Liangsidu
index
2022-05-27
pm10
56
Unhealthy for Sensitive Groups
pm25
56
Unhealthy
o3
0
Good
no2
0
Good
so2
0
Good
data source »
Air pollution in Liangsidu from October 2018 to May 2020
index
2020-05
2020-04
2020-03
2020-02
2020-01
2019-12
2019-11
2019-10
2019-09
2019-08
2019-07
2019-06
2019-05
2019-04
2019-03
2019-02
2019-01
2018-12
2018-11
2018-10
pm25
30 (Moderate)
39 (Unhealthy for Sensitive Groups)
49 (Unhealthy for Sensitive Groups)
79 (Very Unhealthy)
147 (Very bad Hazardous)
117 (Very bad Hazardous)
84 (Very Unhealthy)
41 (Unhealthy for Sensitive Groups)
32 (Moderate)
29 (Moderate)
25 (Moderate)
30 (Moderate)
48 (Unhealthy for Sensitive Groups)
62 (Unhealthy)
62 (Unhealthy)
144 (Very bad Hazardous)
152 (Very bad Hazardous)
100 (Very Unhealthy)
98 (Very Unhealthy)
56 (Unhealthy)
co
606 (Good)
707 (Good)
696 (Good)
977 (Good)
1 (Good)
1 (Good)
986 (Good)
847 (Good)
701 (Good)
782 (Good)
631 (Good)
649 (Good)
675 (Good)
799 (Good)
835 (Good)
1 (Good)
1 (Good)
1 (Good)
1 (Good)
1 (Good)
no2
33 (Good)
48 (Moderate)
42 (Moderate)
24 (Good)
48 (Moderate)
60 (Moderate)
55 (Moderate)
43 (Moderate)
33 (Good)
26 (Good)
30 (Good)
33 (Good)
39 (Good)
42 (Moderate)
50 (Moderate)
39 (Good)
61 (Moderate)
57 (Moderate)
61 (Moderate)
55 (Moderate)
o3
141 (Unhealthy for Sensitive Groups)
119 (Moderate)
99 (Moderate)
99 (Moderate)
59 (Good)
50 (Good)
44 (Good)
65 (Good)
124 (Unhealthy for Sensitive Groups)
156 (Unhealthy)
159 (Unhealthy)
157 (Unhealthy)
143 (Unhealthy for Sensitive Groups)
137 (Unhealthy for Sensitive Groups)
114 (Moderate)
89 (Moderate)
65 (Good)
44 (Good)
64 (Good)
101 (Moderate)
pm10
84 (Unhealthy)
99 (Unhealthy)
121 (Very Unhealthy)
109 (Unhealthy)
154 (Very bad Hazardous)
155 (Very bad Hazardous)
132 (Very Unhealthy)
88 (Unhealthy)
59 (Unhealthy for Sensitive Groups)
57 (Unhealthy for Sensitive Groups)
57 (Unhealthy for Sensitive Groups)
60 (Unhealthy for Sensitive Groups)
133 (Very Unhealthy)
128 (Very Unhealthy)
132 (Very Unhealthy)
183 (Very bad Hazardous)
204 (Very bad Hazardous)
188 (Very bad Hazardous)
174 (Very bad Hazardous)
111 (Very Unhealthy)
so2
7.7 (Good)
8.5 (Good)
7.3 (Good)
9.2 (Good)
11 (Good)
12 (Good)
10 (Good)
7 (Good)
6.5 (Good)
6.1 (Good)
5.4 (Good)
5.7 (Good)
10 (Good)
10 (Good)
12 (Good)
11 (Good)
17 (Good)
18 (Good)
11 (Good)
9.9 (Good)
data source »
中华小区
Friday, May 27, 2022, 12:00 PM
PM10 179 (Very bad Hazardous)
particulate matter (PM10) suspended dust
PM2,5 35 (Unhealthy for Sensitive Groups)
particulate matter (PM2.5) dust
O3 0.04 (Good)
ozone (O3)
NO2 0 (Good)
nitrogen dioxide (NO2)
SO2 0 (Good)
sulfur dioxide (SO2)
中华小区
index
2022-05-27
pm10
56
pm25
56
o3
0.03
no2
0
so2
0
中华小区
2018-10 2020-05

index
2020-05
2020-04
2020-03
2020-02
2020-01
2019-12
2019-11
2019-10
2019-09
2019-08
2019-07
2019-06
2019-05
2019-04
2019-03
2019-02
2019-01
2018-12
2018-11
2018-10
pm25
30
39
49
79
147
117
84
41
32
29
25
30
48
62
62
144
152
100
98
56
co
606
707
696
977
1
1
986
847
701
782
631
649
675
799
835
1
1
1
1
1
no2
33
48
42
24
48
60
55
43
33
26
30
33
39
42
50
39
61
57
61
55
o3
141
119
99
99
59
50
44
65
124
156
159
157
143
137
114
89
65
44
64
101
pm10
84
99
121
109
154
155
132
88
59
57
57
60
133
128
132
183
204
188
174
111
so2
7.7
8.5
7.3
9.2
11
12
10
7
6.5
6.1
5.4
5.7
10
10
12
11
17
18
11
9.9
* Pollution data source:
https://openaq.org
(ChinaAQIData)
The data is licensed under CC-By 4.0
PM10 179 (Very bad Hazardous)
PM2,5 35 (Unhealthy for Sensitive Groups)
O3 0 (Good)
NO2 0 (Good)
SO2 0 (Good)
Data on air pollution from recent days in Liangsidu
| index | 2022-05-27 |
|---|---|
| pm10 | 56 Unhealthy for Sensitive Groups |
| pm25 | 56 Unhealthy |
| o3 | 0 Good |
| no2 | 0 Good |
| so2 | 0 Good |
| index | 2020-05 | 2020-04 | 2020-03 | 2020-02 | 2020-01 | 2019-12 | 2019-11 | 2019-10 | 2019-09 | 2019-08 | 2019-07 | 2019-06 | 2019-05 | 2019-04 | 2019-03 | 2019-02 | 2019-01 | 2018-12 | 2018-11 | 2018-10 |
|---|---|---|---|---|---|---|---|---|---|---|---|---|---|---|---|---|---|---|---|---|
| pm25 | 30 (Moderate) | 39 (Unhealthy for Sensitive Groups) | 49 (Unhealthy for Sensitive Groups) | 79 (Very Unhealthy) | 147 (Very bad Hazardous) | 117 (Very bad Hazardous) | 84 (Very Unhealthy) | 41 (Unhealthy for Sensitive Groups) | 32 (Moderate) | 29 (Moderate) | 25 (Moderate) | 30 (Moderate) | 48 (Unhealthy for Sensitive Groups) | 62 (Unhealthy) | 62 (Unhealthy) | 144 (Very bad Hazardous) | 152 (Very bad Hazardous) | 100 (Very Unhealthy) | 98 (Very Unhealthy) | 56 (Unhealthy) |
| co | 606 (Good) | 707 (Good) | 696 (Good) | 977 (Good) | 1 (Good) | 1 (Good) | 986 (Good) | 847 (Good) | 701 (Good) | 782 (Good) | 631 (Good) | 649 (Good) | 675 (Good) | 799 (Good) | 835 (Good) | 1 (Good) | 1 (Good) | 1 (Good) | 1 (Good) | 1 (Good) |
| no2 | 33 (Good) | 48 (Moderate) | 42 (Moderate) | 24 (Good) | 48 (Moderate) | 60 (Moderate) | 55 (Moderate) | 43 (Moderate) | 33 (Good) | 26 (Good) | 30 (Good) | 33 (Good) | 39 (Good) | 42 (Moderate) | 50 (Moderate) | 39 (Good) | 61 (Moderate) | 57 (Moderate) | 61 (Moderate) | 55 (Moderate) |
| o3 | 141 (Unhealthy for Sensitive Groups) | 119 (Moderate) | 99 (Moderate) | 99 (Moderate) | 59 (Good) | 50 (Good) | 44 (Good) | 65 (Good) | 124 (Unhealthy for Sensitive Groups) | 156 (Unhealthy) | 159 (Unhealthy) | 157 (Unhealthy) | 143 (Unhealthy for Sensitive Groups) | 137 (Unhealthy for Sensitive Groups) | 114 (Moderate) | 89 (Moderate) | 65 (Good) | 44 (Good) | 64 (Good) | 101 (Moderate) |
| pm10 | 84 (Unhealthy) | 99 (Unhealthy) | 121 (Very Unhealthy) | 109 (Unhealthy) | 154 (Very bad Hazardous) | 155 (Very bad Hazardous) | 132 (Very Unhealthy) | 88 (Unhealthy) | 59 (Unhealthy for Sensitive Groups) | 57 (Unhealthy for Sensitive Groups) | 57 (Unhealthy for Sensitive Groups) | 60 (Unhealthy for Sensitive Groups) | 133 (Very Unhealthy) | 128 (Very Unhealthy) | 132 (Very Unhealthy) | 183 (Very bad Hazardous) | 204 (Very bad Hazardous) | 188 (Very bad Hazardous) | 174 (Very bad Hazardous) | 111 (Very Unhealthy) |
| so2 | 7.7 (Good) | 8.5 (Good) | 7.3 (Good) | 9.2 (Good) | 11 (Good) | 12 (Good) | 10 (Good) | 7 (Good) | 6.5 (Good) | 6.1 (Good) | 5.4 (Good) | 5.7 (Good) | 10 (Good) | 10 (Good) | 12 (Good) | 11 (Good) | 17 (Good) | 18 (Good) | 11 (Good) | 9.9 (Good) |
PM10 179 (Very bad Hazardous)
particulate matter (PM10) suspended dustPM2,5 35 (Unhealthy for Sensitive Groups)
particulate matter (PM2.5) dustO3 0.04 (Good)
ozone (O3)NO2 0 (Good)
nitrogen dioxide (NO2)SO2 0 (Good)
sulfur dioxide (SO2)中华小区
| index | 2022-05-27 |
|---|---|
| pm10 | 56 |
| pm25 | 56 |
| o3 | 0.03 |
| no2 | 0 |
| so2 | 0 |
中华小区

| index | 2020-05 | 2020-04 | 2020-03 | 2020-02 | 2020-01 | 2019-12 | 2019-11 | 2019-10 | 2019-09 | 2019-08 | 2019-07 | 2019-06 | 2019-05 | 2019-04 | 2019-03 | 2019-02 | 2019-01 | 2018-12 | 2018-11 | 2018-10 |
|---|---|---|---|---|---|---|---|---|---|---|---|---|---|---|---|---|---|---|---|---|
| pm25 | 30 | 39 | 49 | 79 | 147 | 117 | 84 | 41 | 32 | 29 | 25 | 30 | 48 | 62 | 62 | 144 | 152 | 100 | 98 | 56 |
| co | 606 | 707 | 696 | 977 | 1 | 1 | 986 | 847 | 701 | 782 | 631 | 649 | 675 | 799 | 835 | 1 | 1 | 1 | 1 | 1 |
| no2 | 33 | 48 | 42 | 24 | 48 | 60 | 55 | 43 | 33 | 26 | 30 | 33 | 39 | 42 | 50 | 39 | 61 | 57 | 61 | 55 |
| o3 | 141 | 119 | 99 | 99 | 59 | 50 | 44 | 65 | 124 | 156 | 159 | 157 | 143 | 137 | 114 | 89 | 65 | 44 | 64 | 101 |
| pm10 | 84 | 99 | 121 | 109 | 154 | 155 | 132 | 88 | 59 | 57 | 57 | 60 | 133 | 128 | 132 | 183 | 204 | 188 | 174 | 111 |
| so2 | 7.7 | 8.5 | 7.3 | 9.2 | 11 | 12 | 10 | 7 | 6.5 | 6.1 | 5.4 | 5.7 | 10 | 10 | 12 | 11 | 17 | 18 | 11 | 9.9 |