Air Pollution in Lücun: Real-time Air Quality Index and smog alert.
Pollution and air quality forecast for Lücun. Today is Tuesday, June 2, 2026. The following air pollution values have been recorded for Lücun:- particulate matter (PM10) suspended dust - 179 (Very bad Hazardous)
- particulate matter (PM2.5) dust - 35 (Unhealthy for Sensitive Groups)
- ozone (O3) - 0 (Good)
- nitrogen dioxide (NO2) - 0 (Good)
- sulfur dioxide (SO2) - 0 (Good)

What is the air quality in Lücun today? Is the air polluted in Lücun?. Is there smog?
What is the level of PM10 today in Lücun? (particulate matter (PM10) suspended dust)
The current level of particulate matter PM10 in Lücun is:
179 (Very bad Hazardous)
The highest PM10 values usually occur in month: 182 (January 2019).
The lowest value of particulate matter PM10 pollution in Lücun is usually recorded in: July (54).
What is the current level of PM2.5 in Lücun? (particulate matter (PM2.5) dust)
Today's PM2.5 level is:
35 (Unhealthy for Sensitive Groups)
For comparison, the highest level of PM2.5 in Lücun in the last 7 days was: 56 (Friday, May 27, 2022) and the lowest: 56 (Friday, May 27, 2022).
The highest PM2.5 values were recorded: 152 (January 2019).
The lowest level of particulate matter PM2.5 pollution occurs in month: July (24).
How is the O3 level today in Lücun? (ozone (O3))
0 (Good)
How high is the level of NO2? (nitrogen dioxide (NO2))
0 (Good)
What is the level of SO2 pollution? (sulfur dioxide (SO2))
0 (Good)
Current data Friday, May 27, 2022, 12:00 PM
PM10 179 (Very bad Hazardous)
PM2,5 35 (Unhealthy for Sensitive Groups)
O3 0 (Good)
NO2 0 (Good)
SO2 0 (Good)
Data on air pollution from recent days in Lücun
index
2022-05-27
pm10
56
Unhealthy for Sensitive Groups
pm25
56
Unhealthy
o3
0
Good
no2
0
Good
so2
0
Good
data source »
Air pollution in Lücun from October 2018 to May 2020
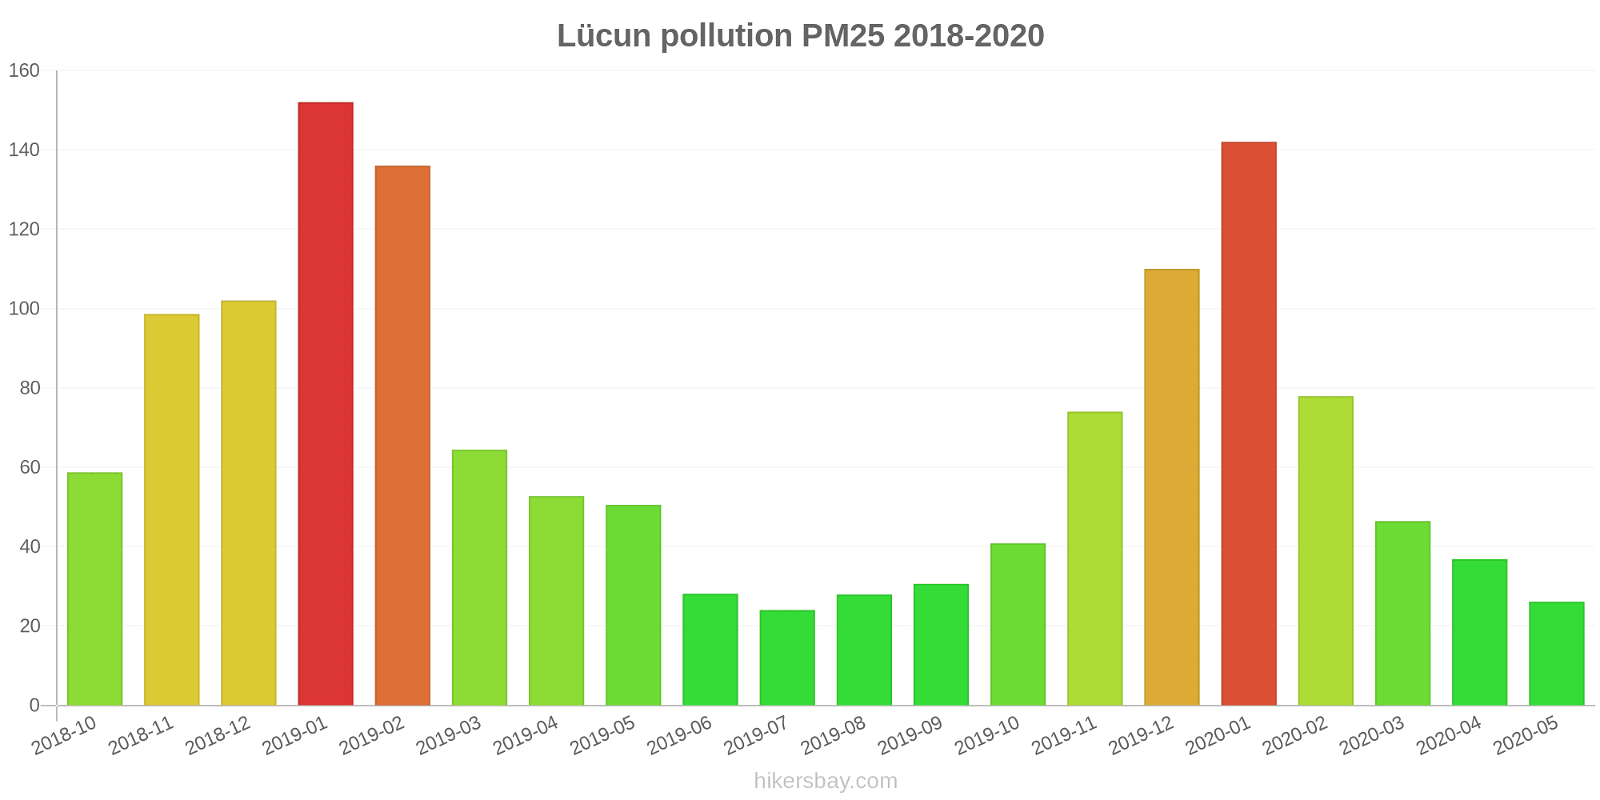
index
2020-05
2020-04
2020-03
2020-02
2020-01
2019-12
2019-11
2019-10
2019-09
2019-08
2019-07
2019-06
2019-05
2019-04
2019-03
2019-02
2019-01
2018-12
2018-11
2018-10
pm25
26 (Moderate)
37 (Unhealthy for Sensitive Groups)
46 (Unhealthy for Sensitive Groups)
78 (Very Unhealthy)
142 (Very bad Hazardous)
110 (Very bad Hazardous)
74 (Unhealthy)
41 (Unhealthy for Sensitive Groups)
31 (Moderate)
28 (Moderate)
24 (Moderate)
28 (Moderate)
51 (Unhealthy for Sensitive Groups)
53 (Unhealthy for Sensitive Groups)
64 (Unhealthy)
136 (Very bad Hazardous)
152 (Very bad Hazardous)
102 (Very Unhealthy)
99 (Very Unhealthy)
59 (Unhealthy)
co
515 (Good)
619 (Good)
658 (Good)
921 (Good)
1 (Good)
1 (Good)
999 (Good)
759 (Good)
618 (Good)
694 (Good)
561 (Good)
601 (Good)
518 (Good)
703 (Good)
686 (Good)
1 (Good)
1 (Good)
1 (Good)
1 (Good)
1 (Good)
no2
37 (Good)
58 (Moderate)
47 (Moderate)
24 (Good)
46 (Moderate)
62 (Moderate)
56 (Moderate)
44 (Moderate)
43 (Moderate)
35 (Good)
38 (Good)
40 (Moderate)
43 (Moderate)
40 (Good)
53 (Moderate)
40 (Moderate)
65 (Moderate)
61 (Moderate)
61 (Moderate)
57 (Moderate)
o3
148 (Unhealthy for Sensitive Groups)
123 (Unhealthy for Sensitive Groups)
102 (Moderate)
104 (Moderate)
60 (Good)
49 (Good)
52 (Good)
72 (Moderate)
135 (Unhealthy for Sensitive Groups)
158 (Unhealthy)
169 (Unhealthy)
168 (Unhealthy)
138 (Unhealthy for Sensitive Groups)
125 (Unhealthy for Sensitive Groups)
112 (Moderate)
92 (Moderate)
57 (Good)
45 (Good)
63 (Good)
95 (Moderate)
pm10
80 (Unhealthy)
95 (Unhealthy)
126 (Very Unhealthy)
120 (Very Unhealthy)
171 (Very bad Hazardous)
150 (Very bad Hazardous)
127 (Very Unhealthy)
81 (Unhealthy)
59 (Unhealthy for Sensitive Groups)
57 (Unhealthy for Sensitive Groups)
54 (Unhealthy for Sensitive Groups)
59 (Unhealthy for Sensitive Groups)
125 (Very Unhealthy)
109 (Unhealthy)
116 (Very Unhealthy)
166 (Very bad Hazardous)
182 (Very bad Hazardous)
176 (Very bad Hazardous)
161 (Very bad Hazardous)
109 (Unhealthy)
so2
8.6 (Good)
9.4 (Good)
7.4 (Good)
7.6 (Good)
9.7 (Good)
11 (Good)
11 (Good)
7.7 (Good)
7 (Good)
6.9 (Good)
6.7 (Good)
6.7 (Good)
10 (Good)
8.5 (Good)
9.3 (Good)
11 (Good)
14 (Good)
20 (Good)
14 (Good)
14 (Good)
data source »
两寺渡
Friday, May 27, 2022, 12:00 PM
PM10 179 (Very bad Hazardous)
particulate matter (PM10) suspended dust
PM2,5 35 (Unhealthy for Sensitive Groups)
particulate matter (PM2.5) dust
O3 0.04 (Good)
ozone (O3)
NO2 0 (Good)
nitrogen dioxide (NO2)
SO2 0 (Good)
sulfur dioxide (SO2)
两寺渡
index
2022-05-27
pm10
56
pm25
56
o3
0.03
no2
0
so2
0
两寺渡
2018-10 2020-05

index
2020-05
2020-04
2020-03
2020-02
2020-01
2019-12
2019-11
2019-10
2019-09
2019-08
2019-07
2019-06
2019-05
2019-04
2019-03
2019-02
2019-01
2018-12
2018-11
2018-10
pm25
26
37
46
78
142
110
74
41
31
28
24
28
51
53
64
136
152
102
99
59
co
515
619
658
921
1
1
999
759
618
694
561
601
518
703
686
1
1
1
1
1
no2
37
58
47
24
46
62
56
44
43
35
38
40
43
40
53
40
65
61
61
57
o3
148
123
102
104
60
49
52
72
135
158
169
168
138
125
112
92
57
45
63
95
pm10
80
95
126
120
171
150
127
81
59
57
54
59
125
109
116
166
182
176
161
109
so2
8.6
9.4
7.4
7.6
9.7
11
11
7.7
7
6.9
6.7
6.7
10
8.5
9.3
11
14
20
14
14
* Pollution data source:
https://openaq.org
(ChinaAQIData)
The data is licensed under CC-By 4.0
PM10 179 (Very bad Hazardous)
PM2,5 35 (Unhealthy for Sensitive Groups)
O3 0 (Good)
NO2 0 (Good)
SO2 0 (Good)
Data on air pollution from recent days in Lücun
| index | 2022-05-27 |
|---|---|
| pm10 | 56 Unhealthy for Sensitive Groups |
| pm25 | 56 Unhealthy |
| o3 | 0 Good |
| no2 | 0 Good |
| so2 | 0 Good |

| index | 2020-05 | 2020-04 | 2020-03 | 2020-02 | 2020-01 | 2019-12 | 2019-11 | 2019-10 | 2019-09 | 2019-08 | 2019-07 | 2019-06 | 2019-05 | 2019-04 | 2019-03 | 2019-02 | 2019-01 | 2018-12 | 2018-11 | 2018-10 |
|---|---|---|---|---|---|---|---|---|---|---|---|---|---|---|---|---|---|---|---|---|
| pm25 | 26 (Moderate) | 37 (Unhealthy for Sensitive Groups) | 46 (Unhealthy for Sensitive Groups) | 78 (Very Unhealthy) | 142 (Very bad Hazardous) | 110 (Very bad Hazardous) | 74 (Unhealthy) | 41 (Unhealthy for Sensitive Groups) | 31 (Moderate) | 28 (Moderate) | 24 (Moderate) | 28 (Moderate) | 51 (Unhealthy for Sensitive Groups) | 53 (Unhealthy for Sensitive Groups) | 64 (Unhealthy) | 136 (Very bad Hazardous) | 152 (Very bad Hazardous) | 102 (Very Unhealthy) | 99 (Very Unhealthy) | 59 (Unhealthy) |
| co | 515 (Good) | 619 (Good) | 658 (Good) | 921 (Good) | 1 (Good) | 1 (Good) | 999 (Good) | 759 (Good) | 618 (Good) | 694 (Good) | 561 (Good) | 601 (Good) | 518 (Good) | 703 (Good) | 686 (Good) | 1 (Good) | 1 (Good) | 1 (Good) | 1 (Good) | 1 (Good) |
| no2 | 37 (Good) | 58 (Moderate) | 47 (Moderate) | 24 (Good) | 46 (Moderate) | 62 (Moderate) | 56 (Moderate) | 44 (Moderate) | 43 (Moderate) | 35 (Good) | 38 (Good) | 40 (Moderate) | 43 (Moderate) | 40 (Good) | 53 (Moderate) | 40 (Moderate) | 65 (Moderate) | 61 (Moderate) | 61 (Moderate) | 57 (Moderate) |
| o3 | 148 (Unhealthy for Sensitive Groups) | 123 (Unhealthy for Sensitive Groups) | 102 (Moderate) | 104 (Moderate) | 60 (Good) | 49 (Good) | 52 (Good) | 72 (Moderate) | 135 (Unhealthy for Sensitive Groups) | 158 (Unhealthy) | 169 (Unhealthy) | 168 (Unhealthy) | 138 (Unhealthy for Sensitive Groups) | 125 (Unhealthy for Sensitive Groups) | 112 (Moderate) | 92 (Moderate) | 57 (Good) | 45 (Good) | 63 (Good) | 95 (Moderate) |
| pm10 | 80 (Unhealthy) | 95 (Unhealthy) | 126 (Very Unhealthy) | 120 (Very Unhealthy) | 171 (Very bad Hazardous) | 150 (Very bad Hazardous) | 127 (Very Unhealthy) | 81 (Unhealthy) | 59 (Unhealthy for Sensitive Groups) | 57 (Unhealthy for Sensitive Groups) | 54 (Unhealthy for Sensitive Groups) | 59 (Unhealthy for Sensitive Groups) | 125 (Very Unhealthy) | 109 (Unhealthy) | 116 (Very Unhealthy) | 166 (Very bad Hazardous) | 182 (Very bad Hazardous) | 176 (Very bad Hazardous) | 161 (Very bad Hazardous) | 109 (Unhealthy) |
| so2 | 8.6 (Good) | 9.4 (Good) | 7.4 (Good) | 7.6 (Good) | 9.7 (Good) | 11 (Good) | 11 (Good) | 7.7 (Good) | 7 (Good) | 6.9 (Good) | 6.7 (Good) | 6.7 (Good) | 10 (Good) | 8.5 (Good) | 9.3 (Good) | 11 (Good) | 14 (Good) | 20 (Good) | 14 (Good) | 14 (Good) |
PM10 179 (Very bad Hazardous)
particulate matter (PM10) suspended dustPM2,5 35 (Unhealthy for Sensitive Groups)
particulate matter (PM2.5) dustO3 0.04 (Good)
ozone (O3)NO2 0 (Good)
nitrogen dioxide (NO2)SO2 0 (Good)
sulfur dioxide (SO2)两寺渡
| index | 2022-05-27 |
|---|---|
| pm10 | 56 |
| pm25 | 56 |
| o3 | 0.03 |
| no2 | 0 |
| so2 | 0 |
两寺渡

| index | 2020-05 | 2020-04 | 2020-03 | 2020-02 | 2020-01 | 2019-12 | 2019-11 | 2019-10 | 2019-09 | 2019-08 | 2019-07 | 2019-06 | 2019-05 | 2019-04 | 2019-03 | 2019-02 | 2019-01 | 2018-12 | 2018-11 | 2018-10 |
|---|---|---|---|---|---|---|---|---|---|---|---|---|---|---|---|---|---|---|---|---|
| pm25 | 26 | 37 | 46 | 78 | 142 | 110 | 74 | 41 | 31 | 28 | 24 | 28 | 51 | 53 | 64 | 136 | 152 | 102 | 99 | 59 |
| co | 515 | 619 | 658 | 921 | 1 | 1 | 999 | 759 | 618 | 694 | 561 | 601 | 518 | 703 | 686 | 1 | 1 | 1 | 1 | 1 |
| no2 | 37 | 58 | 47 | 24 | 46 | 62 | 56 | 44 | 43 | 35 | 38 | 40 | 43 | 40 | 53 | 40 | 65 | 61 | 61 | 57 |
| o3 | 148 | 123 | 102 | 104 | 60 | 49 | 52 | 72 | 135 | 158 | 169 | 168 | 138 | 125 | 112 | 92 | 57 | 45 | 63 | 95 |
| pm10 | 80 | 95 | 126 | 120 | 171 | 150 | 127 | 81 | 59 | 57 | 54 | 59 | 125 | 109 | 116 | 166 | 182 | 176 | 161 | 109 |
| so2 | 8.6 | 9.4 | 7.4 | 7.6 | 9.7 | 11 | 11 | 7.7 | 7 | 6.9 | 6.7 | 6.7 | 10 | 8.5 | 9.3 | 11 | 14 | 20 | 14 | 14 |