Air Pollution in Gaoshangwan: Real-time Air Quality Index and smog alert.
Pollution and air quality forecast for Gaoshangwan. Today is Tuesday, June 16, 2026. The following air pollution values have been recorded for Gaoshangwan:- particulate matter (PM10) suspended dust - 179 (Very bad Hazardous)
- particulate matter (PM2.5) dust - 35 (Unhealthy for Sensitive Groups)
- ozone (O3) - 0 (Good)
- nitrogen dioxide (NO2) - 0 (Good)
- sulfur dioxide (SO2) - 0 (Good)

What is the air quality in Gaoshangwan today? Is the air polluted in Gaoshangwan?. Is there smog?
What is the level of PM10 today in Gaoshangwan? (particulate matter (PM10) suspended dust)
The current level of particulate matter PM10 in Gaoshangwan is:
179 (Very bad Hazardous)
The highest PM10 values usually occur in month: 88 (December 2019).
The lowest value of particulate matter PM10 pollution in Gaoshangwan is usually recorded in: June (38).
What is the current level of PM2.5 in Gaoshangwan? (particulate matter (PM2.5) dust)
Today's PM2.5 level is:
35 (Unhealthy for Sensitive Groups)
For comparison, the highest level of PM2.5 in Gaoshangwan in the last 7 days was: 56 (Friday, May 27, 2022) and the lowest: 56 (Friday, May 27, 2022).
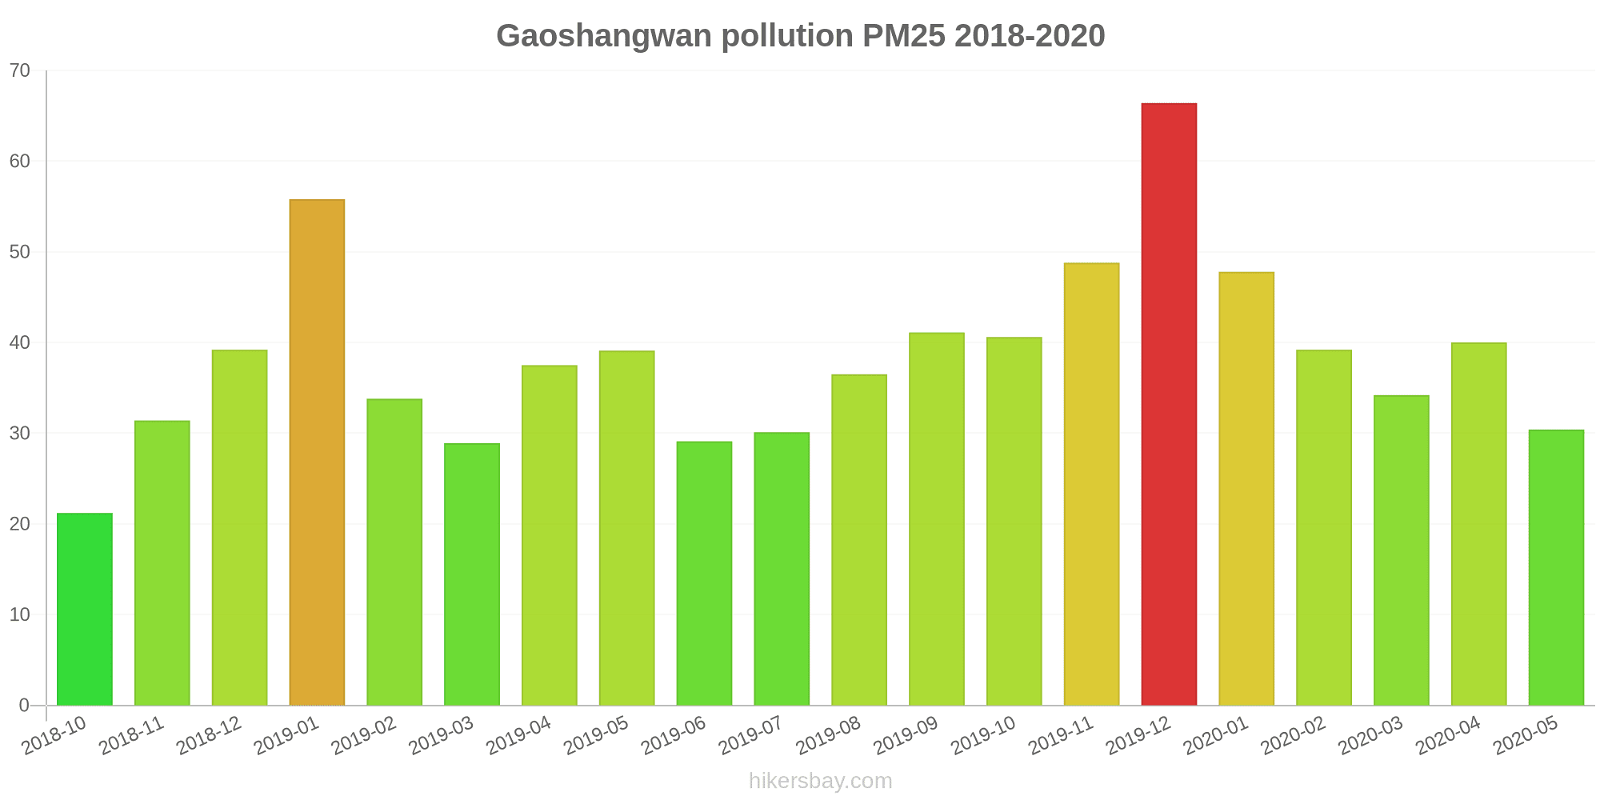
The highest PM2.5 values were recorded: 66 (December 2019).
The lowest level of particulate matter PM2.5 pollution occurs in month: October (21).
How is the O3 level today in Gaoshangwan? (ozone (O3))
0 (Good)
How high is the level of NO2? (nitrogen dioxide (NO2))
0 (Good)
What is the level of SO2 pollution? (sulfur dioxide (SO2))
0 (Good)
Current data Friday, May 27, 2022, 12:00 PM
PM10 179 (Very bad Hazardous)
PM2,5 35 (Unhealthy for Sensitive Groups)
O3 0 (Good)
NO2 0 (Good)
SO2 0 (Good)
Data on air pollution from recent days in Gaoshangwan
index
2022-05-27
pm10
56
Unhealthy for Sensitive Groups
pm25
56
Unhealthy
o3
0
Good
no2
0
Good
so2
0
Good
data source »
Air pollution in Gaoshangwan from October 2018 to May 2020
index
2020-05
2020-04
2020-03
2020-02
2020-01
2019-12
2019-11
2019-10
2019-09
2019-08
2019-07
2019-06
2019-05
2019-04
2019-03
2019-02
2019-01
2018-12
2018-11
2018-10
pm25
30 (Moderate)
40 (Unhealthy for Sensitive Groups)
34 (Moderate)
39 (Unhealthy for Sensitive Groups)
48 (Unhealthy for Sensitive Groups)
66 (Unhealthy)
49 (Unhealthy for Sensitive Groups)
41 (Unhealthy for Sensitive Groups)
41 (Unhealthy for Sensitive Groups)
37 (Unhealthy for Sensitive Groups)
30 (Moderate)
29 (Moderate)
39 (Unhealthy for Sensitive Groups)
38 (Unhealthy for Sensitive Groups)
29 (Moderate)
34 (Moderate)
56 (Unhealthy)
39 (Unhealthy for Sensitive Groups)
31 (Moderate)
21 (Moderate)
co
1 (Good)
1 (Good)
1 (Good)
1 (Good)
1 (Good)
1 (Good)
1 (Good)
1 (Good)
1 (Good)
1 (Good)
1 (Good)
1 (Good)
1 (Good)
1 (Good)
1 (Good)
1 (Good)
1 (Good)
1 (Good)
2 (Good)
1 (Good)
no2
26 (Good)
35 (Good)
25 (Good)
16 (Good)
22 (Good)
28 (Good)
21 (Good)
20 (Good)
15 (Good)
15 (Good)
11 (Good)
13 (Good)
15 (Good)
19 (Good)
21 (Good)
15 (Good)
24 (Good)
23 (Good)
23 (Good)
22 (Good)
o3
106 (Moderate)
136 (Unhealthy for Sensitive Groups)
86 (Moderate)
72 (Moderate)
66 (Good)
95 (Moderate)
109 (Moderate)
122 (Unhealthy for Sensitive Groups)
178 (Unhealthy)
145 (Unhealthy for Sensitive Groups)
108 (Moderate)
109 (Moderate)
125 (Unhealthy for Sensitive Groups)
99 (Moderate)
104 (Moderate)
70 (Good)
70 (Moderate)
66 (Good)
98 (Moderate)
112 (Moderate)
pm10
57 (Unhealthy for Sensitive Groups)
73 (Unhealthy for Sensitive Groups)
60 (Unhealthy for Sensitive Groups)
56 (Unhealthy for Sensitive Groups)
59 (Unhealthy for Sensitive Groups)
88 (Unhealthy)
85 (Unhealthy)
63 (Unhealthy for Sensitive Groups)
54 (Unhealthy for Sensitive Groups)
51 (Unhealthy for Sensitive Groups)
42 (Moderate)
38 (Moderate)
57 (Unhealthy for Sensitive Groups)
52 (Unhealthy for Sensitive Groups)
52 (Unhealthy for Sensitive Groups)
52 (Unhealthy for Sensitive Groups)
81 (Unhealthy)
66 (Unhealthy for Sensitive Groups)
51 (Unhealthy for Sensitive Groups)
70 (Unhealthy for Sensitive Groups)
so2
11 (Good)
17 (Good)
11 (Good)
8.4 (Good)
5.2 (Good)
9.6 (Good)
15 (Good)
17 (Good)
15 (Good)
17 (Good)
20 (Good)
17 (Good)
17 (Good)
17 (Good)
10 (Good)
4.8 (Good)
3.3 (Good)
7.7 (Good)
7.4 (Good)
11 (Good)
data source »
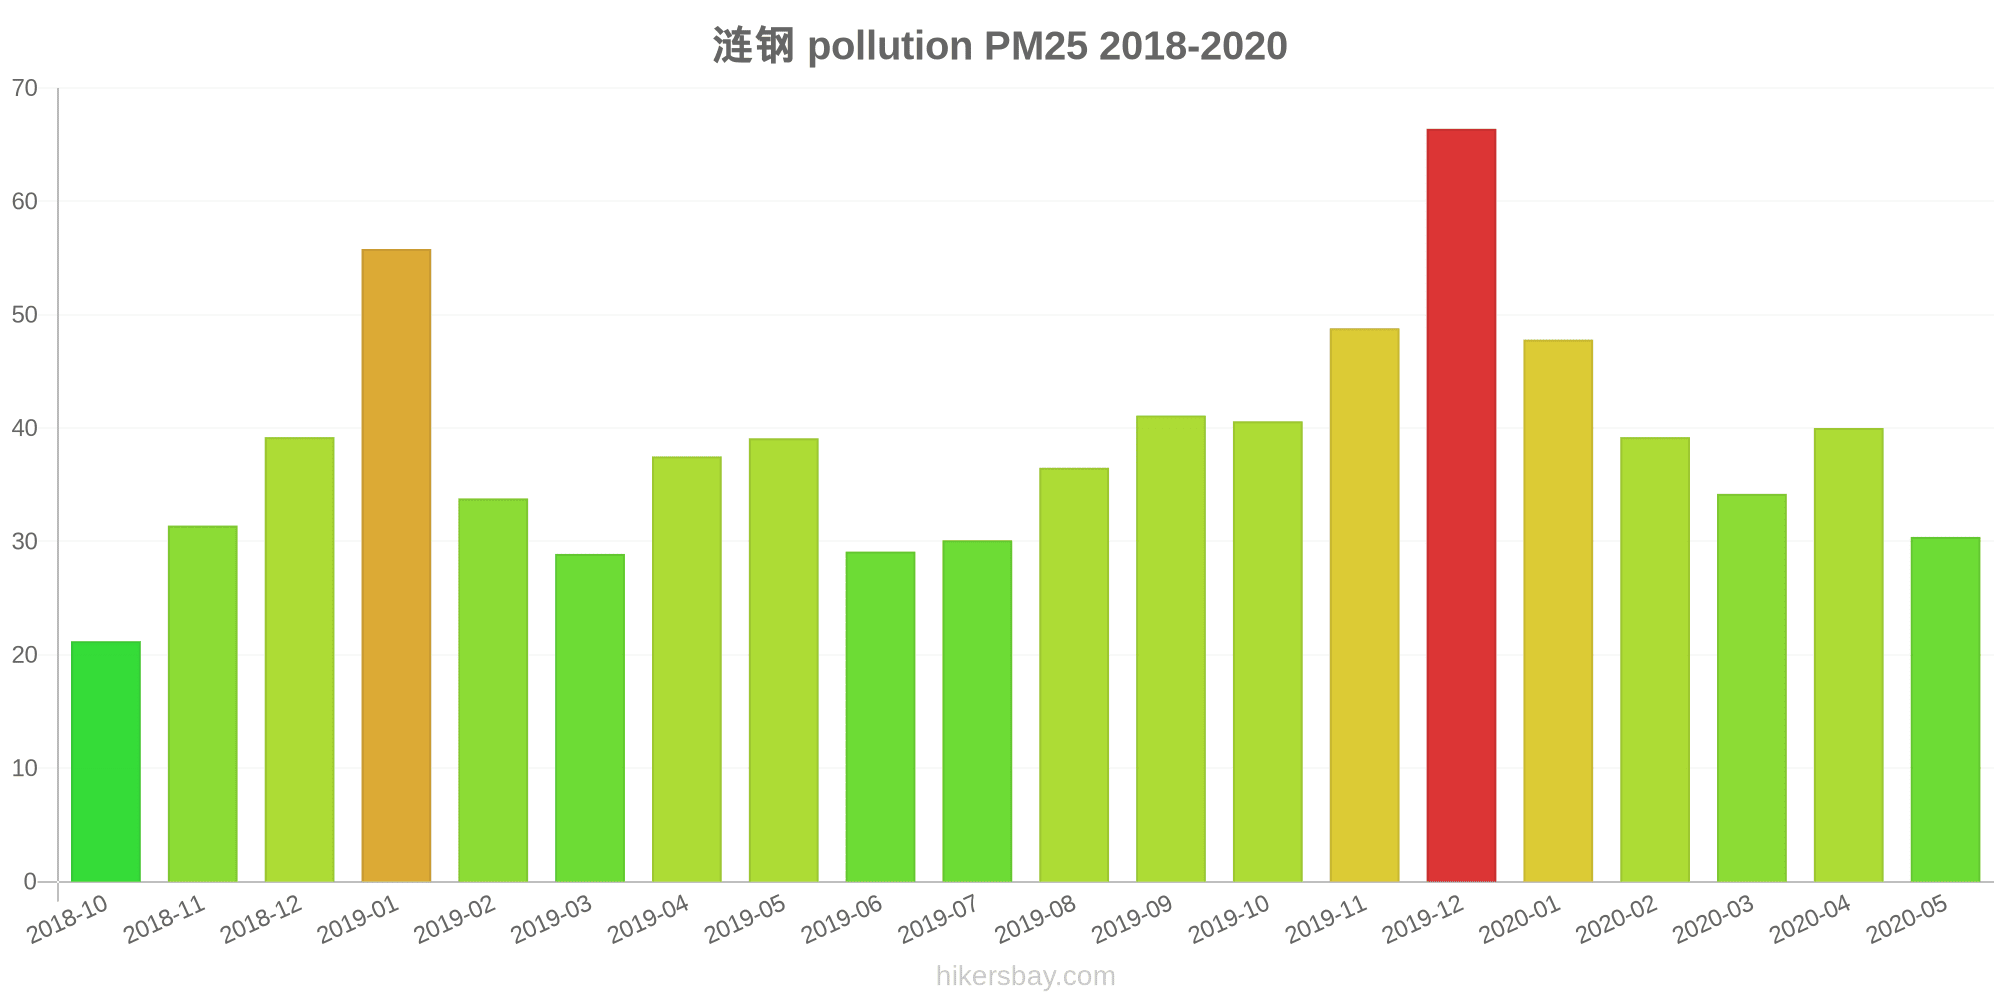
涟钢
Friday, May 27, 2022, 12:00 PM
PM10 179 (Very bad Hazardous)
particulate matter (PM10) suspended dust
PM2,5 35 (Unhealthy for Sensitive Groups)
particulate matter (PM2.5) dust
O3 0.04 (Good)
ozone (O3)
NO2 0 (Good)
nitrogen dioxide (NO2)
SO2 0 (Good)
sulfur dioxide (SO2)
涟钢
index
2022-05-27
pm10
56
pm25
56
o3
0.03
no2
0
so2
0
涟钢
2018-10 2020-05

index
2020-05
2020-04
2020-03
2020-02
2020-01
2019-12
2019-11
2019-10
2019-09
2019-08
2019-07
2019-06
2019-05
2019-04
2019-03
2019-02
2019-01
2018-12
2018-11
2018-10
pm25
30
40
34
39
48
66
49
41
41
37
30
29
39
38
29
34
56
39
31
21
co
1
1
1
1
1
1
1
1
1
1
1
1
1
1
1
1
1
1
2
1
no2
26
35
25
16
22
28
21
20
15
15
11
13
15
19
21
15
24
23
23
22
o3
106
136
86
72
66
95
109
122
178
145
108
109
125
99
104
70
70
66
98
112
pm10
57
73
60
56
59
88
85
63
54
51
42
38
57
52
52
52
81
66
51
70
so2
11
17
11
8.4
5.2
9.6
15
17
15
17
20
17
17
17
10
4.8
3.3
7.7
7.4
11
* Pollution data source:
https://openaq.org
(ChinaAQIData)
The data is licensed under CC-By 4.0
PM10 179 (Very bad Hazardous)
PM2,5 35 (Unhealthy for Sensitive Groups)
O3 0 (Good)
NO2 0 (Good)
SO2 0 (Good)
Data on air pollution from recent days in Gaoshangwan
| index | 2022-05-27 |
|---|---|
| pm10 | 56 Unhealthy for Sensitive Groups |
| pm25 | 56 Unhealthy |
| o3 | 0 Good |
| no2 | 0 Good |
| so2 | 0 Good |

| index | 2020-05 | 2020-04 | 2020-03 | 2020-02 | 2020-01 | 2019-12 | 2019-11 | 2019-10 | 2019-09 | 2019-08 | 2019-07 | 2019-06 | 2019-05 | 2019-04 | 2019-03 | 2019-02 | 2019-01 | 2018-12 | 2018-11 | 2018-10 |
|---|---|---|---|---|---|---|---|---|---|---|---|---|---|---|---|---|---|---|---|---|
| pm25 | 30 (Moderate) | 40 (Unhealthy for Sensitive Groups) | 34 (Moderate) | 39 (Unhealthy for Sensitive Groups) | 48 (Unhealthy for Sensitive Groups) | 66 (Unhealthy) | 49 (Unhealthy for Sensitive Groups) | 41 (Unhealthy for Sensitive Groups) | 41 (Unhealthy for Sensitive Groups) | 37 (Unhealthy for Sensitive Groups) | 30 (Moderate) | 29 (Moderate) | 39 (Unhealthy for Sensitive Groups) | 38 (Unhealthy for Sensitive Groups) | 29 (Moderate) | 34 (Moderate) | 56 (Unhealthy) | 39 (Unhealthy for Sensitive Groups) | 31 (Moderate) | 21 (Moderate) |
| co | 1 (Good) | 1 (Good) | 1 (Good) | 1 (Good) | 1 (Good) | 1 (Good) | 1 (Good) | 1 (Good) | 1 (Good) | 1 (Good) | 1 (Good) | 1 (Good) | 1 (Good) | 1 (Good) | 1 (Good) | 1 (Good) | 1 (Good) | 1 (Good) | 2 (Good) | 1 (Good) |
| no2 | 26 (Good) | 35 (Good) | 25 (Good) | 16 (Good) | 22 (Good) | 28 (Good) | 21 (Good) | 20 (Good) | 15 (Good) | 15 (Good) | 11 (Good) | 13 (Good) | 15 (Good) | 19 (Good) | 21 (Good) | 15 (Good) | 24 (Good) | 23 (Good) | 23 (Good) | 22 (Good) |
| o3 | 106 (Moderate) | 136 (Unhealthy for Sensitive Groups) | 86 (Moderate) | 72 (Moderate) | 66 (Good) | 95 (Moderate) | 109 (Moderate) | 122 (Unhealthy for Sensitive Groups) | 178 (Unhealthy) | 145 (Unhealthy for Sensitive Groups) | 108 (Moderate) | 109 (Moderate) | 125 (Unhealthy for Sensitive Groups) | 99 (Moderate) | 104 (Moderate) | 70 (Good) | 70 (Moderate) | 66 (Good) | 98 (Moderate) | 112 (Moderate) |
| pm10 | 57 (Unhealthy for Sensitive Groups) | 73 (Unhealthy for Sensitive Groups) | 60 (Unhealthy for Sensitive Groups) | 56 (Unhealthy for Sensitive Groups) | 59 (Unhealthy for Sensitive Groups) | 88 (Unhealthy) | 85 (Unhealthy) | 63 (Unhealthy for Sensitive Groups) | 54 (Unhealthy for Sensitive Groups) | 51 (Unhealthy for Sensitive Groups) | 42 (Moderate) | 38 (Moderate) | 57 (Unhealthy for Sensitive Groups) | 52 (Unhealthy for Sensitive Groups) | 52 (Unhealthy for Sensitive Groups) | 52 (Unhealthy for Sensitive Groups) | 81 (Unhealthy) | 66 (Unhealthy for Sensitive Groups) | 51 (Unhealthy for Sensitive Groups) | 70 (Unhealthy for Sensitive Groups) |
| so2 | 11 (Good) | 17 (Good) | 11 (Good) | 8.4 (Good) | 5.2 (Good) | 9.6 (Good) | 15 (Good) | 17 (Good) | 15 (Good) | 17 (Good) | 20 (Good) | 17 (Good) | 17 (Good) | 17 (Good) | 10 (Good) | 4.8 (Good) | 3.3 (Good) | 7.7 (Good) | 7.4 (Good) | 11 (Good) |
PM10 179 (Very bad Hazardous)
particulate matter (PM10) suspended dustPM2,5 35 (Unhealthy for Sensitive Groups)
particulate matter (PM2.5) dustO3 0.04 (Good)
ozone (O3)NO2 0 (Good)
nitrogen dioxide (NO2)SO2 0 (Good)
sulfur dioxide (SO2)涟钢
| index | 2022-05-27 |
|---|---|
| pm10 | 56 |
| pm25 | 56 |
| o3 | 0.03 |
| no2 | 0 |
| so2 | 0 |
涟钢
| index | 2020-05 | 2020-04 | 2020-03 | 2020-02 | 2020-01 | 2019-12 | 2019-11 | 2019-10 | 2019-09 | 2019-08 | 2019-07 | 2019-06 | 2019-05 | 2019-04 | 2019-03 | 2019-02 | 2019-01 | 2018-12 | 2018-11 | 2018-10 |
|---|---|---|---|---|---|---|---|---|---|---|---|---|---|---|---|---|---|---|---|---|
| pm25 | 30 | 40 | 34 | 39 | 48 | 66 | 49 | 41 | 41 | 37 | 30 | 29 | 39 | 38 | 29 | 34 | 56 | 39 | 31 | 21 |
| co | 1 | 1 | 1 | 1 | 1 | 1 | 1 | 1 | 1 | 1 | 1 | 1 | 1 | 1 | 1 | 1 | 1 | 1 | 2 | 1 |
| no2 | 26 | 35 | 25 | 16 | 22 | 28 | 21 | 20 | 15 | 15 | 11 | 13 | 15 | 19 | 21 | 15 | 24 | 23 | 23 | 22 |
| o3 | 106 | 136 | 86 | 72 | 66 | 95 | 109 | 122 | 178 | 145 | 108 | 109 | 125 | 99 | 104 | 70 | 70 | 66 | 98 | 112 |
| pm10 | 57 | 73 | 60 | 56 | 59 | 88 | 85 | 63 | 54 | 51 | 42 | 38 | 57 | 52 | 52 | 52 | 81 | 66 | 51 | 70 |
| so2 | 11 | 17 | 11 | 8.4 | 5.2 | 9.6 | 15 | 17 | 15 | 17 | 20 | 17 | 17 | 17 | 10 | 4.8 | 3.3 | 7.7 | 7.4 | 11 |