Air Pollution in Wujiacun: Real-time Air Quality Index and smog alert.
Pollution and air quality forecast for Wujiacun. Today is Tuesday, June 16, 2026. The following air pollution values have been recorded for Wujiacun:- particulate matter (PM10) suspended dust - 53 (Unhealthy for Sensitive Groups)
- ozone (O3) - 0 (Good)
- particulate matter (PM2.5) dust - 7 (Good)
- sulfur dioxide (SO2) - 18 (Good)
- nitrogen dioxide (NO2) - 3 (Good)
- carbon monoxide (CO) - 1 (Good)

What is the air quality in Wujiacun today? Is the air polluted in Wujiacun?. Is there smog?
What is the level of PM10 today in Wujiacun? (particulate matter (PM10) suspended dust)
The current level of particulate matter PM10 in Wujiacun is:
53 (Unhealthy for Sensitive Groups)
The highest PM10 values usually occur in month: 142 (January 2019).
The lowest value of particulate matter PM10 pollution in Wujiacun is usually recorded in: August (37).
How is the O3 level today in Wujiacun? (ozone (O3))
0 (Good)
What is the current level of PM2.5 in Wujiacun? (particulate matter (PM2.5) dust)
Today's PM2.5 level is:
7 (Good)
For comparison, the highest level of PM2.5 in Wujiacun in the last 7 days was: 21 (Friday, May 27, 2022) and the lowest: 21 (Friday, May 27, 2022).
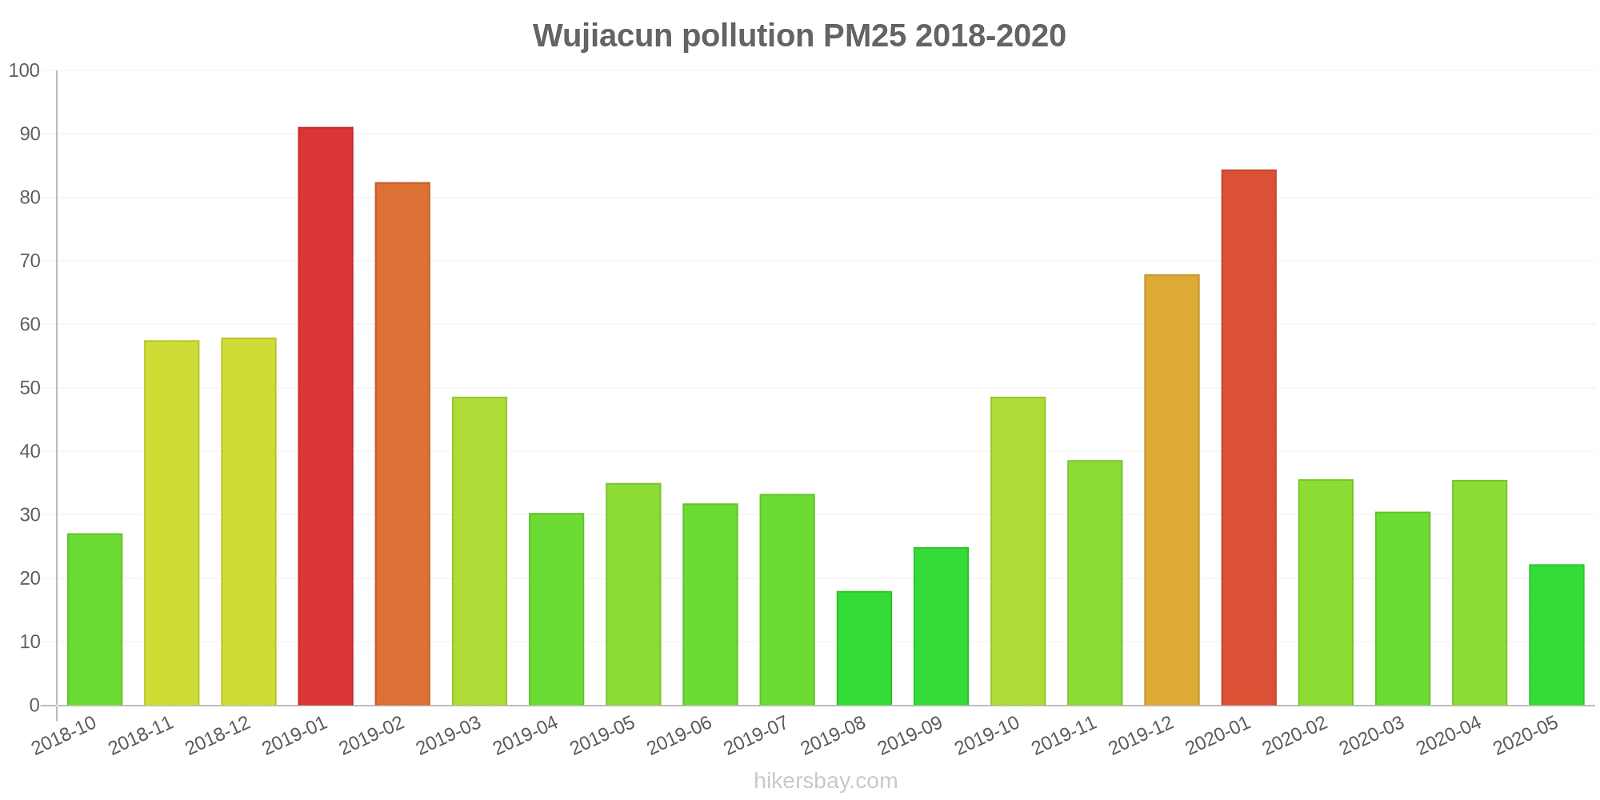
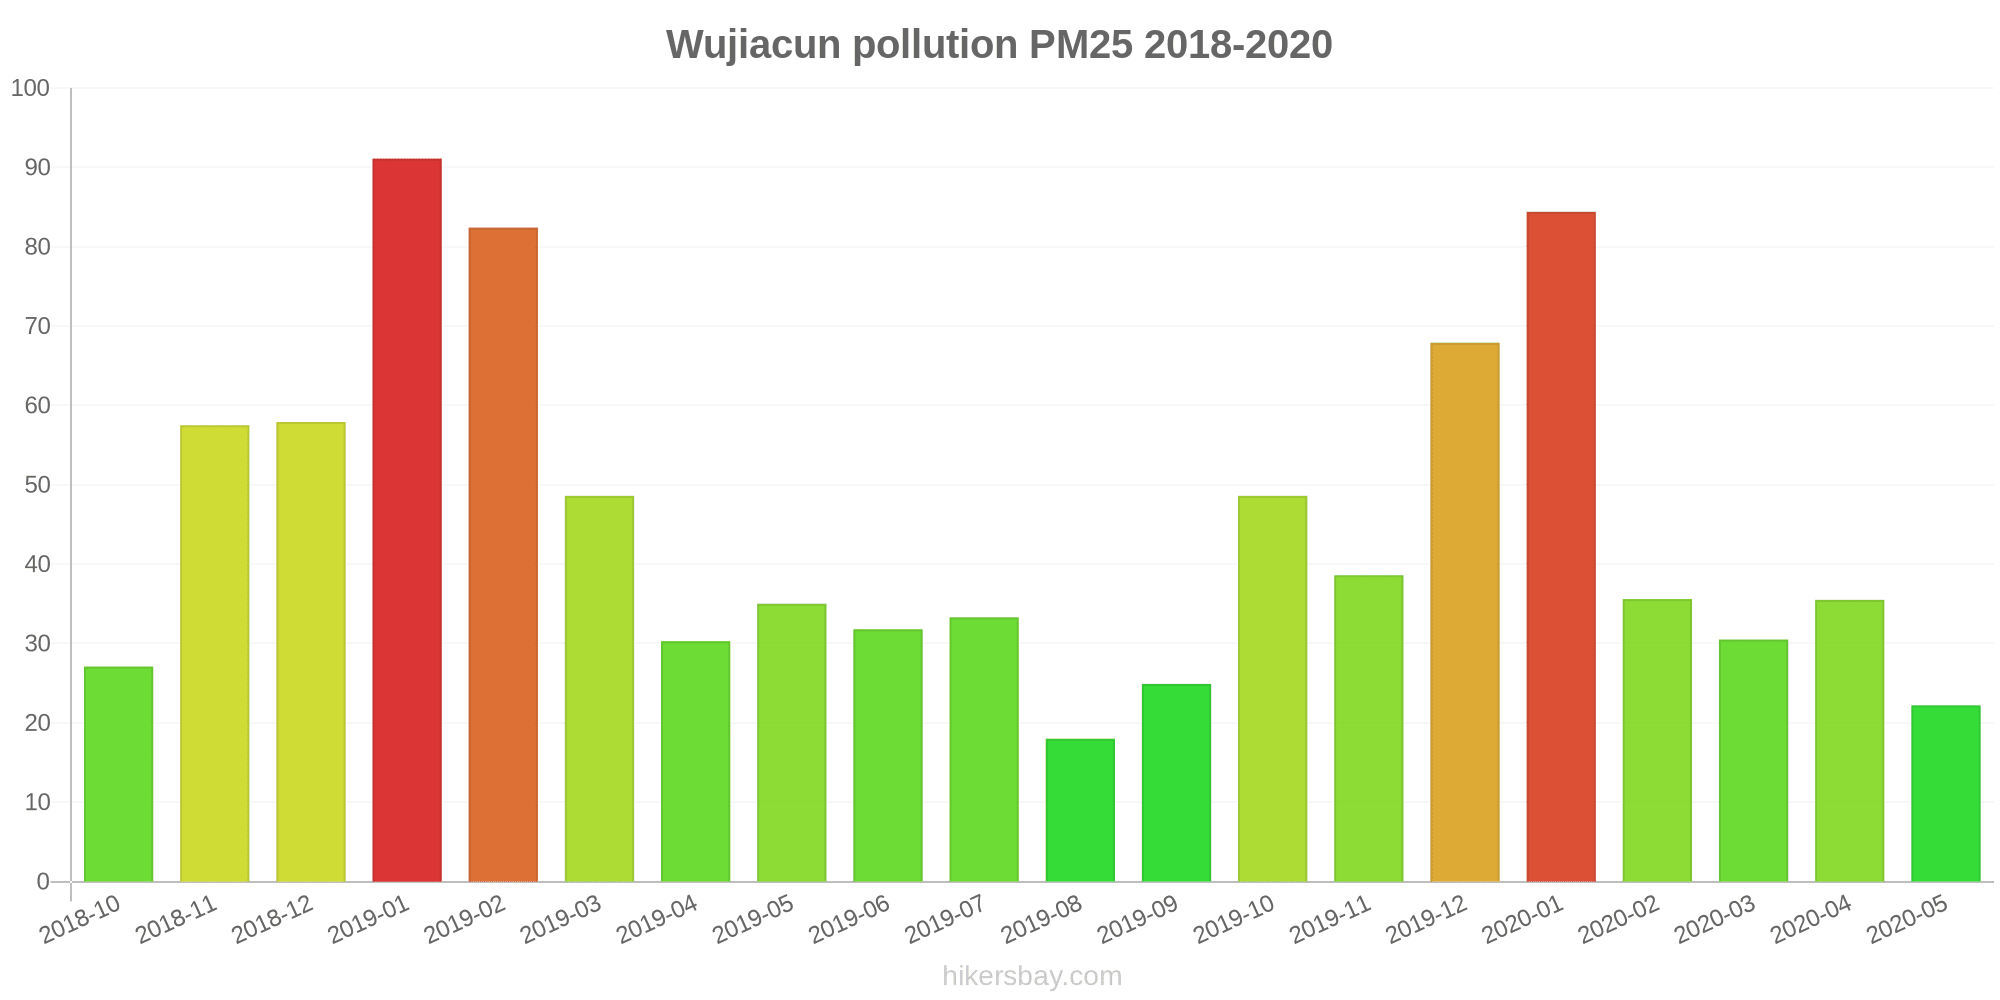
The highest PM2.5 values were recorded: 91 (January 2019).
The lowest level of particulate matter PM2.5 pollution occurs in month: August (18).
What is the level of SO2 pollution? (sulfur dioxide (SO2))
18 (Good)
How high is the level of NO2? (nitrogen dioxide (NO2))
3 (Good)
How high is the CO level? (carbon monoxide (CO))
1 (Good)
Current data Friday, May 27, 2022, 12:00 PM
PM10 53 (Unhealthy for Sensitive Groups)
O3 0 (Good)
PM2,5 7 (Good)
SO2 18 (Good)
NO2 3 (Good)
CO 1 (Good)
Data on air pollution from recent days in Wujiacun
index
2022-05-27
pm10
51
Unhealthy for Sensitive Groups
o3
0
Good
pm25
21
Moderate
so2
10
Good
no2
0
Good
co
1
Good
data source »
Air pollution in Wujiacun from October 2018 to May 2020
index
2020-05
2020-04
2020-03
2020-02
2020-01
2019-12
2019-11
2019-10
2019-09
2019-08
2019-07
2019-06
2019-05
2019-04
2019-03
2019-02
2019-01
2018-12
2018-11
2018-10
pm25
22 (Moderate)
36 (Unhealthy for Sensitive Groups)
31 (Moderate)
36 (Unhealthy for Sensitive Groups)
84 (Very Unhealthy)
68 (Unhealthy)
39 (Unhealthy for Sensitive Groups)
49 (Unhealthy for Sensitive Groups)
25 (Moderate)
18 (Moderate)
33 (Moderate)
32 (Moderate)
35 (Unhealthy for Sensitive Groups)
30 (Moderate)
49 (Unhealthy for Sensitive Groups)
82 (Very Unhealthy)
91 (Very Unhealthy)
58 (Unhealthy)
58 (Unhealthy)
27 (Moderate)
co
566 (Good)
525 (Good)
557 (Good)
617 (Good)
974 (Good)
880 (Good)
647 (Good)
707 (Good)
625 (Good)
446 (Good)
498 (Good)
533 (Good)
512 (Good)
451 (Good)
620 (Good)
991 (Good)
1 (Good)
876 (Good)
751 (Good)
508 (Good)
no2
24 (Good)
34 (Good)
28 (Good)
22 (Good)
42 (Moderate)
52 (Moderate)
45 (Moderate)
52 (Moderate)
34 (Good)
19 (Good)
18 (Good)
17 (Good)
39 (Good)
37 (Good)
46 (Moderate)
50 (Moderate)
64 (Moderate)
50 (Moderate)
50 (Moderate)
46 (Moderate)
o3
123 (Unhealthy for Sensitive Groups)
128 (Unhealthy for Sensitive Groups)
106 (Moderate)
89 (Moderate)
73 (Moderate)
64 (Good)
85 (Moderate)
123 (Unhealthy for Sensitive Groups)
150 (Unhealthy)
119 (Moderate)
143 (Unhealthy for Sensitive Groups)
155 (Unhealthy)
160 (Unhealthy)
121 (Unhealthy for Sensitive Groups)
112 (Moderate)
86 (Moderate)
58 (Good)
54 (Good)
88 (Moderate)
107 (Moderate)
pm10
54 (Unhealthy for Sensitive Groups)
78 (Unhealthy for Sensitive Groups)
68 (Unhealthy for Sensitive Groups)
50 (Unhealthy for Sensitive Groups)
109 (Unhealthy)
99 (Unhealthy)
88 (Unhealthy)
109 (Unhealthy)
58 (Unhealthy for Sensitive Groups)
37 (Moderate)
53 (Unhealthy for Sensitive Groups)
52 (Unhealthy for Sensitive Groups)
73 (Unhealthy for Sensitive Groups)
71 (Unhealthy for Sensitive Groups)
93 (Unhealthy)
121 (Very Unhealthy)
142 (Very Unhealthy)
109 (Unhealthy)
115 (Very Unhealthy)
70 (Unhealthy for Sensitive Groups)
so2
5.4 (Good)
7.7 (Good)
7.2 (Good)
7.2 (Good)
14 (Good)
12 (Good)
8.8 (Good)
7.7 (Good)
5.8 (Good)
5.7 (Good)
4.8 (Good)
4.2 (Good)
7.6 (Good)
5.4 (Good)
8.6 (Good)
12 (Good)
18 (Good)
13 (Good)
8.8 (Good)
6.4 (Good)
data source »
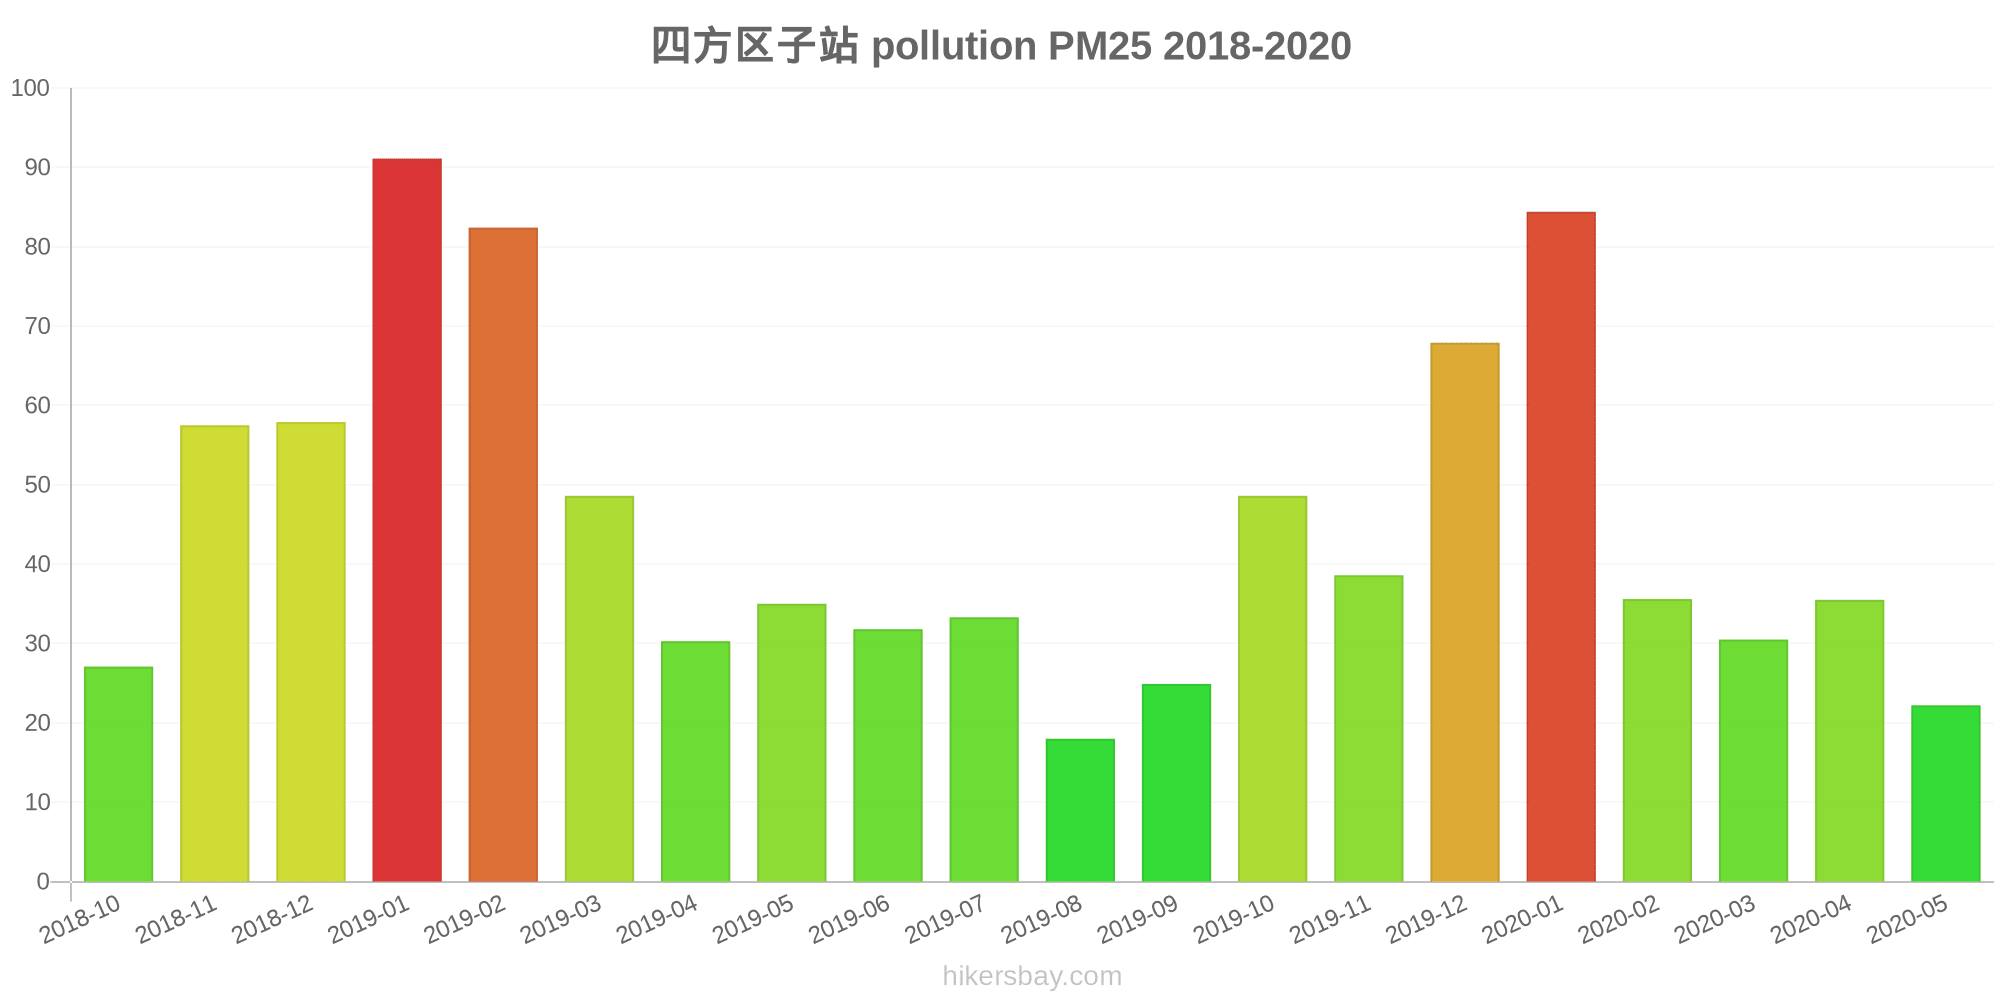
四方区子站
Friday, May 27, 2022, 12:00 PM
PM10 53 (Unhealthy for Sensitive Groups)
particulate matter (PM10) suspended dust
O3 0.02 (Good)
ozone (O3)
PM2,5 6.6 (Good)
particulate matter (PM2.5) dust
SO2 18 (Good)
sulfur dioxide (SO2)
NO2 3 (Good)
nitrogen dioxide (NO2)
CO 1.3 (Good)
carbon monoxide (CO)
四方区子站
index
2022-05-27
pm10
51
o3
0.02
pm25
21
so2
9.6
no2
0.38
co
0.64
四方区子站
2018-10 2020-05

index
2020-05
2020-04
2020-03
2020-02
2020-01
2019-12
2019-11
2019-10
2019-09
2019-08
2019-07
2019-06
2019-05
2019-04
2019-03
2019-02
2019-01
2018-12
2018-11
2018-10
pm25
22
36
31
36
84
68
39
49
25
18
33
32
35
30
49
82
91
58
58
27
co
566
525
557
617
974
880
647
707
625
446
498
533
512
451
620
991
1
876
751
508
no2
24
34
28
22
42
52
45
52
34
19
18
17
39
37
46
50
64
50
50
46
o3
123
128
106
89
73
64
85
123
150
119
143
155
160
121
112
86
58
54
88
107
pm10
54
78
68
50
109
99
88
109
58
37
53
52
73
71
93
121
142
109
115
70
so2
5.4
7.7
7.2
7.2
14
12
8.8
7.7
5.8
5.7
4.8
4.2
7.6
5.4
8.6
12
18
13
8.8
6.4
* Pollution data source:
https://openaq.org
(ChinaAQIData)
The data is licensed under CC-By 4.0
PM10 53 (Unhealthy for Sensitive Groups)
O3 0 (Good)
PM2,5 7 (Good)
SO2 18 (Good)
NO2 3 (Good)
CO 1 (Good)
Data on air pollution from recent days in Wujiacun
| index | 2022-05-27 |
|---|---|
| pm10 | 51 Unhealthy for Sensitive Groups |
| o3 | 0 Good |
| pm25 | 21 Moderate |
| so2 | 10 Good |
| no2 | 0 Good |
| co | 1 Good |
| index | 2020-05 | 2020-04 | 2020-03 | 2020-02 | 2020-01 | 2019-12 | 2019-11 | 2019-10 | 2019-09 | 2019-08 | 2019-07 | 2019-06 | 2019-05 | 2019-04 | 2019-03 | 2019-02 | 2019-01 | 2018-12 | 2018-11 | 2018-10 |
|---|---|---|---|---|---|---|---|---|---|---|---|---|---|---|---|---|---|---|---|---|
| pm25 | 22 (Moderate) | 36 (Unhealthy for Sensitive Groups) | 31 (Moderate) | 36 (Unhealthy for Sensitive Groups) | 84 (Very Unhealthy) | 68 (Unhealthy) | 39 (Unhealthy for Sensitive Groups) | 49 (Unhealthy for Sensitive Groups) | 25 (Moderate) | 18 (Moderate) | 33 (Moderate) | 32 (Moderate) | 35 (Unhealthy for Sensitive Groups) | 30 (Moderate) | 49 (Unhealthy for Sensitive Groups) | 82 (Very Unhealthy) | 91 (Very Unhealthy) | 58 (Unhealthy) | 58 (Unhealthy) | 27 (Moderate) |
| co | 566 (Good) | 525 (Good) | 557 (Good) | 617 (Good) | 974 (Good) | 880 (Good) | 647 (Good) | 707 (Good) | 625 (Good) | 446 (Good) | 498 (Good) | 533 (Good) | 512 (Good) | 451 (Good) | 620 (Good) | 991 (Good) | 1 (Good) | 876 (Good) | 751 (Good) | 508 (Good) |
| no2 | 24 (Good) | 34 (Good) | 28 (Good) | 22 (Good) | 42 (Moderate) | 52 (Moderate) | 45 (Moderate) | 52 (Moderate) | 34 (Good) | 19 (Good) | 18 (Good) | 17 (Good) | 39 (Good) | 37 (Good) | 46 (Moderate) | 50 (Moderate) | 64 (Moderate) | 50 (Moderate) | 50 (Moderate) | 46 (Moderate) |
| o3 | 123 (Unhealthy for Sensitive Groups) | 128 (Unhealthy for Sensitive Groups) | 106 (Moderate) | 89 (Moderate) | 73 (Moderate) | 64 (Good) | 85 (Moderate) | 123 (Unhealthy for Sensitive Groups) | 150 (Unhealthy) | 119 (Moderate) | 143 (Unhealthy for Sensitive Groups) | 155 (Unhealthy) | 160 (Unhealthy) | 121 (Unhealthy for Sensitive Groups) | 112 (Moderate) | 86 (Moderate) | 58 (Good) | 54 (Good) | 88 (Moderate) | 107 (Moderate) |
| pm10 | 54 (Unhealthy for Sensitive Groups) | 78 (Unhealthy for Sensitive Groups) | 68 (Unhealthy for Sensitive Groups) | 50 (Unhealthy for Sensitive Groups) | 109 (Unhealthy) | 99 (Unhealthy) | 88 (Unhealthy) | 109 (Unhealthy) | 58 (Unhealthy for Sensitive Groups) | 37 (Moderate) | 53 (Unhealthy for Sensitive Groups) | 52 (Unhealthy for Sensitive Groups) | 73 (Unhealthy for Sensitive Groups) | 71 (Unhealthy for Sensitive Groups) | 93 (Unhealthy) | 121 (Very Unhealthy) | 142 (Very Unhealthy) | 109 (Unhealthy) | 115 (Very Unhealthy) | 70 (Unhealthy for Sensitive Groups) |
| so2 | 5.4 (Good) | 7.7 (Good) | 7.2 (Good) | 7.2 (Good) | 14 (Good) | 12 (Good) | 8.8 (Good) | 7.7 (Good) | 5.8 (Good) | 5.7 (Good) | 4.8 (Good) | 4.2 (Good) | 7.6 (Good) | 5.4 (Good) | 8.6 (Good) | 12 (Good) | 18 (Good) | 13 (Good) | 8.8 (Good) | 6.4 (Good) |
PM10 53 (Unhealthy for Sensitive Groups)
particulate matter (PM10) suspended dustO3 0.02 (Good)
ozone (O3)PM2,5 6.6 (Good)
particulate matter (PM2.5) dustSO2 18 (Good)
sulfur dioxide (SO2)NO2 3 (Good)
nitrogen dioxide (NO2)CO 1.3 (Good)
carbon monoxide (CO)四方区子站
| index | 2022-05-27 |
|---|---|
| pm10 | 51 |
| o3 | 0.02 |
| pm25 | 21 |
| so2 | 9.6 |
| no2 | 0.38 |
| co | 0.64 |
四方区子站
| index | 2020-05 | 2020-04 | 2020-03 | 2020-02 | 2020-01 | 2019-12 | 2019-11 | 2019-10 | 2019-09 | 2019-08 | 2019-07 | 2019-06 | 2019-05 | 2019-04 | 2019-03 | 2019-02 | 2019-01 | 2018-12 | 2018-11 | 2018-10 |
|---|---|---|---|---|---|---|---|---|---|---|---|---|---|---|---|---|---|---|---|---|
| pm25 | 22 | 36 | 31 | 36 | 84 | 68 | 39 | 49 | 25 | 18 | 33 | 32 | 35 | 30 | 49 | 82 | 91 | 58 | 58 | 27 |
| co | 566 | 525 | 557 | 617 | 974 | 880 | 647 | 707 | 625 | 446 | 498 | 533 | 512 | 451 | 620 | 991 | 1 | 876 | 751 | 508 |
| no2 | 24 | 34 | 28 | 22 | 42 | 52 | 45 | 52 | 34 | 19 | 18 | 17 | 39 | 37 | 46 | 50 | 64 | 50 | 50 | 46 |
| o3 | 123 | 128 | 106 | 89 | 73 | 64 | 85 | 123 | 150 | 119 | 143 | 155 | 160 | 121 | 112 | 86 | 58 | 54 | 88 | 107 |
| pm10 | 54 | 78 | 68 | 50 | 109 | 99 | 88 | 109 | 58 | 37 | 53 | 52 | 73 | 71 | 93 | 121 | 142 | 109 | 115 | 70 |
| so2 | 5.4 | 7.7 | 7.2 | 7.2 | 14 | 12 | 8.8 | 7.7 | 5.8 | 5.7 | 4.8 | 4.2 | 7.6 | 5.4 | 8.6 | 12 | 18 | 13 | 8.8 | 6.4 |