Air Pollution in Xingsha: Real-time Air Quality Index and smog alert.
Pollution and air quality forecast for Xingsha. Today is Tuesday, June 16, 2026. The following air pollution values have been recorded for Xingsha:- particulate matter (PM10) suspended dust - 179 (Very bad Hazardous)
- particulate matter (PM2.5) dust - 35 (Unhealthy for Sensitive Groups)
- ozone (O3) - 0 (Good)
- nitrogen dioxide (NO2) - 0 (Good)
- sulfur dioxide (SO2) - 0 (Good)

What is the air quality in Xingsha today? Is the air polluted in Xingsha?. Is there smog?
What is the level of PM10 today in Xingsha? (particulate matter (PM10) suspended dust)
The current level of particulate matter PM10 in Xingsha is:
179 (Very bad Hazardous)
The highest PM10 values usually occur in month: 95 (January 2019).
The lowest value of particulate matter PM10 pollution in Xingsha is usually recorded in: February (39).
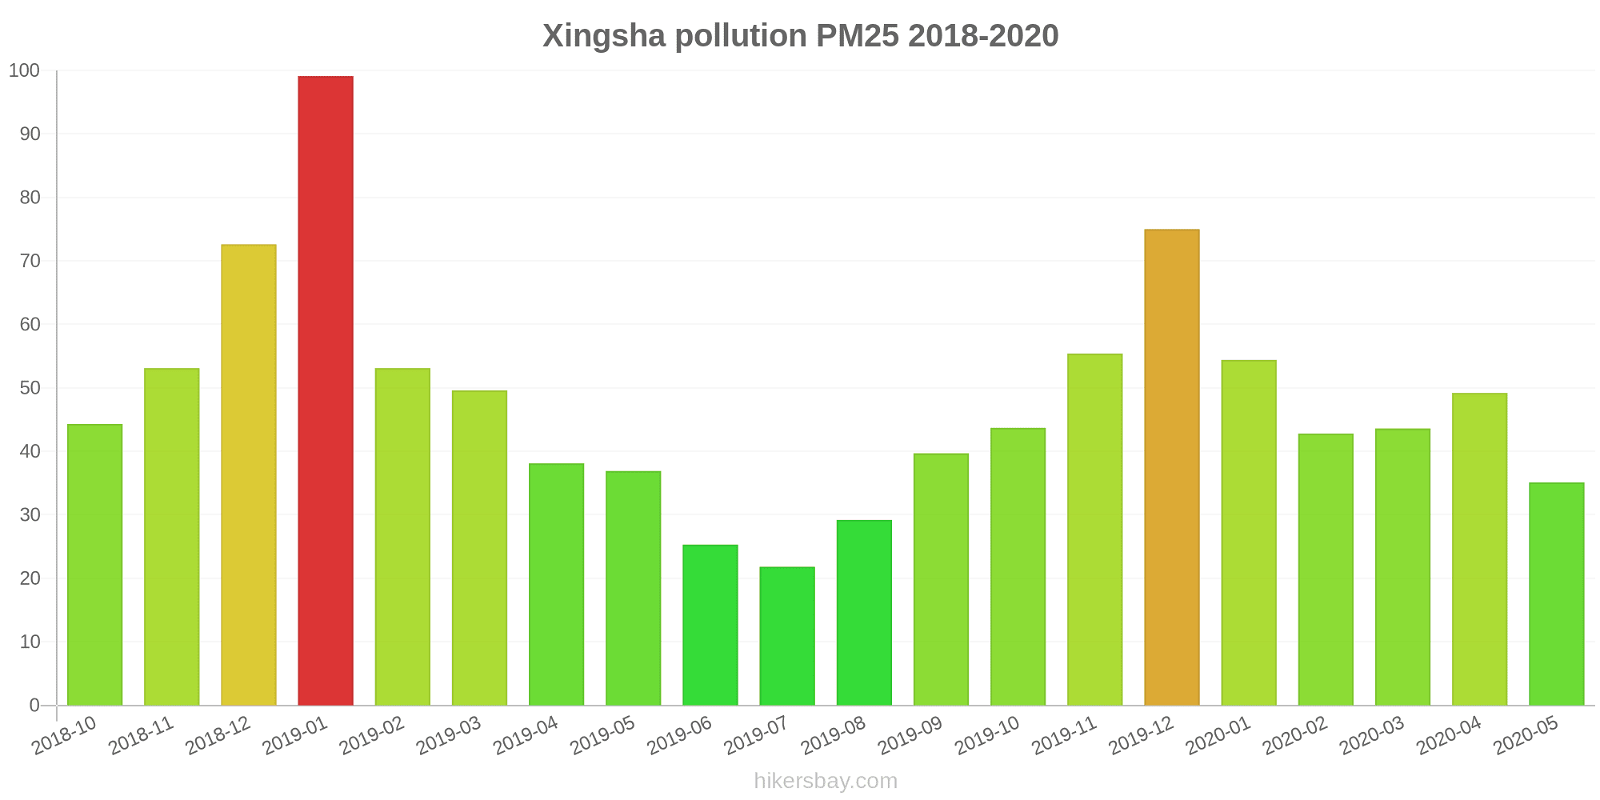
What is the current level of PM2.5 in Xingsha? (particulate matter (PM2.5) dust)
Today's PM2.5 level is:
35 (Unhealthy for Sensitive Groups)
For comparison, the highest level of PM2.5 in Xingsha in the last 7 days was: 56 (Friday, May 27, 2022) and the lowest: 56 (Friday, May 27, 2022).
The highest PM2.5 values were recorded: 99 (January 2019).
The lowest level of particulate matter PM2.5 pollution occurs in month: July (22).
How is the O3 level today in Xingsha? (ozone (O3))
0 (Good)
How high is the level of NO2? (nitrogen dioxide (NO2))
0 (Good)
What is the level of SO2 pollution? (sulfur dioxide (SO2))
0 (Good)
Current data Friday, May 27, 2022, 12:00 PM
PM10 179 (Very bad Hazardous)
PM2,5 35 (Unhealthy for Sensitive Groups)
O3 0 (Good)
NO2 0 (Good)
SO2 0 (Good)
Data on air pollution from recent days in Xingsha
index
2022-05-27
pm10
56
Unhealthy for Sensitive Groups
pm25
56
Unhealthy
o3
0
Good
no2
0
Good
so2
0
Good
data source »
Air pollution in Xingsha from October 2018 to May 2020
index
2020-05
2020-04
2020-03
2020-02
2020-01
2019-12
2019-11
2019-10
2019-09
2019-08
2019-07
2019-06
2019-05
2019-04
2019-03
2019-02
2019-01
2018-12
2018-11
2018-10
pm25
35 (Unhealthy for Sensitive Groups)
49 (Unhealthy for Sensitive Groups)
44 (Unhealthy for Sensitive Groups)
43 (Unhealthy for Sensitive Groups)
54 (Unhealthy for Sensitive Groups)
75 (Very Unhealthy)
55 (Unhealthy)
44 (Unhealthy for Sensitive Groups)
40 (Unhealthy for Sensitive Groups)
29 (Moderate)
22 (Moderate)
25 (Moderate)
37 (Unhealthy for Sensitive Groups)
38 (Unhealthy for Sensitive Groups)
50 (Unhealthy for Sensitive Groups)
53 (Unhealthy for Sensitive Groups)
99 (Very Unhealthy)
73 (Unhealthy)
53 (Unhealthy for Sensitive Groups)
44 (Unhealthy for Sensitive Groups)
co
761 (Good)
780 (Good)
910 (Good)
868 (Good)
1 (Good)
1 (Good)
901 (Good)
804 (Good)
777 (Good)
677 (Good)
581 (Good)
562 (Good)
573 (Good)
643 (Good)
701 (Good)
802 (Good)
983 (Good)
971 (Good)
837 (Good)
685 (Good)
no2
24 (Good)
38 (Good)
27 (Good)
16 (Good)
29 (Good)
53 (Moderate)
45 (Moderate)
37 (Good)
26 (Good)
18 (Good)
19 (Good)
23 (Good)
34 (Good)
34 (Good)
45 (Moderate)
28 (Good)
47 (Moderate)
42 (Moderate)
43 (Moderate)
47 (Moderate)
o3
121 (Unhealthy for Sensitive Groups)
143 (Unhealthy for Sensitive Groups)
84 (Moderate)
81 (Moderate)
56 (Good)
70 (Good)
107 (Moderate)
120 (Unhealthy for Sensitive Groups)
182 (Very Unhealthy)
177 (Unhealthy)
139 (Unhealthy for Sensitive Groups)
136 (Unhealthy for Sensitive Groups)
137 (Unhealthy for Sensitive Groups)
105 (Moderate)
86 (Moderate)
49 (Good)
43 (Good)
33 (Good)
71 (Moderate)
98 (Moderate)
pm10
54 (Unhealthy for Sensitive Groups)
64 (Unhealthy for Sensitive Groups)
49 (Moderate)
39 (Moderate)
49 (Moderate)
78 (Unhealthy for Sensitive Groups)
84 (Unhealthy)
67 (Unhealthy for Sensitive Groups)
70 (Unhealthy for Sensitive Groups)
51 (Unhealthy for Sensitive Groups)
39 (Moderate)
42 (Moderate)
72 (Unhealthy for Sensitive Groups)
55 (Unhealthy for Sensitive Groups)
63 (Unhealthy for Sensitive Groups)
53 (Unhealthy for Sensitive Groups)
95 (Unhealthy)
79 (Unhealthy for Sensitive Groups)
63 (Unhealthy for Sensitive Groups)
68 (Unhealthy for Sensitive Groups)
so2
8.1 (Good)
8.1 (Good)
6.4 (Good)
4.5 (Good)
3.4 (Good)
8.2 (Good)
9.7 (Good)
12 (Good)
11 (Good)
9.3 (Good)
7.3 (Good)
7 (Good)
7.9 (Good)
6.5 (Good)
6.4 (Good)
4.2 (Good)
5.1 (Good)
6.9 (Good)
8.6 (Good)
11 (Good)
data source »
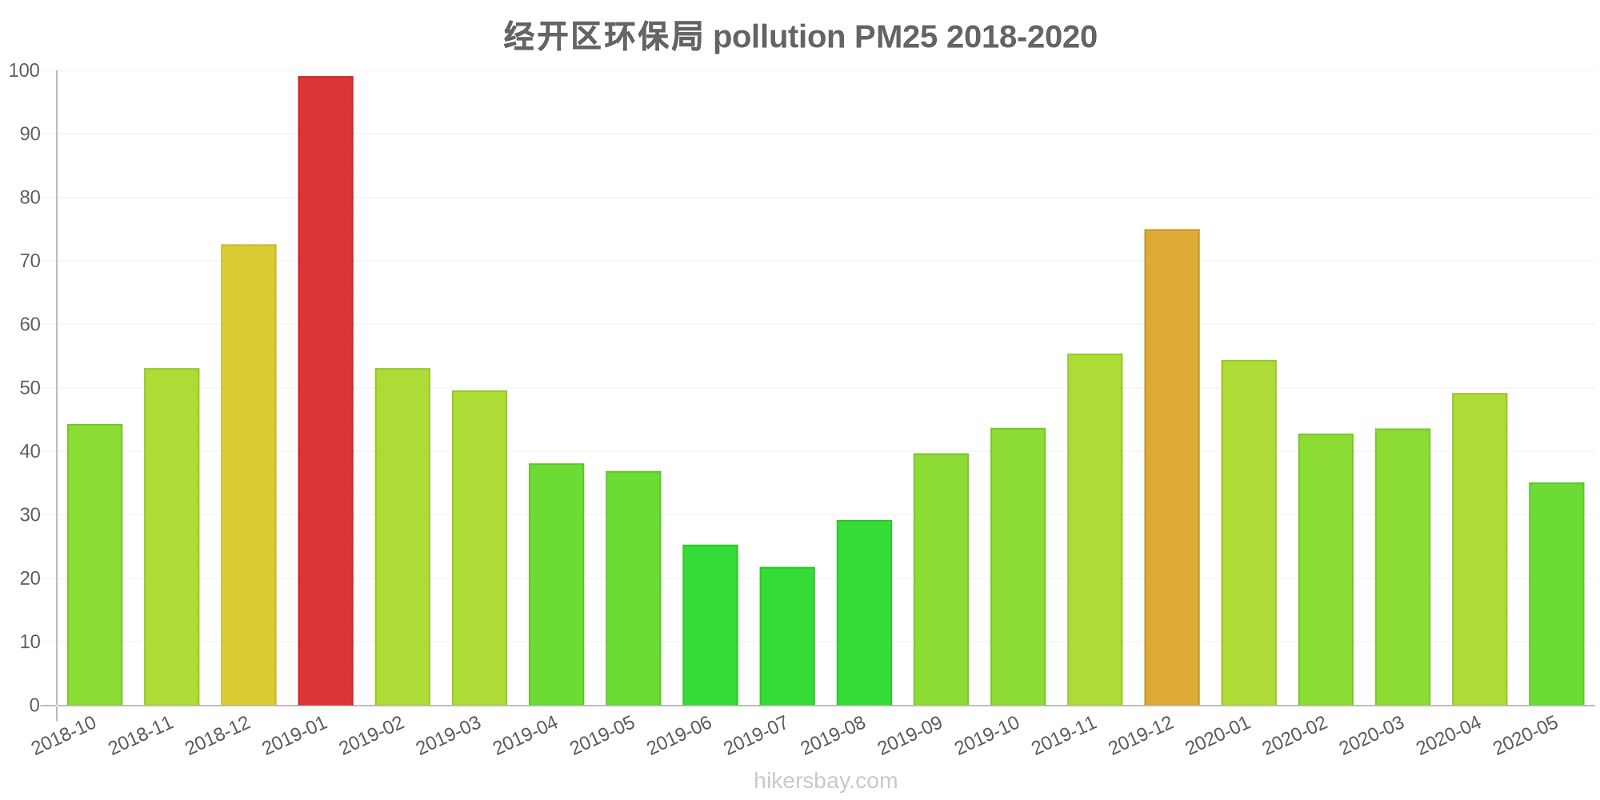
经开区环保局
Friday, May 27, 2022, 12:00 PM
PM10 179 (Very bad Hazardous)
particulate matter (PM10) suspended dust
PM2,5 35 (Unhealthy for Sensitive Groups)
particulate matter (PM2.5) dust
O3 0.04 (Good)
ozone (O3)
NO2 0 (Good)
nitrogen dioxide (NO2)
SO2 0 (Good)
sulfur dioxide (SO2)
经开区环保局
index
2022-05-27
pm10
56
pm25
56
o3
0.03
no2
0
so2
0
经开区环保局
2018-10 2020-05
index
2020-05
2020-04
2020-03
2020-02
2020-01
2019-12
2019-11
2019-10
2019-09
2019-08
2019-07
2019-06
2019-05
2019-04
2019-03
2019-02
2019-01
2018-12
2018-11
2018-10
pm25
35
49
44
43
54
75
55
44
40
29
22
25
37
38
50
53
99
73
53
44
co
761
780
910
868
1
1
901
804
777
677
581
562
573
643
701
802
983
971
837
685
no2
24
38
27
16
29
53
45
37
26
18
19
23
34
34
45
28
47
42
43
47
o3
121
143
84
81
56
70
107
120
182
177
139
136
137
105
86
49
43
33
71
98
pm10
54
64
49
39
49
78
84
67
70
51
39
42
72
55
63
53
95
79
63
68
so2
8.1
8.1
6.4
4.5
3.4
8.2
9.7
12
11
9.3
7.3
7
7.9
6.5
6.4
4.2
5.1
6.9
8.6
11
* Pollution data source:
https://openaq.org
(ChinaAQIData)
The data is licensed under CC-By 4.0
PM10 179 (Very bad Hazardous)
PM2,5 35 (Unhealthy for Sensitive Groups)
O3 0 (Good)
NO2 0 (Good)
SO2 0 (Good)
Data on air pollution from recent days in Xingsha
| index | 2022-05-27 |
|---|---|
| pm10 | 56 Unhealthy for Sensitive Groups |
| pm25 | 56 Unhealthy |
| o3 | 0 Good |
| no2 | 0 Good |
| so2 | 0 Good |

| index | 2020-05 | 2020-04 | 2020-03 | 2020-02 | 2020-01 | 2019-12 | 2019-11 | 2019-10 | 2019-09 | 2019-08 | 2019-07 | 2019-06 | 2019-05 | 2019-04 | 2019-03 | 2019-02 | 2019-01 | 2018-12 | 2018-11 | 2018-10 |
|---|---|---|---|---|---|---|---|---|---|---|---|---|---|---|---|---|---|---|---|---|
| pm25 | 35 (Unhealthy for Sensitive Groups) | 49 (Unhealthy for Sensitive Groups) | 44 (Unhealthy for Sensitive Groups) | 43 (Unhealthy for Sensitive Groups) | 54 (Unhealthy for Sensitive Groups) | 75 (Very Unhealthy) | 55 (Unhealthy) | 44 (Unhealthy for Sensitive Groups) | 40 (Unhealthy for Sensitive Groups) | 29 (Moderate) | 22 (Moderate) | 25 (Moderate) | 37 (Unhealthy for Sensitive Groups) | 38 (Unhealthy for Sensitive Groups) | 50 (Unhealthy for Sensitive Groups) | 53 (Unhealthy for Sensitive Groups) | 99 (Very Unhealthy) | 73 (Unhealthy) | 53 (Unhealthy for Sensitive Groups) | 44 (Unhealthy for Sensitive Groups) |
| co | 761 (Good) | 780 (Good) | 910 (Good) | 868 (Good) | 1 (Good) | 1 (Good) | 901 (Good) | 804 (Good) | 777 (Good) | 677 (Good) | 581 (Good) | 562 (Good) | 573 (Good) | 643 (Good) | 701 (Good) | 802 (Good) | 983 (Good) | 971 (Good) | 837 (Good) | 685 (Good) |
| no2 | 24 (Good) | 38 (Good) | 27 (Good) | 16 (Good) | 29 (Good) | 53 (Moderate) | 45 (Moderate) | 37 (Good) | 26 (Good) | 18 (Good) | 19 (Good) | 23 (Good) | 34 (Good) | 34 (Good) | 45 (Moderate) | 28 (Good) | 47 (Moderate) | 42 (Moderate) | 43 (Moderate) | 47 (Moderate) |
| o3 | 121 (Unhealthy for Sensitive Groups) | 143 (Unhealthy for Sensitive Groups) | 84 (Moderate) | 81 (Moderate) | 56 (Good) | 70 (Good) | 107 (Moderate) | 120 (Unhealthy for Sensitive Groups) | 182 (Very Unhealthy) | 177 (Unhealthy) | 139 (Unhealthy for Sensitive Groups) | 136 (Unhealthy for Sensitive Groups) | 137 (Unhealthy for Sensitive Groups) | 105 (Moderate) | 86 (Moderate) | 49 (Good) | 43 (Good) | 33 (Good) | 71 (Moderate) | 98 (Moderate) |
| pm10 | 54 (Unhealthy for Sensitive Groups) | 64 (Unhealthy for Sensitive Groups) | 49 (Moderate) | 39 (Moderate) | 49 (Moderate) | 78 (Unhealthy for Sensitive Groups) | 84 (Unhealthy) | 67 (Unhealthy for Sensitive Groups) | 70 (Unhealthy for Sensitive Groups) | 51 (Unhealthy for Sensitive Groups) | 39 (Moderate) | 42 (Moderate) | 72 (Unhealthy for Sensitive Groups) | 55 (Unhealthy for Sensitive Groups) | 63 (Unhealthy for Sensitive Groups) | 53 (Unhealthy for Sensitive Groups) | 95 (Unhealthy) | 79 (Unhealthy for Sensitive Groups) | 63 (Unhealthy for Sensitive Groups) | 68 (Unhealthy for Sensitive Groups) |
| so2 | 8.1 (Good) | 8.1 (Good) | 6.4 (Good) | 4.5 (Good) | 3.4 (Good) | 8.2 (Good) | 9.7 (Good) | 12 (Good) | 11 (Good) | 9.3 (Good) | 7.3 (Good) | 7 (Good) | 7.9 (Good) | 6.5 (Good) | 6.4 (Good) | 4.2 (Good) | 5.1 (Good) | 6.9 (Good) | 8.6 (Good) | 11 (Good) |
PM10 179 (Very bad Hazardous)
particulate matter (PM10) suspended dustPM2,5 35 (Unhealthy for Sensitive Groups)
particulate matter (PM2.5) dustO3 0.04 (Good)
ozone (O3)NO2 0 (Good)
nitrogen dioxide (NO2)SO2 0 (Good)
sulfur dioxide (SO2)经开区环保局
| index | 2022-05-27 |
|---|---|
| pm10 | 56 |
| pm25 | 56 |
| o3 | 0.03 |
| no2 | 0 |
| so2 | 0 |
经开区环保局

| index | 2020-05 | 2020-04 | 2020-03 | 2020-02 | 2020-01 | 2019-12 | 2019-11 | 2019-10 | 2019-09 | 2019-08 | 2019-07 | 2019-06 | 2019-05 | 2019-04 | 2019-03 | 2019-02 | 2019-01 | 2018-12 | 2018-11 | 2018-10 |
|---|---|---|---|---|---|---|---|---|---|---|---|---|---|---|---|---|---|---|---|---|
| pm25 | 35 | 49 | 44 | 43 | 54 | 75 | 55 | 44 | 40 | 29 | 22 | 25 | 37 | 38 | 50 | 53 | 99 | 73 | 53 | 44 |
| co | 761 | 780 | 910 | 868 | 1 | 1 | 901 | 804 | 777 | 677 | 581 | 562 | 573 | 643 | 701 | 802 | 983 | 971 | 837 | 685 |
| no2 | 24 | 38 | 27 | 16 | 29 | 53 | 45 | 37 | 26 | 18 | 19 | 23 | 34 | 34 | 45 | 28 | 47 | 42 | 43 | 47 |
| o3 | 121 | 143 | 84 | 81 | 56 | 70 | 107 | 120 | 182 | 177 | 139 | 136 | 137 | 105 | 86 | 49 | 43 | 33 | 71 | 98 |
| pm10 | 54 | 64 | 49 | 39 | 49 | 78 | 84 | 67 | 70 | 51 | 39 | 42 | 72 | 55 | 63 | 53 | 95 | 79 | 63 | 68 |
| so2 | 8.1 | 8.1 | 6.4 | 4.5 | 3.4 | 8.2 | 9.7 | 12 | 11 | 9.3 | 7.3 | 7 | 7.9 | 6.5 | 6.4 | 4.2 | 5.1 | 6.9 | 8.6 | 11 |