Air Pollution in Binhaicun: Real-time Air Quality Index and smog alert.
Pollution and air quality forecast for Binhaicun. Today is Saturday, June 20, 2026. The following air pollution values have been recorded for Binhaicun:- particulate matter (PM10) suspended dust - 7 (Good)
- particulate matter (PM2.5) dust - 2 (Good)
- carbon monoxide (CO) - 100 (Good)
- nitrogen dioxide (NO2) - 8 (Good)
- ozone (O3) - 0 (Good)
- sulfur dioxide (SO2) - 9 (Good)

What is the air quality in Binhaicun today? Is the air polluted in Binhaicun?. Is there smog?
What is the level of PM10 today in Binhaicun? (particulate matter (PM10) suspended dust)
The current level of particulate matter PM10 in Binhaicun is:
7 (Good)
The highest PM10 values usually occur in month: 78 (November 2018).
The lowest value of particulate matter PM10 pollution in Binhaicun is usually recorded in: August (23).
What is the current level of PM2.5 in Binhaicun? (particulate matter (PM2.5) dust)
Today's PM2.5 level is:
2 (Good)
For comparison, the highest level of PM2.5 in Binhaicun in the last 7 days was: 24 (Friday, May 27, 2022) and the lowest: 24 (Friday, May 27, 2022).
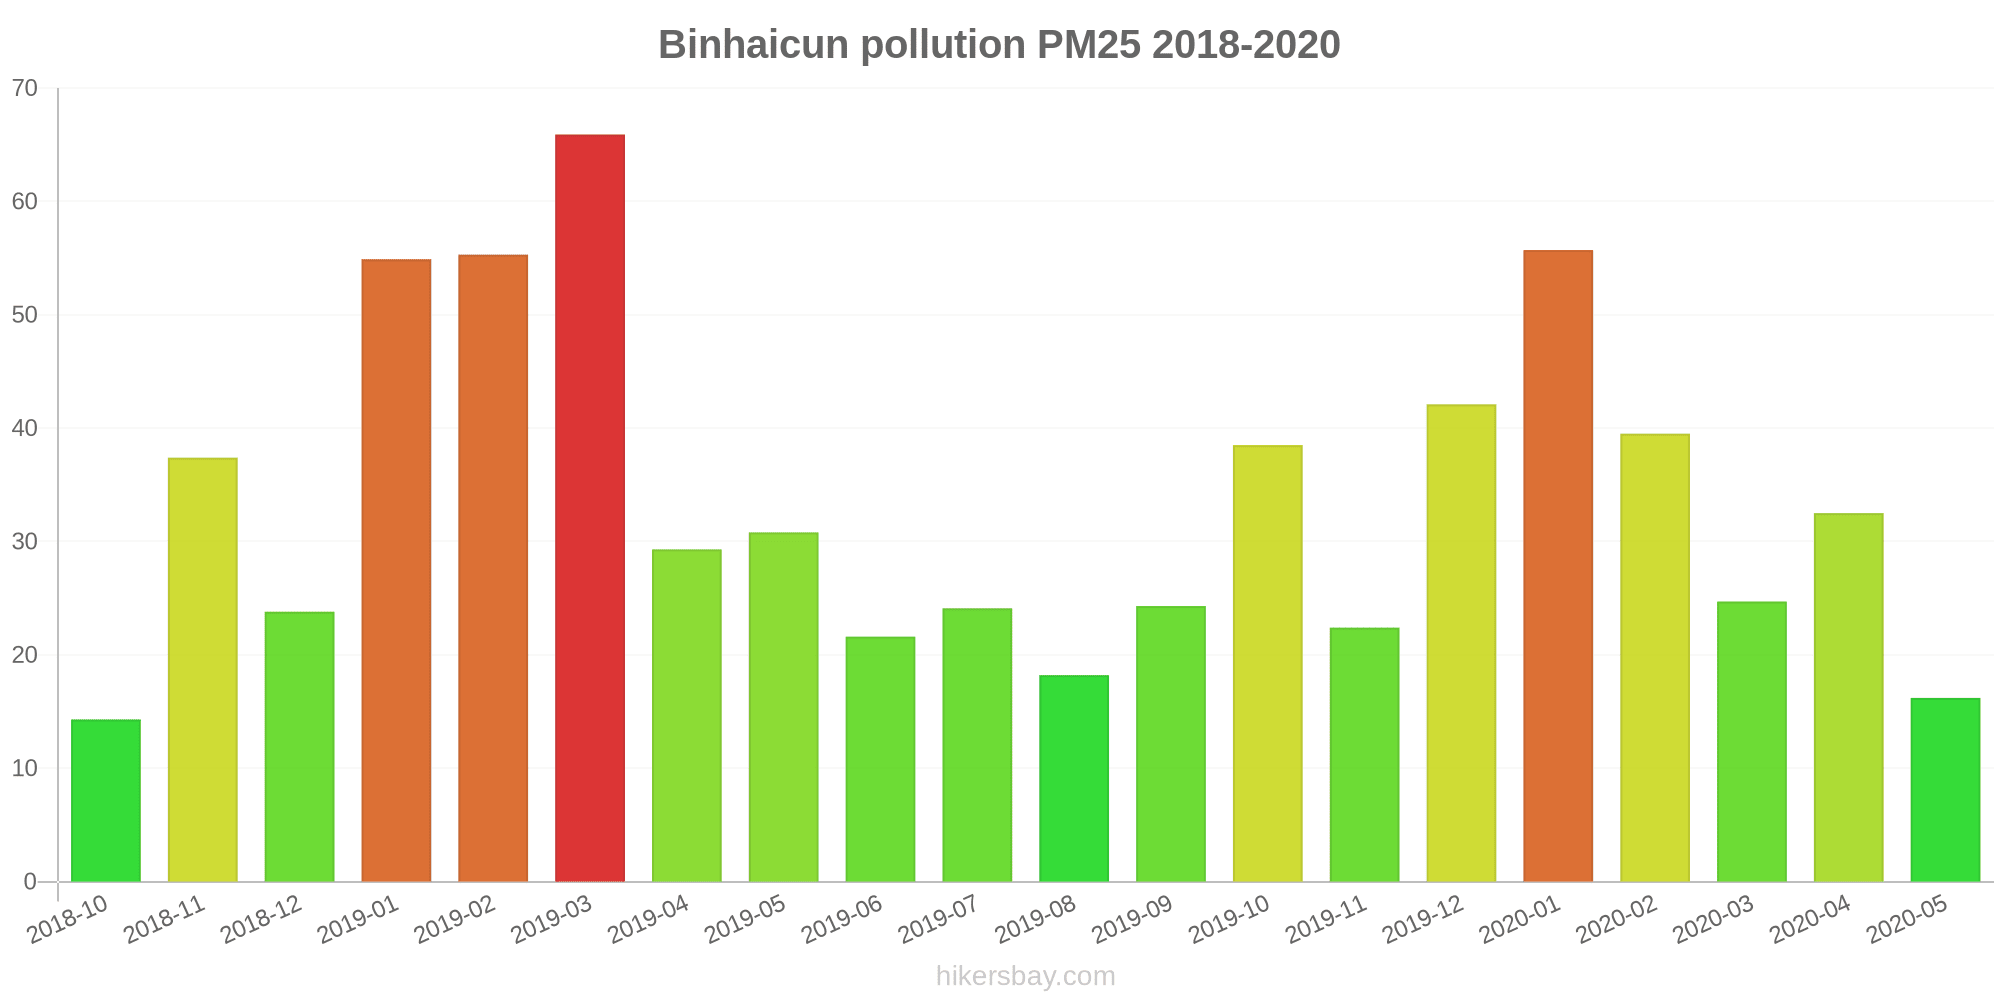
The highest PM2.5 values were recorded: 66 (March 2019).
The lowest level of particulate matter PM2.5 pollution occurs in month: October (14).
How high is the CO level? (carbon monoxide (CO))
100 (Good)
How high is the level of NO2? (nitrogen dioxide (NO2))
8 (Good)
How is the O3 level today in Binhaicun? (ozone (O3))
0 (Good)
What is the level of SO2 pollution? (sulfur dioxide (SO2))
9 (Good)
Current data Friday, May 27, 2022, 12:00 PM
PM10 7 (Good)
PM2,5 2 (Good)
CO 100 (Good)
NO2 8 (Good)
O3 0 (Good)
SO2 9 (Good)
Data on air pollution from recent days in Binhaicun
index
2022-05-27
pm10
32
Moderate
pm25
24
Moderate
co
468
Good
no2
21
Good
o3
32
Good
so2
5
Good
data source »
Air pollution in Binhaicun from October 2018 to May 2020

index
2020-05
2020-04
2020-03
2020-02
2020-01
2019-12
2019-11
2019-10
2019-09
2019-08
2019-07
2019-06
2019-05
2019-04
2019-03
2019-02
2019-01
2018-12
2018-11
2018-10
pm25
16 (Moderate)
33 (Moderate)
25 (Moderate)
40 (Unhealthy for Sensitive Groups)
56 (Unhealthy)
42 (Unhealthy for Sensitive Groups)
22 (Moderate)
39 (Unhealthy for Sensitive Groups)
24 (Moderate)
18 (Moderate)
24 (Moderate)
22 (Moderate)
31 (Moderate)
29 (Moderate)
66 (Unhealthy)
55 (Unhealthy)
55 (Unhealthy for Sensitive Groups)
24 (Moderate)
37 (Unhealthy for Sensitive Groups)
14 (Moderate)
co
388 (Good)
455 (Good)
431 (Good)
612 (Good)
1 (Good)
802 (Good)
642 (Good)
781 (Good)
813 (Good)
777 (Good)
740 (Good)
664 (Good)
510 (Good)
516 (Good)
643 (Good)
638 (Good)
683 (Good)
467 (Good)
728 (Good)
541 (Good)
no2
19 (Good)
25 (Good)
25 (Good)
21 (Good)
40 (Moderate)
31 (Good)
25 (Good)
24 (Good)
21 (Good)
14 (Good)
8.4 (Good)
12 (Good)
18 (Good)
23 (Good)
30 (Good)
25 (Good)
31 (Good)
27 (Good)
30 (Good)
16 (Good)
o3
126 (Unhealthy for Sensitive Groups)
128 (Unhealthy for Sensitive Groups)
104 (Moderate)
88 (Moderate)
73 (Moderate)
70 (Good)
70 (Moderate)
106 (Moderate)
144 (Unhealthy for Sensitive Groups)
134 (Unhealthy for Sensitive Groups)
150 (Unhealthy)
154 (Unhealthy)
161 (Unhealthy)
116 (Moderate)
95 (Moderate)
75 (Moderate)
66 (Good)
59 (Good)
76 (Moderate)
89 (Moderate)
pm10
36 (Moderate)
57 (Unhealthy for Sensitive Groups)
46 (Moderate)
55 (Unhealthy for Sensitive Groups)
69 (Unhealthy for Sensitive Groups)
55 (Unhealthy for Sensitive Groups)
44 (Moderate)
64 (Unhealthy for Sensitive Groups)
35 (Moderate)
23 (Moderate)
27 (Moderate)
28 (Moderate)
57 (Unhealthy for Sensitive Groups)
54 (Unhealthy for Sensitive Groups)
69 (Unhealthy for Sensitive Groups)
62 (Unhealthy for Sensitive Groups)
72 (Unhealthy for Sensitive Groups)
49 (Moderate)
78 (Unhealthy for Sensitive Groups)
36 (Moderate)
so2
6.2 (Good)
10 (Good)
12 (Good)
14 (Good)
22 (Good)
17 (Good)
11 (Good)
7.5 (Good)
11 (Good)
6.4 (Good)
6 (Good)
7.5 (Good)
9.9 (Good)
8.9 (Good)
9.3 (Good)
16 (Good)
18 (Good)
13 (Good)
14 (Good)
6.2 (Good)
data source »
傅家庄
Friday, May 27, 2022, 12:00 PM
PM10 6.7 (Good)
particulate matter (PM10) suspended dust
PM2,5 1.7 (Good)
particulate matter (PM2.5) dust
CO 100 (Good)
carbon monoxide (CO)
NO2 7.6 (Good)
nitrogen dioxide (NO2)
O3 0.02 (Good)
ozone (O3)
SO2 8.6 (Good)
sulfur dioxide (SO2)
傅家庄
index
2022-05-27
pm10
32
pm25
24
co
468
no2
21
o3
32
so2
4.6
傅家庄
2018-10 2020-05

index
2020-05
2020-04
2020-03
2020-02
2020-01
2019-12
2019-11
2019-10
2019-09
2019-08
2019-07
2019-06
2019-05
2019-04
2019-03
2019-02
2019-01
2018-12
2018-11
2018-10
pm25
16
33
25
40
56
42
22
39
24
18
24
22
31
29
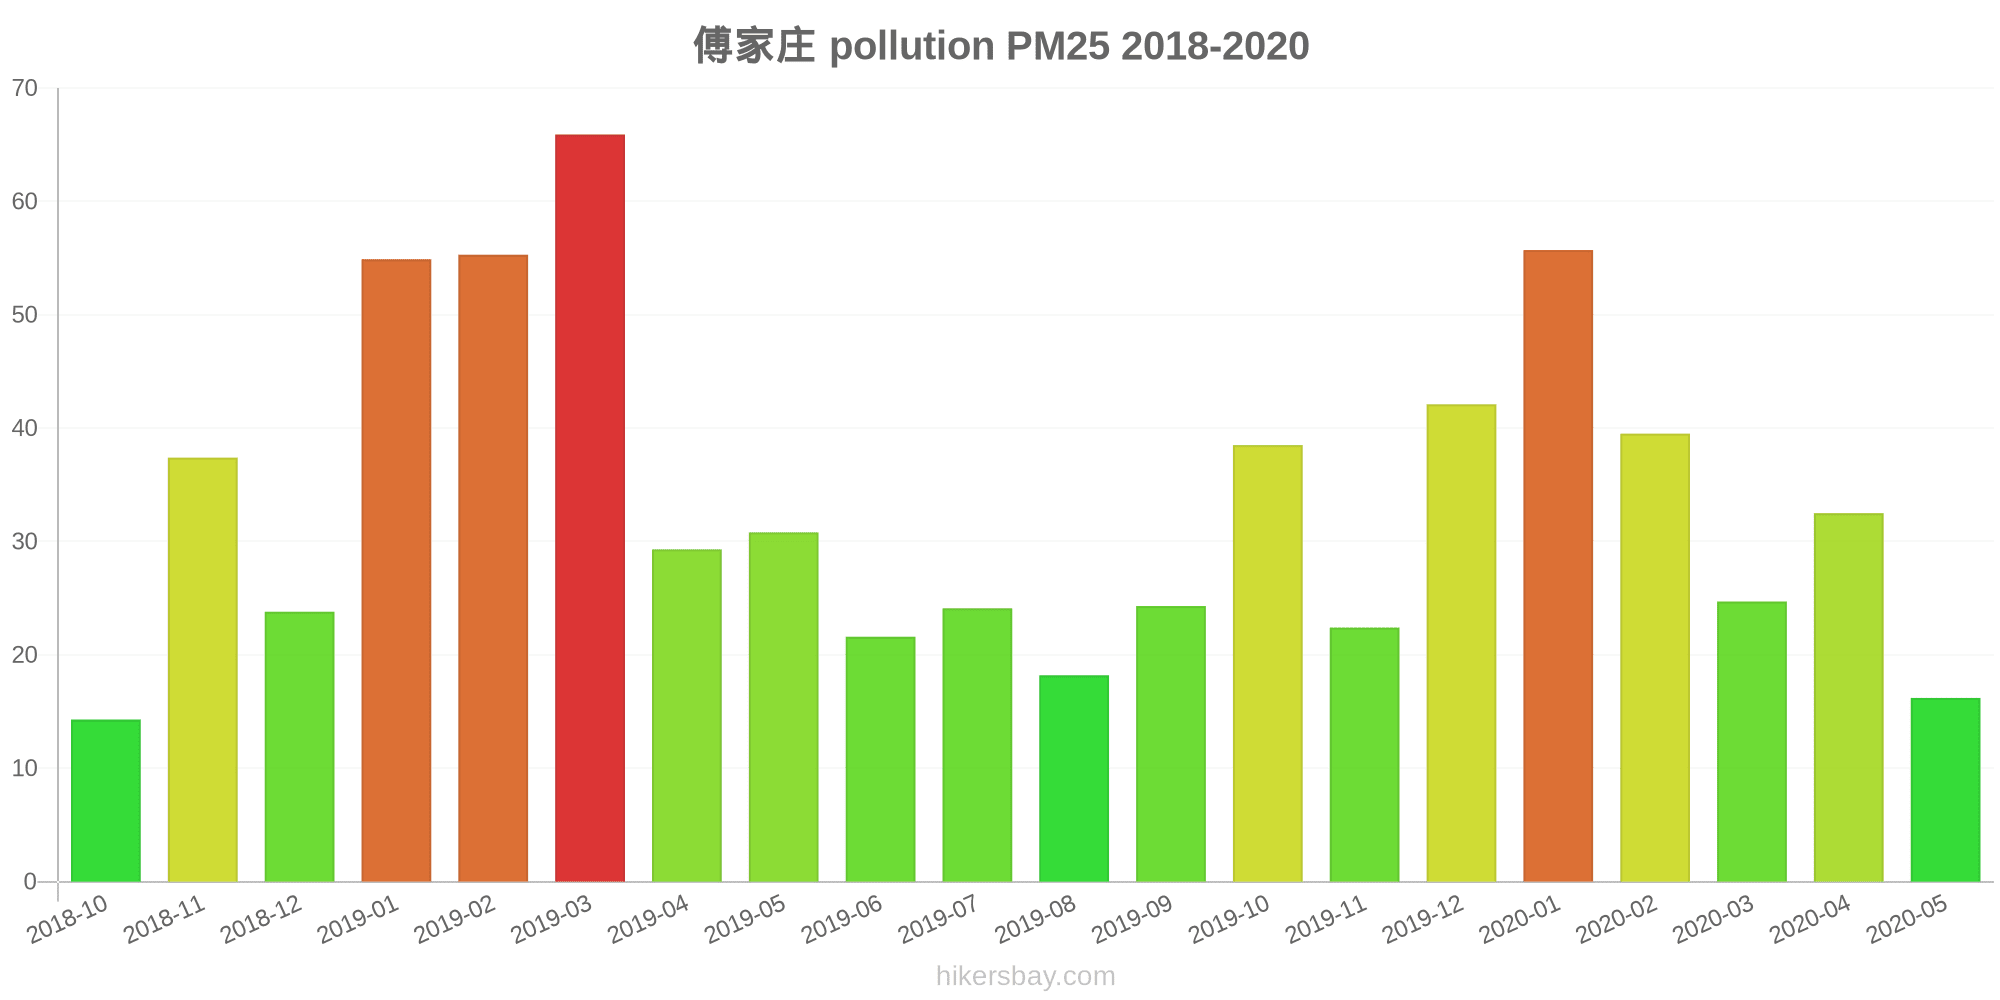
66
55
55
24
37
14
co
388
455
431
612
1
802
642
781
813
777
740
664
510
516
643
638
683
467
728
541
no2
19
25
25
21
40
31
25
24
21
14
8.4
12
18
23
30
25
31
27
30
16
o3
126
128
104
88
73
70
70
106
144
134
150
154
161
116
95
75
66
59
76
89
pm10
36
57
46
55
69
55
44
64
35
23
27
28
57
54
69
62
72
49
78
36
so2
6.2
10
12
14
22
17
11
7.5
11
6.4
6
7.5
9.9
8.9
9.3
16
18
13
14
6.2
* Pollution data source:
https://openaq.org
(ChinaAQIData)
The data is licensed under CC-By 4.0
PM10 7 (Good)
PM2,5 2 (Good)
CO 100 (Good)
NO2 8 (Good)
O3 0 (Good)
SO2 9 (Good)
Data on air pollution from recent days in Binhaicun
| index | 2022-05-27 |
|---|---|
| pm10 | 32 Moderate |
| pm25 | 24 Moderate |
| co | 468 Good |
| no2 | 21 Good |
| o3 | 32 Good |
| so2 | 5 Good |
| index | 2020-05 | 2020-04 | 2020-03 | 2020-02 | 2020-01 | 2019-12 | 2019-11 | 2019-10 | 2019-09 | 2019-08 | 2019-07 | 2019-06 | 2019-05 | 2019-04 | 2019-03 | 2019-02 | 2019-01 | 2018-12 | 2018-11 | 2018-10 |
|---|---|---|---|---|---|---|---|---|---|---|---|---|---|---|---|---|---|---|---|---|
| pm25 | 16 (Moderate) | 33 (Moderate) | 25 (Moderate) | 40 (Unhealthy for Sensitive Groups) | 56 (Unhealthy) | 42 (Unhealthy for Sensitive Groups) | 22 (Moderate) | 39 (Unhealthy for Sensitive Groups) | 24 (Moderate) | 18 (Moderate) | 24 (Moderate) | 22 (Moderate) | 31 (Moderate) | 29 (Moderate) | 66 (Unhealthy) | 55 (Unhealthy) | 55 (Unhealthy for Sensitive Groups) | 24 (Moderate) | 37 (Unhealthy for Sensitive Groups) | 14 (Moderate) |
| co | 388 (Good) | 455 (Good) | 431 (Good) | 612 (Good) | 1 (Good) | 802 (Good) | 642 (Good) | 781 (Good) | 813 (Good) | 777 (Good) | 740 (Good) | 664 (Good) | 510 (Good) | 516 (Good) | 643 (Good) | 638 (Good) | 683 (Good) | 467 (Good) | 728 (Good) | 541 (Good) |
| no2 | 19 (Good) | 25 (Good) | 25 (Good) | 21 (Good) | 40 (Moderate) | 31 (Good) | 25 (Good) | 24 (Good) | 21 (Good) | 14 (Good) | 8.4 (Good) | 12 (Good) | 18 (Good) | 23 (Good) | 30 (Good) | 25 (Good) | 31 (Good) | 27 (Good) | 30 (Good) | 16 (Good) |
| o3 | 126 (Unhealthy for Sensitive Groups) | 128 (Unhealthy for Sensitive Groups) | 104 (Moderate) | 88 (Moderate) | 73 (Moderate) | 70 (Good) | 70 (Moderate) | 106 (Moderate) | 144 (Unhealthy for Sensitive Groups) | 134 (Unhealthy for Sensitive Groups) | 150 (Unhealthy) | 154 (Unhealthy) | 161 (Unhealthy) | 116 (Moderate) | 95 (Moderate) | 75 (Moderate) | 66 (Good) | 59 (Good) | 76 (Moderate) | 89 (Moderate) |
| pm10 | 36 (Moderate) | 57 (Unhealthy for Sensitive Groups) | 46 (Moderate) | 55 (Unhealthy for Sensitive Groups) | 69 (Unhealthy for Sensitive Groups) | 55 (Unhealthy for Sensitive Groups) | 44 (Moderate) | 64 (Unhealthy for Sensitive Groups) | 35 (Moderate) | 23 (Moderate) | 27 (Moderate) | 28 (Moderate) | 57 (Unhealthy for Sensitive Groups) | 54 (Unhealthy for Sensitive Groups) | 69 (Unhealthy for Sensitive Groups) | 62 (Unhealthy for Sensitive Groups) | 72 (Unhealthy for Sensitive Groups) | 49 (Moderate) | 78 (Unhealthy for Sensitive Groups) | 36 (Moderate) |
| so2 | 6.2 (Good) | 10 (Good) | 12 (Good) | 14 (Good) | 22 (Good) | 17 (Good) | 11 (Good) | 7.5 (Good) | 11 (Good) | 6.4 (Good) | 6 (Good) | 7.5 (Good) | 9.9 (Good) | 8.9 (Good) | 9.3 (Good) | 16 (Good) | 18 (Good) | 13 (Good) | 14 (Good) | 6.2 (Good) |
PM10 6.7 (Good)
particulate matter (PM10) suspended dustPM2,5 1.7 (Good)
particulate matter (PM2.5) dustCO 100 (Good)
carbon monoxide (CO)NO2 7.6 (Good)
nitrogen dioxide (NO2)O3 0.02 (Good)
ozone (O3)SO2 8.6 (Good)
sulfur dioxide (SO2)傅家庄
| index | 2022-05-27 |
|---|---|
| pm10 | 32 |
| pm25 | 24 |
| co | 468 |
| no2 | 21 |
| o3 | 32 |
| so2 | 4.6 |
傅家庄
| index | 2020-05 | 2020-04 | 2020-03 | 2020-02 | 2020-01 | 2019-12 | 2019-11 | 2019-10 | 2019-09 | 2019-08 | 2019-07 | 2019-06 | 2019-05 | 2019-04 | 2019-03 | 2019-02 | 2019-01 | 2018-12 | 2018-11 | 2018-10 |
|---|---|---|---|---|---|---|---|---|---|---|---|---|---|---|---|---|---|---|---|---|
| pm25 | 16 | 33 | 25 | 40 | 56 | 42 | 22 | 39 | 24 | 18 | 24 | 22 | 31 | 29 | 66 | 55 | 55 | 24 | 37 | 14 |
| co | 388 | 455 | 431 | 612 | 1 | 802 | 642 | 781 | 813 | 777 | 740 | 664 | 510 | 516 | 643 | 638 | 683 | 467 | 728 | 541 |
| no2 | 19 | 25 | 25 | 21 | 40 | 31 | 25 | 24 | 21 | 14 | 8.4 | 12 | 18 | 23 | 30 | 25 | 31 | 27 | 30 | 16 |
| o3 | 126 | 128 | 104 | 88 | 73 | 70 | 70 | 106 | 144 | 134 | 150 | 154 | 161 | 116 | 95 | 75 | 66 | 59 | 76 | 89 |
| pm10 | 36 | 57 | 46 | 55 | 69 | 55 | 44 | 64 | 35 | 23 | 27 | 28 | 57 | 54 | 69 | 62 | 72 | 49 | 78 | 36 |
| so2 | 6.2 | 10 | 12 | 14 | 22 | 17 | 11 | 7.5 | 11 | 6.4 | 6 | 7.5 | 9.9 | 8.9 | 9.3 | 16 | 18 | 13 | 14 | 6.2 |