Air Pollution in Wanglinzhuang: Real-time Air Quality Index and smog alert.
Pollution and air quality forecast for Wanglinzhuang. Today is Tuesday, June 16, 2026. The following air pollution values have been recorded for Wanglinzhuang:- particulate matter (PM10) suspended dust - 53 (Unhealthy for Sensitive Groups)
- ozone (O3) - 0 (Good)
- particulate matter (PM2.5) dust - 7 (Good)
- sulfur dioxide (SO2) - 18 (Good)
- nitrogen dioxide (NO2) - 3 (Good)
- carbon monoxide (CO) - 1 (Good)

What is the air quality in Wanglinzhuang today? Is the air polluted in Wanglinzhuang?. Is there smog?
What is the level of PM10 today in Wanglinzhuang? (particulate matter (PM10) suspended dust)
The current level of particulate matter PM10 in Wanglinzhuang is:
53 (Unhealthy for Sensitive Groups)
The highest PM10 values usually occur in month: 138 (January 2019).
The lowest value of particulate matter PM10 pollution in Wanglinzhuang is usually recorded in: August (38).
How is the O3 level today in Wanglinzhuang? (ozone (O3))
0 (Good)
What is the current level of PM2.5 in Wanglinzhuang? (particulate matter (PM2.5) dust)
Today's PM2.5 level is:
7 (Good)
For comparison, the highest level of PM2.5 in Wanglinzhuang in the last 7 days was: 21 (Friday, May 27, 2022) and the lowest: 21 (Friday, May 27, 2022).
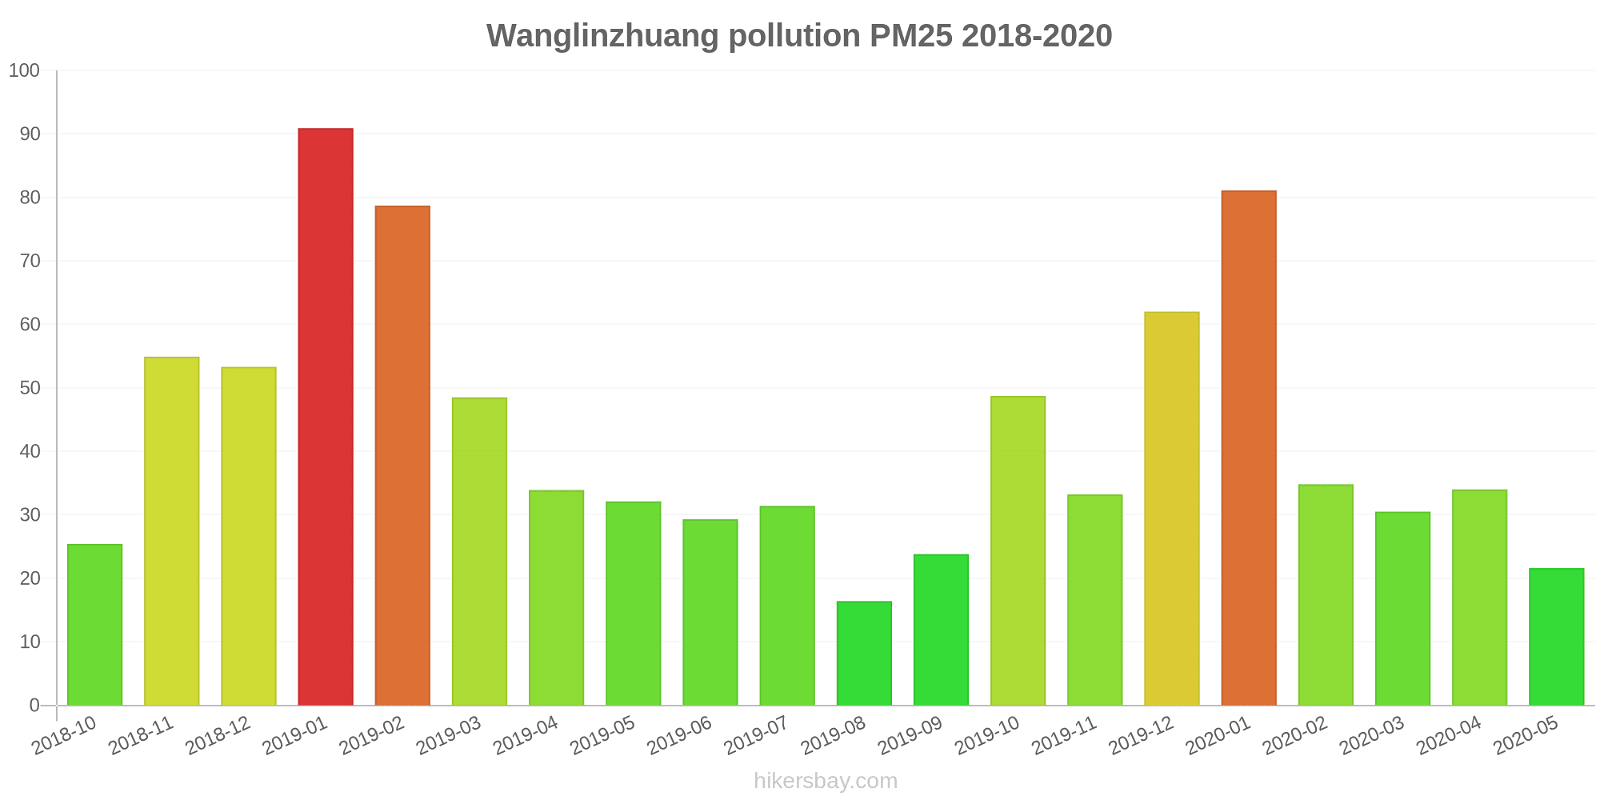
The highest PM2.5 values were recorded: 91 (January 2019).
The lowest level of particulate matter PM2.5 pollution occurs in month: August (16).
What is the level of SO2 pollution? (sulfur dioxide (SO2))
18 (Good)
How high is the level of NO2? (nitrogen dioxide (NO2))
3 (Good)
How high is the CO level? (carbon monoxide (CO))
1 (Good)
Current data Friday, May 27, 2022, 12:00 PM
PM10 53 (Unhealthy for Sensitive Groups)
O3 0 (Good)
PM2,5 7 (Good)
SO2 18 (Good)
NO2 3 (Good)
CO 1 (Good)
Data on air pollution from recent days in Wanglinzhuang
index
2022-05-27
pm10
51
Unhealthy for Sensitive Groups
o3
0
Good
pm25
21
Moderate
so2
10
Good
no2
0
Good
co
1
Good
data source »
Air pollution in Wanglinzhuang from October 2018 to May 2020
index
2020-05
2020-04
2020-03
2020-02
2020-01
2019-12
2019-11
2019-10
2019-09
2019-08
2019-07
2019-06
2019-05
2019-04
2019-03
2019-02
2019-01
2018-12
2018-11
2018-10
pm25
22 (Moderate)
34 (Moderate)
31 (Moderate)
35 (Moderate)
81 (Very Unhealthy)
62 (Unhealthy)
33 (Moderate)
49 (Unhealthy for Sensitive Groups)
24 (Moderate)
16 (Moderate)
31 (Moderate)
29 (Moderate)
32 (Moderate)
34 (Moderate)
49 (Unhealthy for Sensitive Groups)
79 (Very Unhealthy)
91 (Very Unhealthy)
53 (Unhealthy for Sensitive Groups)
55 (Unhealthy for Sensitive Groups)
25 (Moderate)
co
609 (Good)
672 (Good)
606 (Good)
626 (Good)
1 (Good)
895 (Good)
533 (Good)
622 (Good)
363 (Good)
394 (Good)
421 (Good)
350 (Good)
428 (Good)
492 (Good)
674 (Good)
878 (Good)
994 (Good)
708 (Good)
711 (Good)
518 (Good)
no2
26 (Good)
39 (Good)
34 (Good)
23 (Good)
49 (Moderate)
48 (Moderate)
35 (Good)
47 (Moderate)
30 (Good)
18 (Good)
17 (Good)
15 (Good)
23 (Good)
29 (Good)
37 (Good)
39 (Good)
58 (Moderate)
48 (Moderate)
48 (Moderate)
41 (Moderate)
o3
124 (Unhealthy for Sensitive Groups)
132 (Unhealthy for Sensitive Groups)
105 (Moderate)
92 (Moderate)
75 (Moderate)
63 (Good)
84 (Moderate)
130 (Unhealthy for Sensitive Groups)
157 (Unhealthy)
138 (Unhealthy for Sensitive Groups)
156 (Unhealthy)
145 (Unhealthy for Sensitive Groups)
169 (Unhealthy)
127 (Unhealthy for Sensitive Groups)
129 (Unhealthy for Sensitive Groups)
87 (Moderate)
53 (Good)
53 (Good)
84 (Moderate)
108 (Moderate)
pm10
53 (Unhealthy for Sensitive Groups)
76 (Unhealthy for Sensitive Groups)
65 (Unhealthy for Sensitive Groups)
45 (Moderate)
110 (Very Unhealthy)
94 (Unhealthy)
86 (Unhealthy)
108 (Unhealthy)
56 (Unhealthy for Sensitive Groups)
38 (Moderate)
55 (Unhealthy for Sensitive Groups)
42 (Moderate)
68 (Unhealthy for Sensitive Groups)
63 (Unhealthy for Sensitive Groups)
83 (Unhealthy)
109 (Unhealthy)
138 (Very Unhealthy)
105 (Unhealthy)
125 (Very Unhealthy)
78 (Unhealthy for Sensitive Groups)
so2
7.1 (Good)
10 (Good)
8.2 (Good)
7.8 (Good)
15 (Good)
13 (Good)
11 (Good)
12 (Good)
9.7 (Good)
8.2 (Good)
4.3 (Good)
3.1 (Good)
5.6 (Good)
3.8 (Good)
7.1 (Good)
10 (Good)
15 (Good)
13 (Good)
13 (Good)
13 (Good)
data source »
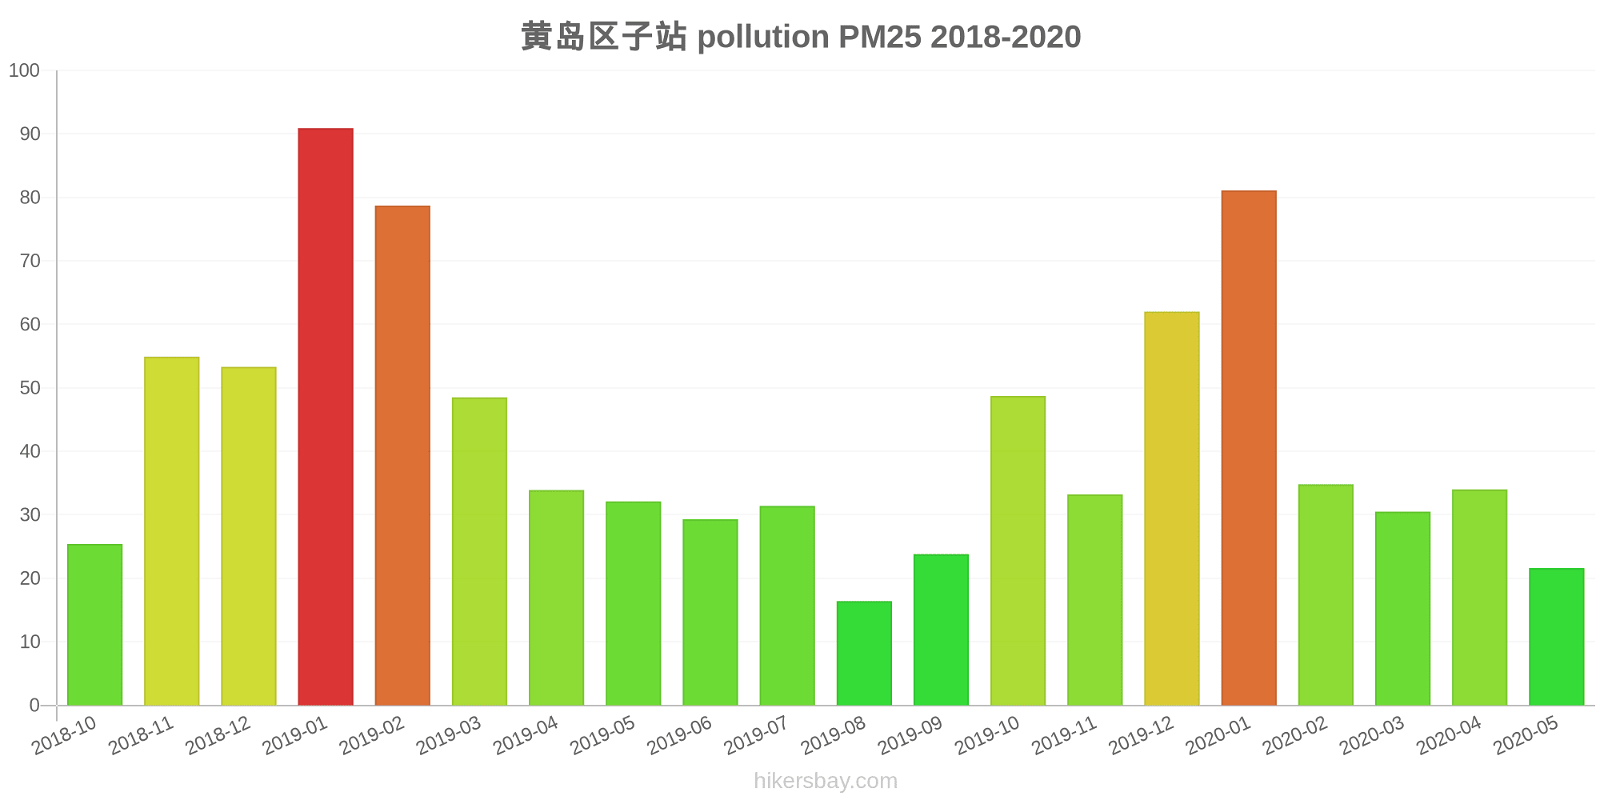
黄岛区子站
Friday, May 27, 2022, 12:00 PM
PM10 53 (Unhealthy for Sensitive Groups)
particulate matter (PM10) suspended dust
O3 0.02 (Good)
ozone (O3)
PM2,5 6.6 (Good)
particulate matter (PM2.5) dust
SO2 18 (Good)
sulfur dioxide (SO2)
NO2 3 (Good)
nitrogen dioxide (NO2)
CO 1.3 (Good)
carbon monoxide (CO)
黄岛区子站
index
2022-05-27
pm10
51
o3
0.02
pm25
21
so2
9.6
no2
0.38
co
0.64
黄岛区子站
2018-10 2020-05
index
2020-05
2020-04
2020-03
2020-02
2020-01
2019-12
2019-11
2019-10
2019-09
2019-08
2019-07
2019-06
2019-05
2019-04
2019-03
2019-02
2019-01
2018-12
2018-11
2018-10
pm25
22
34
31
35
81
62
33
49
24
16
31
29
32
34
49
79
91
53
55
25
co
609
672
606
626
1
895
533
622
363
394
421
350
428
492
674
878
994
708
711
518
no2
26
39
34
23
49
48
35
47
30
18
17
15
23
29
37
39
58
48
48
41
o3
124
132
105
92
75
63
84
130
157
138
156
145
169
127
129
87
53
53
84
108
pm10
53
76
65
45
110
94
86
108
56
38
55
42
68
63
83
109
138
105
125
78
so2
7.1
10
8.2
7.8
15
13
11
12
9.7
8.2
4.3
3.1
5.6
3.8
7.1
10
15
13
13
13
* Pollution data source:
https://openaq.org
(ChinaAQIData)
The data is licensed under CC-By 4.0
PM10 53 (Unhealthy for Sensitive Groups)
O3 0 (Good)
PM2,5 7 (Good)
SO2 18 (Good)
NO2 3 (Good)
CO 1 (Good)
Data on air pollution from recent days in Wanglinzhuang
| index | 2022-05-27 |
|---|---|
| pm10 | 51 Unhealthy for Sensitive Groups |
| o3 | 0 Good |
| pm25 | 21 Moderate |
| so2 | 10 Good |
| no2 | 0 Good |
| co | 1 Good |

| index | 2020-05 | 2020-04 | 2020-03 | 2020-02 | 2020-01 | 2019-12 | 2019-11 | 2019-10 | 2019-09 | 2019-08 | 2019-07 | 2019-06 | 2019-05 | 2019-04 | 2019-03 | 2019-02 | 2019-01 | 2018-12 | 2018-11 | 2018-10 |
|---|---|---|---|---|---|---|---|---|---|---|---|---|---|---|---|---|---|---|---|---|
| pm25 | 22 (Moderate) | 34 (Moderate) | 31 (Moderate) | 35 (Moderate) | 81 (Very Unhealthy) | 62 (Unhealthy) | 33 (Moderate) | 49 (Unhealthy for Sensitive Groups) | 24 (Moderate) | 16 (Moderate) | 31 (Moderate) | 29 (Moderate) | 32 (Moderate) | 34 (Moderate) | 49 (Unhealthy for Sensitive Groups) | 79 (Very Unhealthy) | 91 (Very Unhealthy) | 53 (Unhealthy for Sensitive Groups) | 55 (Unhealthy for Sensitive Groups) | 25 (Moderate) |
| co | 609 (Good) | 672 (Good) | 606 (Good) | 626 (Good) | 1 (Good) | 895 (Good) | 533 (Good) | 622 (Good) | 363 (Good) | 394 (Good) | 421 (Good) | 350 (Good) | 428 (Good) | 492 (Good) | 674 (Good) | 878 (Good) | 994 (Good) | 708 (Good) | 711 (Good) | 518 (Good) |
| no2 | 26 (Good) | 39 (Good) | 34 (Good) | 23 (Good) | 49 (Moderate) | 48 (Moderate) | 35 (Good) | 47 (Moderate) | 30 (Good) | 18 (Good) | 17 (Good) | 15 (Good) | 23 (Good) | 29 (Good) | 37 (Good) | 39 (Good) | 58 (Moderate) | 48 (Moderate) | 48 (Moderate) | 41 (Moderate) |
| o3 | 124 (Unhealthy for Sensitive Groups) | 132 (Unhealthy for Sensitive Groups) | 105 (Moderate) | 92 (Moderate) | 75 (Moderate) | 63 (Good) | 84 (Moderate) | 130 (Unhealthy for Sensitive Groups) | 157 (Unhealthy) | 138 (Unhealthy for Sensitive Groups) | 156 (Unhealthy) | 145 (Unhealthy for Sensitive Groups) | 169 (Unhealthy) | 127 (Unhealthy for Sensitive Groups) | 129 (Unhealthy for Sensitive Groups) | 87 (Moderate) | 53 (Good) | 53 (Good) | 84 (Moderate) | 108 (Moderate) |
| pm10 | 53 (Unhealthy for Sensitive Groups) | 76 (Unhealthy for Sensitive Groups) | 65 (Unhealthy for Sensitive Groups) | 45 (Moderate) | 110 (Very Unhealthy) | 94 (Unhealthy) | 86 (Unhealthy) | 108 (Unhealthy) | 56 (Unhealthy for Sensitive Groups) | 38 (Moderate) | 55 (Unhealthy for Sensitive Groups) | 42 (Moderate) | 68 (Unhealthy for Sensitive Groups) | 63 (Unhealthy for Sensitive Groups) | 83 (Unhealthy) | 109 (Unhealthy) | 138 (Very Unhealthy) | 105 (Unhealthy) | 125 (Very Unhealthy) | 78 (Unhealthy for Sensitive Groups) |
| so2 | 7.1 (Good) | 10 (Good) | 8.2 (Good) | 7.8 (Good) | 15 (Good) | 13 (Good) | 11 (Good) | 12 (Good) | 9.7 (Good) | 8.2 (Good) | 4.3 (Good) | 3.1 (Good) | 5.6 (Good) | 3.8 (Good) | 7.1 (Good) | 10 (Good) | 15 (Good) | 13 (Good) | 13 (Good) | 13 (Good) |
PM10 53 (Unhealthy for Sensitive Groups)
particulate matter (PM10) suspended dustO3 0.02 (Good)
ozone (O3)PM2,5 6.6 (Good)
particulate matter (PM2.5) dustSO2 18 (Good)
sulfur dioxide (SO2)NO2 3 (Good)
nitrogen dioxide (NO2)CO 1.3 (Good)
carbon monoxide (CO)黄岛区子站
| index | 2022-05-27 |
|---|---|
| pm10 | 51 |
| o3 | 0.02 |
| pm25 | 21 |
| so2 | 9.6 |
| no2 | 0.38 |
| co | 0.64 |
黄岛区子站

| index | 2020-05 | 2020-04 | 2020-03 | 2020-02 | 2020-01 | 2019-12 | 2019-11 | 2019-10 | 2019-09 | 2019-08 | 2019-07 | 2019-06 | 2019-05 | 2019-04 | 2019-03 | 2019-02 | 2019-01 | 2018-12 | 2018-11 | 2018-10 |
|---|---|---|---|---|---|---|---|---|---|---|---|---|---|---|---|---|---|---|---|---|
| pm25 | 22 | 34 | 31 | 35 | 81 | 62 | 33 | 49 | 24 | 16 | 31 | 29 | 32 | 34 | 49 | 79 | 91 | 53 | 55 | 25 |
| co | 609 | 672 | 606 | 626 | 1 | 895 | 533 | 622 | 363 | 394 | 421 | 350 | 428 | 492 | 674 | 878 | 994 | 708 | 711 | 518 |
| no2 | 26 | 39 | 34 | 23 | 49 | 48 | 35 | 47 | 30 | 18 | 17 | 15 | 23 | 29 | 37 | 39 | 58 | 48 | 48 | 41 |
| o3 | 124 | 132 | 105 | 92 | 75 | 63 | 84 | 130 | 157 | 138 | 156 | 145 | 169 | 127 | 129 | 87 | 53 | 53 | 84 | 108 |
| pm10 | 53 | 76 | 65 | 45 | 110 | 94 | 86 | 108 | 56 | 38 | 55 | 42 | 68 | 63 | 83 | 109 | 138 | 105 | 125 | 78 |
| so2 | 7.1 | 10 | 8.2 | 7.8 | 15 | 13 | 11 | 12 | 9.7 | 8.2 | 4.3 | 3.1 | 5.6 | 3.8 | 7.1 | 10 | 15 | 13 | 13 | 13 |