Air Pollution in Shizhao: Real-time Air Quality Index and smog alert.
Pollution and air quality forecast for Shizhao. Today is Sunday, June 21, 2026. The following air pollution values have been recorded for Shizhao:- particulate matter (PM2.5) dust - 61 (Unhealthy)
- nitrogen dioxide (NO2) - 22 (Good)
- particulate matter (PM10) suspended dust - 69 (Unhealthy for Sensitive Groups)
- carbon monoxide (CO) - 219 (Good)
- ozone (O3) - 0 (Good)
- sulfur dioxide (SO2) - 8 (Good)

What is the air quality in Shizhao today? Is the air polluted in Shizhao?. Is there smog?
What is the current level of PM2.5 in Shizhao? (particulate matter (PM2.5) dust)
Today's PM2.5 level is:
61 (Unhealthy)
For comparison, the highest level of PM2.5 in Shizhao in the last 7 days was: 28 (Friday, May 27, 2022) and the lowest: 28 (Friday, May 27, 2022).
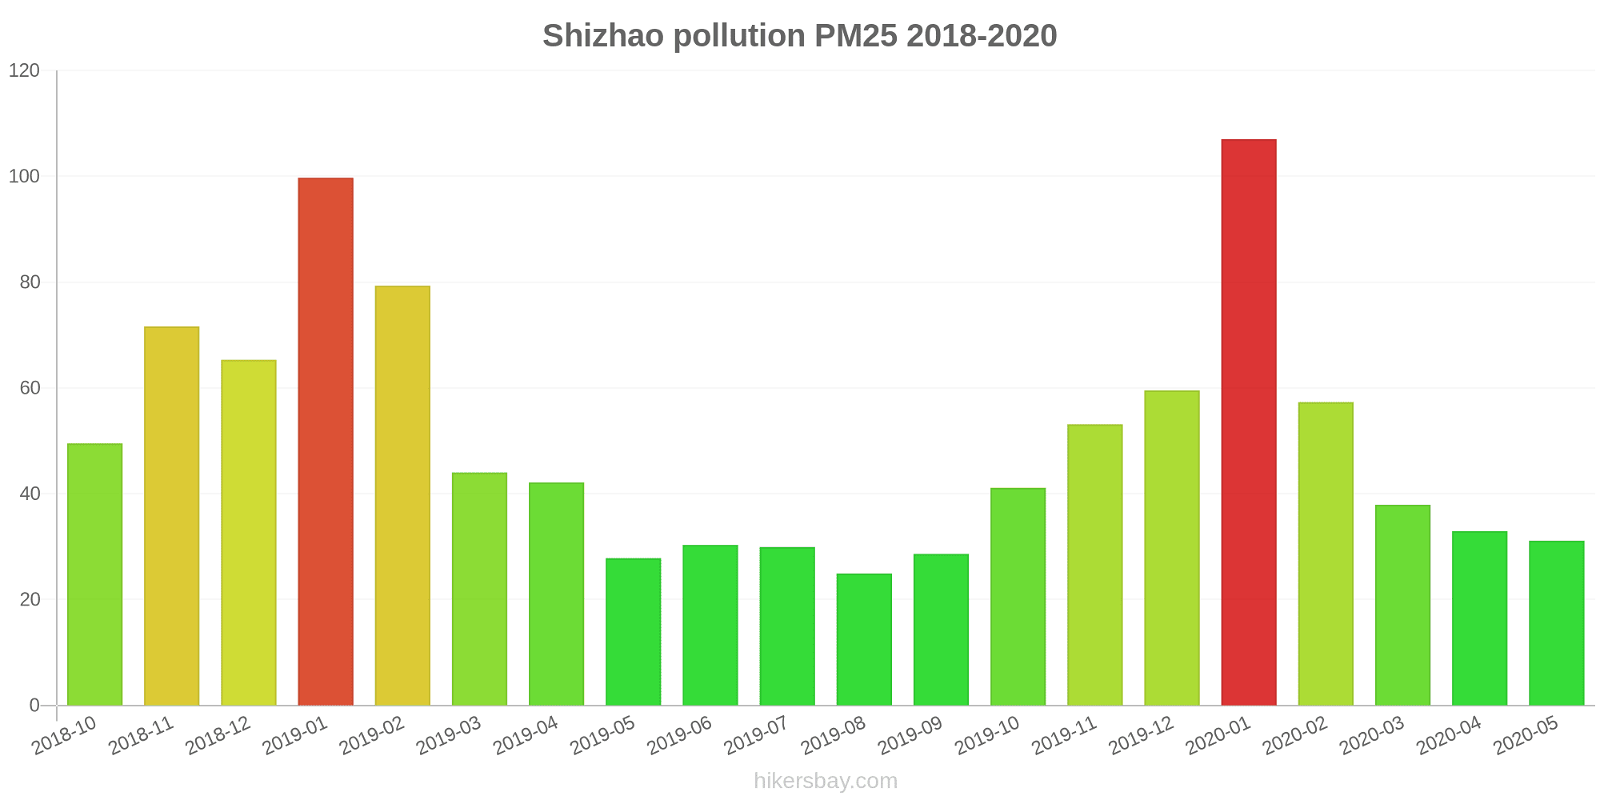
The highest PM2.5 values were recorded: 107 (January 2020).
The lowest level of particulate matter PM2.5 pollution occurs in month: August (25).
How high is the level of NO2? (nitrogen dioxide (NO2))
22 (Good)
What is the level of PM10 today in Shizhao? (particulate matter (PM10) suspended dust)
The current level of particulate matter PM10 in Shizhao is:
69 (Unhealthy for Sensitive Groups)
The highest PM10 values usually occur in month: 168 (January 2019).
The lowest value of particulate matter PM10 pollution in Shizhao is usually recorded in: August (47).
How high is the CO level? (carbon monoxide (CO))
219 (Good)
How is the O3 level today in Shizhao? (ozone (O3))
0 (Good)
What is the level of SO2 pollution? (sulfur dioxide (SO2))
8 (Good)
Current data Friday, May 27, 2022, 3:00 PM
PM2,5 61 (Unhealthy)
NO2 22 (Good)
PM10 69 (Unhealthy for Sensitive Groups)
CO 219 (Good)
O3 0 (Good)
SO2 8 (Good)
Data on air pollution from recent days in Shizhao
index
2022-05-27
pm25
28
Moderate
no2
22
Good
pm10
35
Moderate
co
579
Good
o3
22
Good
so2
5
Good
data source »
Air pollution in Shizhao from October 2018 to May 2020
index
2020-05
2020-04
2020-03
2020-02
2020-01
2019-12
2019-11
2019-10
2019-09
2019-08
2019-07
2019-06
2019-05
2019-04
2019-03
2019-02
2019-01
2018-12
2018-11
2018-10
pm25
31 (Moderate)
33 (Moderate)
38 (Unhealthy for Sensitive Groups)
57 (Unhealthy)
107 (Very Unhealthy)
60 (Unhealthy)
53 (Unhealthy for Sensitive Groups)
41 (Unhealthy for Sensitive Groups)
29 (Moderate)
25 (Moderate)
30 (Moderate)
30 (Moderate)
28 (Moderate)
42 (Unhealthy for Sensitive Groups)
44 (Unhealthy for Sensitive Groups)
79 (Very Unhealthy)
100 (Very Unhealthy)
65 (Unhealthy)
72 (Unhealthy)
50 (Unhealthy for Sensitive Groups)
co
755 (Good)
590 (Good)
770 (Good)
945 (Good)
1 (Good)
1 (Good)
980 (Good)
718 (Good)
622 (Good)
643 (Good)
640 (Good)
720 (Good)
673 (Good)
798 (Good)
1 (Good)
1 (Good)
1 (Good)
1 (Good)
1 (Good)
920 (Good)
no2
26 (Good)
36 (Good)
34 (Good)
30 (Good)
50 (Moderate)
53 (Moderate)
50 (Moderate)
45 (Moderate)
38 (Good)
29 (Good)
26 (Good)
29 (Good)
37 (Good)
39 (Good)
44 (Moderate)
45 (Moderate)
73 (Moderate)
56 (Moderate)
62 (Moderate)
48 (Moderate)
o3
153 (Unhealthy)
128 (Unhealthy for Sensitive Groups)
108 (Moderate)
93 (Moderate)
73 (Moderate)
57 (Good)
63 (Good)
107 (Moderate)
147 (Unhealthy for Sensitive Groups)
157 (Unhealthy)
199 (Very Unhealthy)
211 (Very Unhealthy)
159 (Unhealthy)
127 (Unhealthy for Sensitive Groups)
119 (Moderate)
93 (Moderate)
54 (Good)
47 (Good)
73 (Moderate)
96 (Moderate)
pm10
66 (Unhealthy for Sensitive Groups)
72 (Unhealthy for Sensitive Groups)
75 (Unhealthy for Sensitive Groups)
84 (Unhealthy)
146 (Very Unhealthy)
101 (Unhealthy)
104 (Unhealthy)
88 (Unhealthy)
57 (Unhealthy for Sensitive Groups)
47 (Moderate)
56 (Unhealthy for Sensitive Groups)
62 (Unhealthy for Sensitive Groups)
81 (Unhealthy)
95 (Unhealthy)
100 (Unhealthy)
127 (Very Unhealthy)
168 (Very bad Hazardous)
142 (Very Unhealthy)
146 (Very Unhealthy)
104 (Unhealthy)
so2
13 (Good)
12 (Good)
19 (Good)
26 (Good)
41 (Good)
40 (Good)
28 (Good)
17 (Good)
12 (Good)
8.3 (Good)
9.4 (Good)
13 (Good)
17 (Good)
18 (Good)
25 (Good)
44 (Good)
69 (Moderate)
55 (Moderate)
42 (Good)
21 (Good)
data source »
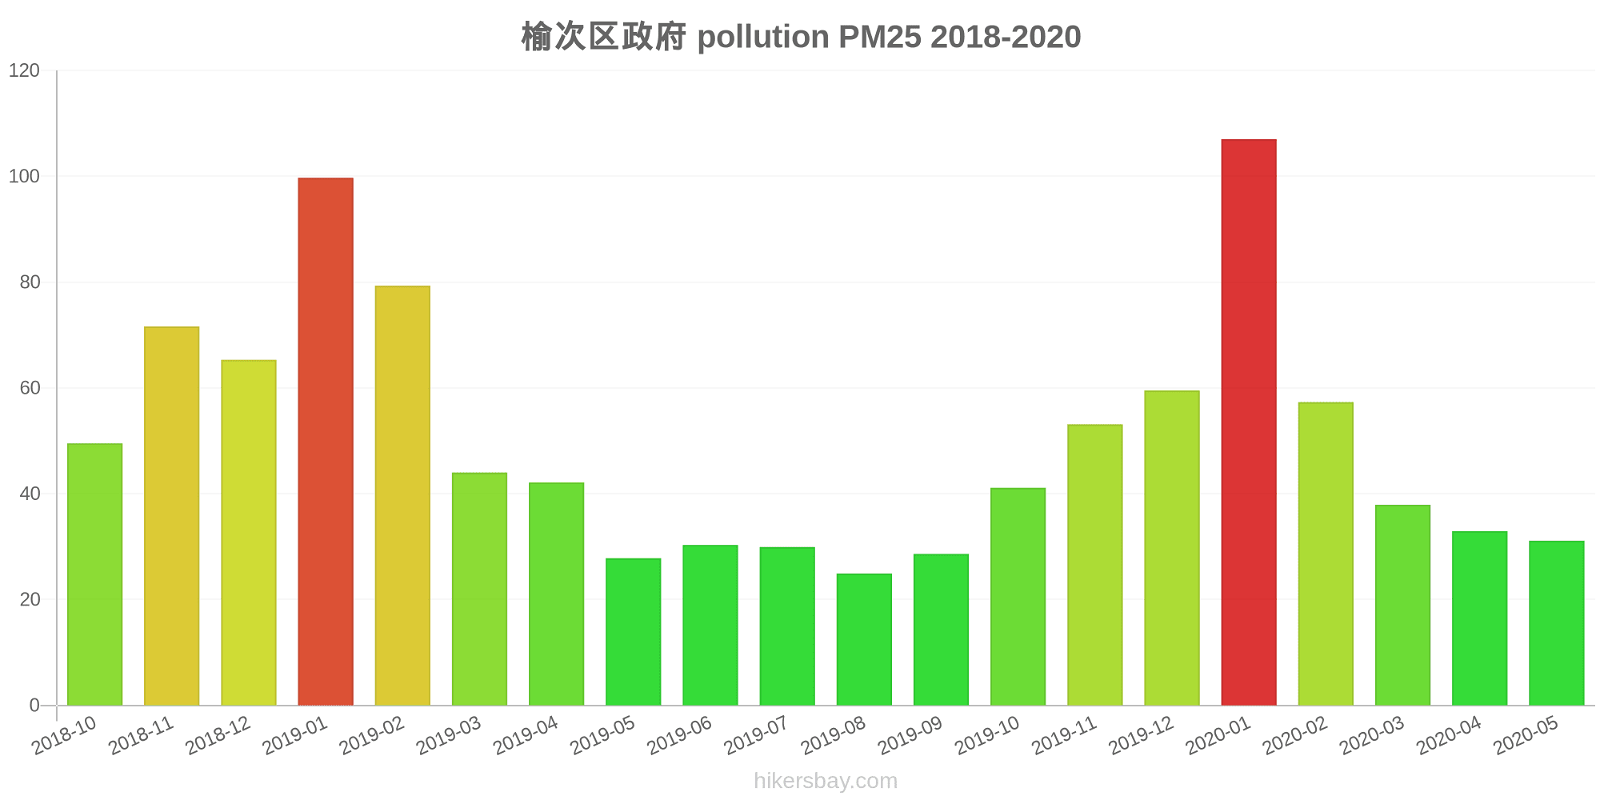
榆次区政府
Friday, May 27, 2022, 3:00 PM
PM2,5 61 (Unhealthy)
particulate matter (PM2.5) dust
NO2 22 (Good)
nitrogen dioxide (NO2)
PM10 69 (Unhealthy for Sensitive Groups)
particulate matter (PM10) suspended dust
CO 219 (Good)
carbon monoxide (CO)
O3 0.05 (Good)
ozone (O3)
SO2 7.7 (Good)
sulfur dioxide (SO2)
榆次区政府
index
2022-05-27
pm25
28
no2
22
pm10
35
co
579
o3
22
so2
4.6
榆次区政府
2018-10 2020-05
index
2020-05
2020-04
2020-03
2020-02
2020-01
2019-12
2019-11
2019-10
2019-09
2019-08
2019-07
2019-06
2019-05
2019-04
2019-03
2019-02
2019-01
2018-12
2018-11
2018-10
pm25
31
33
38
57
107
60
53
41
29
25
30
30
28
42
44
79
100
65
72
50
co
755
590
770
945
1
1
980
718
622
643
640
720
673
798
1
1
1
1
1
920
no2
26
36
34
30
50
53
50
45
38
29
26
29
37
39
44
45
73
56
62
48
o3
153
128
108
93
73
57
63
107
147
157
199
211
159
127
119
93
54
47
73
96
pm10
66
72
75
84
146
101
104
88
57
47
56
62
81
95
100
127
168
142
146
104
so2
13
12
19
26
41
40
28
17
12
8.3
9.4
13
17
18
25
44
69
55
42
21
* Pollution data source:
https://openaq.org
(ChinaAQIData)
The data is licensed under CC-By 4.0
PM2,5 61 (Unhealthy)
NO2 22 (Good)
PM10 69 (Unhealthy for Sensitive Groups)
CO 219 (Good)
O3 0 (Good)
SO2 8 (Good)
Data on air pollution from recent days in Shizhao
| index | 2022-05-27 |
|---|---|
| pm25 | 28 Moderate |
| no2 | 22 Good |
| pm10 | 35 Moderate |
| co | 579 Good |
| o3 | 22 Good |
| so2 | 5 Good |

| index | 2020-05 | 2020-04 | 2020-03 | 2020-02 | 2020-01 | 2019-12 | 2019-11 | 2019-10 | 2019-09 | 2019-08 | 2019-07 | 2019-06 | 2019-05 | 2019-04 | 2019-03 | 2019-02 | 2019-01 | 2018-12 | 2018-11 | 2018-10 |
|---|---|---|---|---|---|---|---|---|---|---|---|---|---|---|---|---|---|---|---|---|
| pm25 | 31 (Moderate) | 33 (Moderate) | 38 (Unhealthy for Sensitive Groups) | 57 (Unhealthy) | 107 (Very Unhealthy) | 60 (Unhealthy) | 53 (Unhealthy for Sensitive Groups) | 41 (Unhealthy for Sensitive Groups) | 29 (Moderate) | 25 (Moderate) | 30 (Moderate) | 30 (Moderate) | 28 (Moderate) | 42 (Unhealthy for Sensitive Groups) | 44 (Unhealthy for Sensitive Groups) | 79 (Very Unhealthy) | 100 (Very Unhealthy) | 65 (Unhealthy) | 72 (Unhealthy) | 50 (Unhealthy for Sensitive Groups) |
| co | 755 (Good) | 590 (Good) | 770 (Good) | 945 (Good) | 1 (Good) | 1 (Good) | 980 (Good) | 718 (Good) | 622 (Good) | 643 (Good) | 640 (Good) | 720 (Good) | 673 (Good) | 798 (Good) | 1 (Good) | 1 (Good) | 1 (Good) | 1 (Good) | 1 (Good) | 920 (Good) |
| no2 | 26 (Good) | 36 (Good) | 34 (Good) | 30 (Good) | 50 (Moderate) | 53 (Moderate) | 50 (Moderate) | 45 (Moderate) | 38 (Good) | 29 (Good) | 26 (Good) | 29 (Good) | 37 (Good) | 39 (Good) | 44 (Moderate) | 45 (Moderate) | 73 (Moderate) | 56 (Moderate) | 62 (Moderate) | 48 (Moderate) |
| o3 | 153 (Unhealthy) | 128 (Unhealthy for Sensitive Groups) | 108 (Moderate) | 93 (Moderate) | 73 (Moderate) | 57 (Good) | 63 (Good) | 107 (Moderate) | 147 (Unhealthy for Sensitive Groups) | 157 (Unhealthy) | 199 (Very Unhealthy) | 211 (Very Unhealthy) | 159 (Unhealthy) | 127 (Unhealthy for Sensitive Groups) | 119 (Moderate) | 93 (Moderate) | 54 (Good) | 47 (Good) | 73 (Moderate) | 96 (Moderate) |
| pm10 | 66 (Unhealthy for Sensitive Groups) | 72 (Unhealthy for Sensitive Groups) | 75 (Unhealthy for Sensitive Groups) | 84 (Unhealthy) | 146 (Very Unhealthy) | 101 (Unhealthy) | 104 (Unhealthy) | 88 (Unhealthy) | 57 (Unhealthy for Sensitive Groups) | 47 (Moderate) | 56 (Unhealthy for Sensitive Groups) | 62 (Unhealthy for Sensitive Groups) | 81 (Unhealthy) | 95 (Unhealthy) | 100 (Unhealthy) | 127 (Very Unhealthy) | 168 (Very bad Hazardous) | 142 (Very Unhealthy) | 146 (Very Unhealthy) | 104 (Unhealthy) |
| so2 | 13 (Good) | 12 (Good) | 19 (Good) | 26 (Good) | 41 (Good) | 40 (Good) | 28 (Good) | 17 (Good) | 12 (Good) | 8.3 (Good) | 9.4 (Good) | 13 (Good) | 17 (Good) | 18 (Good) | 25 (Good) | 44 (Good) | 69 (Moderate) | 55 (Moderate) | 42 (Good) | 21 (Good) |
PM2,5 61 (Unhealthy)
particulate matter (PM2.5) dustNO2 22 (Good)
nitrogen dioxide (NO2)PM10 69 (Unhealthy for Sensitive Groups)
particulate matter (PM10) suspended dustCO 219 (Good)
carbon monoxide (CO)O3 0.05 (Good)
ozone (O3)SO2 7.7 (Good)
sulfur dioxide (SO2)榆次区政府
| index | 2022-05-27 |
|---|---|
| pm25 | 28 |
| no2 | 22 |
| pm10 | 35 |
| co | 579 |
| o3 | 22 |
| so2 | 4.6 |
榆次区政府

| index | 2020-05 | 2020-04 | 2020-03 | 2020-02 | 2020-01 | 2019-12 | 2019-11 | 2019-10 | 2019-09 | 2019-08 | 2019-07 | 2019-06 | 2019-05 | 2019-04 | 2019-03 | 2019-02 | 2019-01 | 2018-12 | 2018-11 | 2018-10 |
|---|---|---|---|---|---|---|---|---|---|---|---|---|---|---|---|---|---|---|---|---|
| pm25 | 31 | 33 | 38 | 57 | 107 | 60 | 53 | 41 | 29 | 25 | 30 | 30 | 28 | 42 | 44 | 79 | 100 | 65 | 72 | 50 |
| co | 755 | 590 | 770 | 945 | 1 | 1 | 980 | 718 | 622 | 643 | 640 | 720 | 673 | 798 | 1 | 1 | 1 | 1 | 1 | 920 |
| no2 | 26 | 36 | 34 | 30 | 50 | 53 | 50 | 45 | 38 | 29 | 26 | 29 | 37 | 39 | 44 | 45 | 73 | 56 | 62 | 48 |
| o3 | 153 | 128 | 108 | 93 | 73 | 57 | 63 | 107 | 147 | 157 | 199 | 211 | 159 | 127 | 119 | 93 | 54 | 47 | 73 | 96 |
| pm10 | 66 | 72 | 75 | 84 | 146 | 101 | 104 | 88 | 57 | 47 | 56 | 62 | 81 | 95 | 100 | 127 | 168 | 142 | 146 | 104 |
| so2 | 13 | 12 | 19 | 26 | 41 | 40 | 28 | 17 | 12 | 8.3 | 9.4 | 13 | 17 | 18 | 25 | 44 | 69 | 55 | 42 | 21 |