Air Pollution in Zhongyuanlu: Real-time Air Quality Index and smog alert.
Pollution and air quality forecast for Zhongyuanlu. Today is Tuesday, June 2, 2026. The following air pollution values have been recorded for Zhongyuanlu:- particulate matter (PM10) suspended dust - 179 (Very bad Hazardous)
- particulate matter (PM2.5) dust - 35 (Unhealthy for Sensitive Groups)
- ozone (O3) - 0 (Good)
- nitrogen dioxide (NO2) - 0 (Good)
- sulfur dioxide (SO2) - 0 (Good)

What is the air quality in Zhongyuanlu today? Is the air polluted in Zhongyuanlu?. Is there smog?
What is the level of PM10 today in Zhongyuanlu? (particulate matter (PM10) suspended dust)
The current level of particulate matter PM10 in Zhongyuanlu is:
179 (Very bad Hazardous)
The highest PM10 values usually occur in month: 176 (February 2019).
The lowest value of particulate matter PM10 pollution in Zhongyuanlu is usually recorded in: August (54).
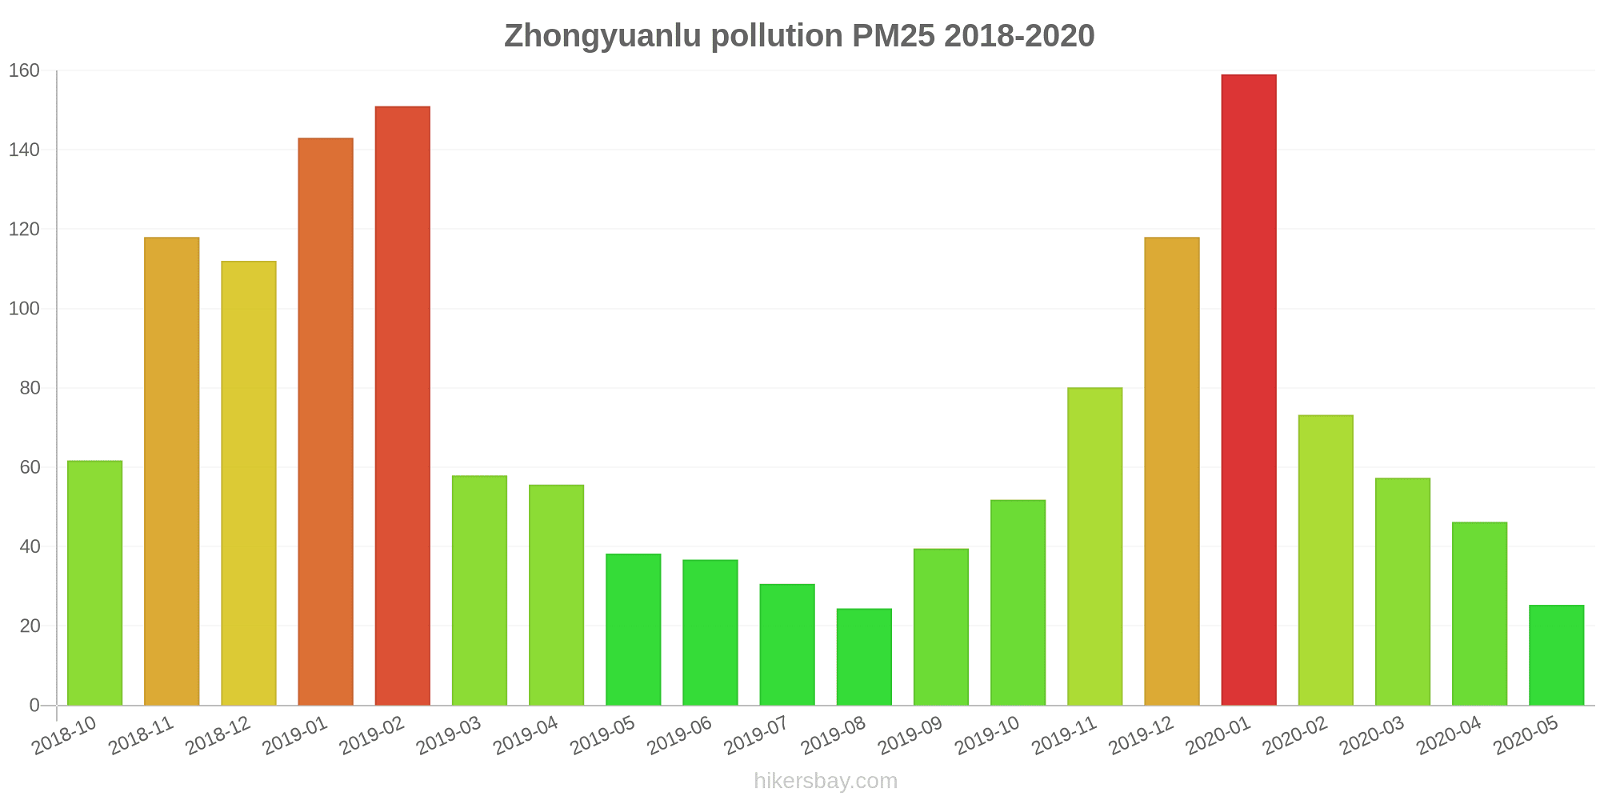
What is the current level of PM2.5 in Zhongyuanlu? (particulate matter (PM2.5) dust)
Today's PM2.5 level is:
35 (Unhealthy for Sensitive Groups)
For comparison, the highest level of PM2.5 in Zhongyuanlu in the last 7 days was: 56 (Friday, May 27, 2022) and the lowest: 56 (Friday, May 27, 2022).
The highest PM2.5 values were recorded: 159 (January 2020).
The lowest level of particulate matter PM2.5 pollution occurs in month: August (24).
How is the O3 level today in Zhongyuanlu? (ozone (O3))
0 (Good)
How high is the level of NO2? (nitrogen dioxide (NO2))
0 (Good)
What is the level of SO2 pollution? (sulfur dioxide (SO2))
0 (Good)
Current data Friday, May 27, 2022, 12:00 PM
PM10 179 (Very bad Hazardous)
PM2,5 35 (Unhealthy for Sensitive Groups)
O3 0 (Good)
NO2 0 (Good)
SO2 0 (Good)
Data on air pollution from recent days in Zhongyuanlu
index
2022-05-27
pm10
56
Unhealthy for Sensitive Groups
pm25
56
Unhealthy
o3
0
Good
no2
0
Good
so2
0
Good
data source »
Air pollution in Zhongyuanlu from October 2018 to May 2020
index
2020-05
2020-04
2020-03
2020-02
2020-01
2019-12
2019-11
2019-10
2019-09
2019-08
2019-07
2019-06
2019-05
2019-04
2019-03
2019-02
2019-01
2018-12
2018-11
2018-10
pm25
25 (Moderate)
46 (Unhealthy for Sensitive Groups)
57 (Unhealthy)
73 (Unhealthy)
159 (Very bad Hazardous)
118 (Very bad Hazardous)
80 (Very Unhealthy)
52 (Unhealthy for Sensitive Groups)
40 (Unhealthy for Sensitive Groups)
24 (Moderate)
31 (Moderate)
37 (Unhealthy for Sensitive Groups)
38 (Unhealthy for Sensitive Groups)
56 (Unhealthy)
58 (Unhealthy)
151 (Very bad Hazardous)
143 (Very bad Hazardous)
112 (Very bad Hazardous)
118 (Very bad Hazardous)
62 (Unhealthy)
co
566 (Good)
582 (Good)
702 (Good)
840 (Good)
1 (Good)
1 (Good)
950 (Good)
873 (Good)
832 (Good)
707 (Good)
714 (Good)
713 (Good)
714 (Good)
799 (Good)
834 (Good)
1 (Good)
1 (Good)
1 (Good)
1 (Good)
1 (Good)
no2
20 (Good)
30 (Good)
30 (Good)
15 (Good)
45 (Moderate)
52 (Moderate)
49 (Moderate)
41 (Moderate)
34 (Good)
25 (Good)
20 (Good)
22 (Good)
25 (Good)
28 (Good)
32 (Good)
34 (Good)
57 (Moderate)
56 (Moderate)
51 (Moderate)
52 (Moderate)
o3
135 (Unhealthy for Sensitive Groups)
131 (Unhealthy for Sensitive Groups)
110 (Moderate)
86 (Moderate)
77 (Moderate)
53 (Good)
84 (Moderate)
114 (Moderate)
170 (Unhealthy)
156 (Unhealthy)
192 (Very Unhealthy)
206 (Very Unhealthy)
149 (Unhealthy for Sensitive Groups)
120 (Unhealthy for Sensitive Groups)
118 (Moderate)
92 (Moderate)
64 (Good)
56 (Good)
83 (Moderate)
114 (Moderate)
pm10
80 (Unhealthy for Sensitive Groups)
91 (Unhealthy)
95 (Unhealthy)
79 (Unhealthy for Sensitive Groups)
153 (Very bad Hazardous)
126 (Very Unhealthy)
132 (Very Unhealthy)
106 (Unhealthy)
81 (Unhealthy)
54 (Unhealthy for Sensitive Groups)
63 (Unhealthy for Sensitive Groups)
84 (Unhealthy)
97 (Unhealthy)
102 (Unhealthy)
104 (Unhealthy)
176 (Very bad Hazardous)
167 (Very bad Hazardous)
151 (Very bad Hazardous)
158 (Very bad Hazardous)
100 (Unhealthy)
so2
8 (Good)
12 (Good)
9.4 (Good)
7 (Good)
12 (Good)
13 (Good)
16 (Good)
12 (Good)
13 (Good)
10 (Good)
4.8 (Good)
7.8 (Good)
9.7 (Good)
12 (Good)
13 (Good)
16 (Good)
22 (Good)
25 (Good)
18 (Good)
25 (Good)
data source »
油田运输公司
Friday, May 27, 2022, 12:00 PM
PM10 179 (Very bad Hazardous)
particulate matter (PM10) suspended dust
PM2,5 35 (Unhealthy for Sensitive Groups)
particulate matter (PM2.5) dust
O3 0.04 (Good)
ozone (O3)
NO2 0 (Good)
nitrogen dioxide (NO2)
SO2 0 (Good)
sulfur dioxide (SO2)
油田运输公司
index
2022-05-27
pm10
56
pm25
56
o3
0.03
no2
0
so2
0
油田运输公司
2018-10 2020-05

index
2020-05
2020-04
2020-03
2020-02
2020-01
2019-12
2019-11
2019-10
2019-09
2019-08
2019-07
2019-06
2019-05
2019-04
2019-03
2019-02
2019-01
2018-12
2018-11
2018-10
pm25
25
46
57
73
159
118
80
52
40
24
31
37
38
56
58
151
143
112
118
62
co
566
582
702
840
1
1
950
873
832
707
714
713
714
799
834
1
1
1
1
1
no2
20
30
30
15
45
52
49
41
34
25
20
22
25
28
32
34
57
56
51
52
o3
135
131
110
86
77
53
84
114
170
156
192
206
149
120
118
92
64
56
83
114
pm10
80
91
95
79
153
126
132
106
81
54
63
84
97
102
104
176
167
151
158
100
so2
8
12
9.4
7
12
13
16
12
13
10
4.8
7.8
9.7
12
13
16
22
25
18
25
* Pollution data source:
https://openaq.org
(ChinaAQIData)
The data is licensed under CC-By 4.0
PM10 179 (Very bad Hazardous)
PM2,5 35 (Unhealthy for Sensitive Groups)
O3 0 (Good)
NO2 0 (Good)
SO2 0 (Good)
Data on air pollution from recent days in Zhongyuanlu
| index | 2022-05-27 |
|---|---|
| pm10 | 56 Unhealthy for Sensitive Groups |
| pm25 | 56 Unhealthy |
| o3 | 0 Good |
| no2 | 0 Good |
| so2 | 0 Good |

| index | 2020-05 | 2020-04 | 2020-03 | 2020-02 | 2020-01 | 2019-12 | 2019-11 | 2019-10 | 2019-09 | 2019-08 | 2019-07 | 2019-06 | 2019-05 | 2019-04 | 2019-03 | 2019-02 | 2019-01 | 2018-12 | 2018-11 | 2018-10 |
|---|---|---|---|---|---|---|---|---|---|---|---|---|---|---|---|---|---|---|---|---|
| pm25 | 25 (Moderate) | 46 (Unhealthy for Sensitive Groups) | 57 (Unhealthy) | 73 (Unhealthy) | 159 (Very bad Hazardous) | 118 (Very bad Hazardous) | 80 (Very Unhealthy) | 52 (Unhealthy for Sensitive Groups) | 40 (Unhealthy for Sensitive Groups) | 24 (Moderate) | 31 (Moderate) | 37 (Unhealthy for Sensitive Groups) | 38 (Unhealthy for Sensitive Groups) | 56 (Unhealthy) | 58 (Unhealthy) | 151 (Very bad Hazardous) | 143 (Very bad Hazardous) | 112 (Very bad Hazardous) | 118 (Very bad Hazardous) | 62 (Unhealthy) |
| co | 566 (Good) | 582 (Good) | 702 (Good) | 840 (Good) | 1 (Good) | 1 (Good) | 950 (Good) | 873 (Good) | 832 (Good) | 707 (Good) | 714 (Good) | 713 (Good) | 714 (Good) | 799 (Good) | 834 (Good) | 1 (Good) | 1 (Good) | 1 (Good) | 1 (Good) | 1 (Good) |
| no2 | 20 (Good) | 30 (Good) | 30 (Good) | 15 (Good) | 45 (Moderate) | 52 (Moderate) | 49 (Moderate) | 41 (Moderate) | 34 (Good) | 25 (Good) | 20 (Good) | 22 (Good) | 25 (Good) | 28 (Good) | 32 (Good) | 34 (Good) | 57 (Moderate) | 56 (Moderate) | 51 (Moderate) | 52 (Moderate) |
| o3 | 135 (Unhealthy for Sensitive Groups) | 131 (Unhealthy for Sensitive Groups) | 110 (Moderate) | 86 (Moderate) | 77 (Moderate) | 53 (Good) | 84 (Moderate) | 114 (Moderate) | 170 (Unhealthy) | 156 (Unhealthy) | 192 (Very Unhealthy) | 206 (Very Unhealthy) | 149 (Unhealthy for Sensitive Groups) | 120 (Unhealthy for Sensitive Groups) | 118 (Moderate) | 92 (Moderate) | 64 (Good) | 56 (Good) | 83 (Moderate) | 114 (Moderate) |
| pm10 | 80 (Unhealthy for Sensitive Groups) | 91 (Unhealthy) | 95 (Unhealthy) | 79 (Unhealthy for Sensitive Groups) | 153 (Very bad Hazardous) | 126 (Very Unhealthy) | 132 (Very Unhealthy) | 106 (Unhealthy) | 81 (Unhealthy) | 54 (Unhealthy for Sensitive Groups) | 63 (Unhealthy for Sensitive Groups) | 84 (Unhealthy) | 97 (Unhealthy) | 102 (Unhealthy) | 104 (Unhealthy) | 176 (Very bad Hazardous) | 167 (Very bad Hazardous) | 151 (Very bad Hazardous) | 158 (Very bad Hazardous) | 100 (Unhealthy) |
| so2 | 8 (Good) | 12 (Good) | 9.4 (Good) | 7 (Good) | 12 (Good) | 13 (Good) | 16 (Good) | 12 (Good) | 13 (Good) | 10 (Good) | 4.8 (Good) | 7.8 (Good) | 9.7 (Good) | 12 (Good) | 13 (Good) | 16 (Good) | 22 (Good) | 25 (Good) | 18 (Good) | 25 (Good) |
PM10 179 (Very bad Hazardous)
particulate matter (PM10) suspended dustPM2,5 35 (Unhealthy for Sensitive Groups)
particulate matter (PM2.5) dustO3 0.04 (Good)
ozone (O3)NO2 0 (Good)
nitrogen dioxide (NO2)SO2 0 (Good)
sulfur dioxide (SO2)油田运输公司
| index | 2022-05-27 |
|---|---|
| pm10 | 56 |
| pm25 | 56 |
| o3 | 0.03 |
| no2 | 0 |
| so2 | 0 |
油田运输公司

| index | 2020-05 | 2020-04 | 2020-03 | 2020-02 | 2020-01 | 2019-12 | 2019-11 | 2019-10 | 2019-09 | 2019-08 | 2019-07 | 2019-06 | 2019-05 | 2019-04 | 2019-03 | 2019-02 | 2019-01 | 2018-12 | 2018-11 | 2018-10 |
|---|---|---|---|---|---|---|---|---|---|---|---|---|---|---|---|---|---|---|---|---|
| pm25 | 25 | 46 | 57 | 73 | 159 | 118 | 80 | 52 | 40 | 24 | 31 | 37 | 38 | 56 | 58 | 151 | 143 | 112 | 118 | 62 |
| co | 566 | 582 | 702 | 840 | 1 | 1 | 950 | 873 | 832 | 707 | 714 | 713 | 714 | 799 | 834 | 1 | 1 | 1 | 1 | 1 |
| no2 | 20 | 30 | 30 | 15 | 45 | 52 | 49 | 41 | 34 | 25 | 20 | 22 | 25 | 28 | 32 | 34 | 57 | 56 | 51 | 52 |
| o3 | 135 | 131 | 110 | 86 | 77 | 53 | 84 | 114 | 170 | 156 | 192 | 206 | 149 | 120 | 118 | 92 | 64 | 56 | 83 | 114 |
| pm10 | 80 | 91 | 95 | 79 | 153 | 126 | 132 | 106 | 81 | 54 | 63 | 84 | 97 | 102 | 104 | 176 | 167 | 151 | 158 | 100 |
| so2 | 8 | 12 | 9.4 | 7 | 12 | 13 | 16 | 12 | 13 | 10 | 4.8 | 7.8 | 9.7 | 12 | 13 | 16 | 22 | 25 | 18 | 25 |