Air Pollution in Wangcun: Real-time Air Quality Index and smog alert.
Pollution and air quality forecast for Wangcun. Today is Tuesday, June 2, 2026. The following air pollution values have been recorded for Wangcun:- particulate matter (PM10) suspended dust - 179 (Very bad Hazardous)
- particulate matter (PM2.5) dust - 35 (Unhealthy for Sensitive Groups)
- ozone (O3) - 0 (Good)
- nitrogen dioxide (NO2) - 0 (Good)
- sulfur dioxide (SO2) - 0 (Good)

What is the air quality in Wangcun today? Is the air polluted in Wangcun?. Is there smog?
What is the level of PM10 today in Wangcun? (particulate matter (PM10) suspended dust)
The current level of particulate matter PM10 in Wangcun is:
179 (Very bad Hazardous)
The highest PM10 values usually occur in month: 173 (February 2019).
The lowest value of particulate matter PM10 pollution in Wangcun is usually recorded in: August (56).
What is the current level of PM2.5 in Wangcun? (particulate matter (PM2.5) dust)
Today's PM2.5 level is:
35 (Unhealthy for Sensitive Groups)
For comparison, the highest level of PM2.5 in Wangcun in the last 7 days was: 56 (Friday, May 27, 2022) and the lowest: 56 (Friday, May 27, 2022).
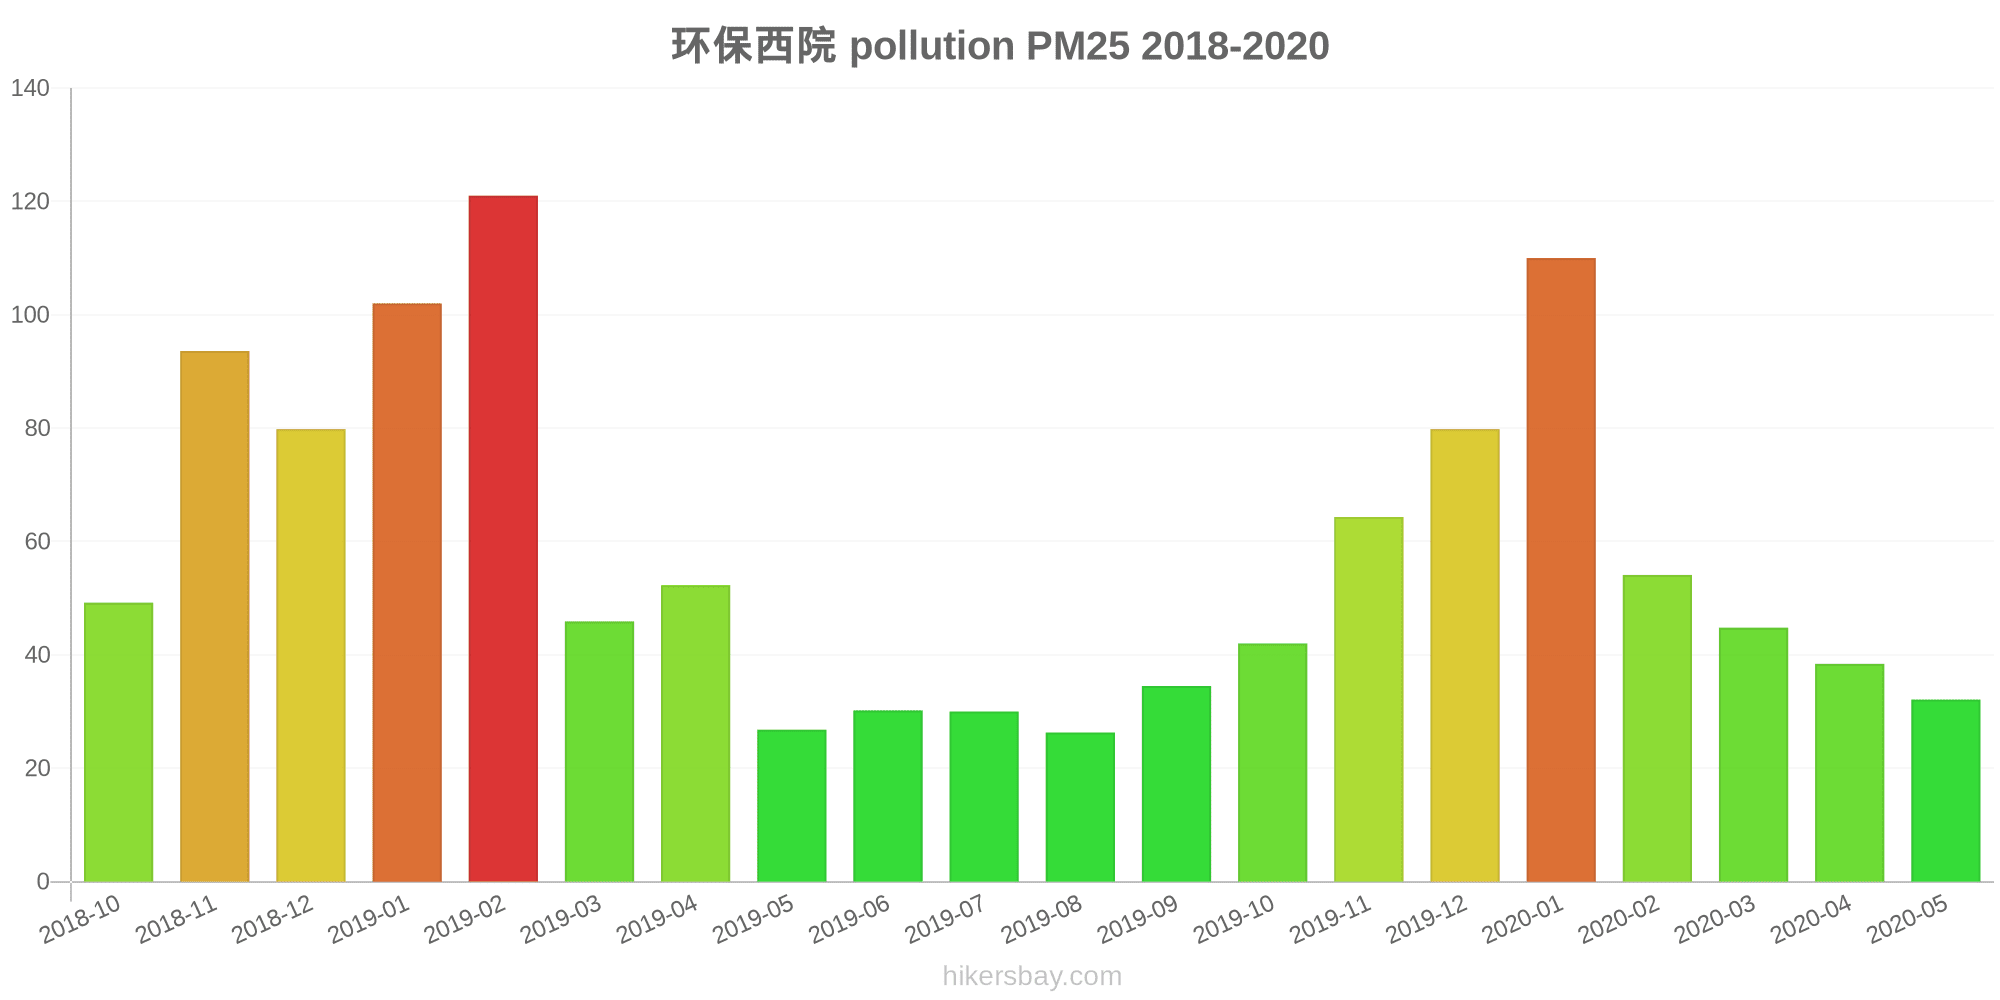
The highest PM2.5 values were recorded: 121 (February 2019).
The lowest level of particulate matter PM2.5 pollution occurs in month: August (26).
How is the O3 level today in Wangcun? (ozone (O3))
0 (Good)
How high is the level of NO2? (nitrogen dioxide (NO2))
0 (Good)
What is the level of SO2 pollution? (sulfur dioxide (SO2))
0 (Good)
Current data Friday, May 27, 2022, 12:00 PM
PM10 179 (Very bad Hazardous)
PM2,5 35 (Unhealthy for Sensitive Groups)
O3 0 (Good)
NO2 0 (Good)
SO2 0 (Good)
Data on air pollution from recent days in Wangcun
index
2022-05-27
pm10
56
Unhealthy for Sensitive Groups
pm25
56
Unhealthy
o3
0
Good
no2
0
Good
so2
0
Good
data source »
Air pollution in Wangcun from October 2018 to May 2020

index
2020-05
2020-04
2020-03
2020-02
2020-01
2019-12
2019-11
2019-10
2019-09
2019-08
2019-07
2019-06
2019-05
2019-04
2019-03
2019-02
2019-01
2018-12
2018-11
2018-10
pm25
32 (Moderate)
38 (Unhealthy for Sensitive Groups)
45 (Unhealthy for Sensitive Groups)
54 (Unhealthy for Sensitive Groups)
110 (Very bad Hazardous)
80 (Very Unhealthy)
64 (Unhealthy)
42 (Unhealthy for Sensitive Groups)
35 (Moderate)
26 (Moderate)
30 (Moderate)
30 (Moderate)
27 (Moderate)
52 (Unhealthy for Sensitive Groups)
46 (Unhealthy for Sensitive Groups)
121 (Very bad Hazardous)
102 (Very Unhealthy)
80 (Very Unhealthy)
94 (Very Unhealthy)
49 (Unhealthy for Sensitive Groups)
co
658 (Good)
618 (Good)
774 (Good)
978 (Good)
1 (Good)
1 (Good)
1 (Good)
840 (Good)
812 (Good)
666 (Good)
832 (Good)
862 (Good)
655 (Good)
849 (Good)
1 (Good)
1 (Good)
1 (Good)
1 (Good)
1 (Good)
950 (Good)
no2
26 (Good)
35 (Good)
35 (Good)
26 (Good)
49 (Moderate)
53 (Moderate)
58 (Moderate)
48 (Moderate)
43 (Moderate)
30 (Good)
26 (Good)
27 (Good)
31 (Good)
40 (Moderate)
38 (Good)
39 (Good)
60 (Moderate)
59 (Moderate)
62 (Moderate)
60 (Moderate)
o3
150 (Unhealthy)
130 (Unhealthy for Sensitive Groups)
106 (Moderate)
90 (Moderate)
64 (Good)
46 (Good)
79 (Moderate)
108 (Moderate)
164 (Unhealthy)
147 (Unhealthy for Sensitive Groups)
160 (Unhealthy)
170 (Unhealthy)
147 (Unhealthy for Sensitive Groups)
128 (Unhealthy for Sensitive Groups)
106 (Moderate)
89 (Moderate)
49 (Good)
45 (Good)
65 (Good)
105 (Moderate)
pm10
70 (Unhealthy for Sensitive Groups)
84 (Unhealthy)
89 (Unhealthy)
78 (Unhealthy for Sensitive Groups)
146 (Very Unhealthy)
120 (Very Unhealthy)
128 (Very Unhealthy)
87 (Unhealthy)
67 (Unhealthy for Sensitive Groups)
56 (Unhealthy for Sensitive Groups)
59 (Unhealthy for Sensitive Groups)
69 (Unhealthy for Sensitive Groups)
80 (Unhealthy)
107 (Unhealthy)
99 (Unhealthy)
173 (Very bad Hazardous)
162 (Very bad Hazardous)
147 (Very Unhealthy)
167 (Very bad Hazardous)
99 (Unhealthy)
so2
15 (Good)
17 (Good)
15 (Good)
13 (Good)
16 (Good)
17 (Good)
17 (Good)
15 (Good)
13 (Good)
11 (Good)
11 (Good)
13 (Good)
14 (Good)
19 (Good)
19 (Good)
18 (Good)
25 (Good)
21 (Good)
15 (Good)
19 (Good)
data source »
Quality of life in Wangcun
Green and Parks in the City
Wangcun
0%
Mongolia: 27%
Bhutan: 82%
Hong Kong: 52%
Myanmar: 33%
particulate matter PM2.5
Wangcun
84 (Very Unhealthy)
Pleasure of spending time in the city
Wangcun
0%
Mongolia: 22%
Bhutan: 61%
Hong Kong: 43%
Myanmar: 24%
particulate matter PM10
Wangcun
140 (Very Unhealthy)
Air Pollution
Wangcun
100%
Mongolia: 87%
Bhutan: 45%
Hong Kong: 67%
Myanmar: 83%
Garbage Disposal
Wangcun
0%
Mongolia: 27%
Bhutan: 47%
Hong Kong: 52%
Myanmar: 12%
Availability and quality of drinking water
Wangcun
0%
Mongolia: 46%
Bhutan: 64%
Hong Kong: 66%
Myanmar: 34%
Cleanliness and tidiness
Wangcun
0%
Mongolia: 29%
Bhutan: 57%
Hong Kong: 54%
Myanmar: 18%
Noise and Light pollution
Wangcun
75%
Mongolia: 48%
Bhutan: 55%
Hong Kong: 66%
Myanmar: 52%
Water Pollution
Wangcun
100%
Mongolia: 68%
Bhutan: 56%
Hong Kong: 53%
Myanmar: 74%
Source: Numbeo
环保西院
Friday, May 27, 2022, 12:00 PM
PM10 179 (Very bad Hazardous)
particulate matter (PM10) suspended dust
PM2,5 35 (Unhealthy for Sensitive Groups)
particulate matter (PM2.5) dust
O3 0.04 (Good)
ozone (O3)
NO2 0 (Good)
nitrogen dioxide (NO2)
SO2 0 (Good)
sulfur dioxide (SO2)
环保西院
index
2022-05-27
pm10
56
pm25
56
o3
0.03
no2
0
so2
0
环保西院
2018-10 2020-05

index
2020-05
2020-04
2020-03
2020-02
2020-01
2019-12
2019-11
2019-10
2019-09
2019-08
2019-07
2019-06
2019-05
2019-04
2019-03
2019-02
2019-01
2018-12
2018-11
2018-10
pm25
32
38
45
54
110
80
64
42
35
26
30
30
27
52
46
121
102
80
94
49
co
658
618
774
978
1
1
1
840
812
666
832
862
655
849
1
1
1
1
1
950
no2
26
35
35
26
49
53
58
48
43
30
26
27
31
40
38
39
60
59
62
60
o3
150
130
106
90
64
46
79
108
164
147
160
170
147
128
106
89
49
45
65
105
pm10
70
84
89
78
146
120
128
87
67
56
59
69
80
107
99
173
162
147
167
99
so2
15
17
15
13
16
17
17
15
13
11
11
13
14
19
19
18
25
21
15
19
* Pollution data source:
https://openaq.org
(ChinaAQIData)
The data is licensed under CC-By 4.0
PM10 179 (Very bad Hazardous)
PM2,5 35 (Unhealthy for Sensitive Groups)
O3 0 (Good)
NO2 0 (Good)
SO2 0 (Good)
Data on air pollution from recent days in Wangcun
| index | 2022-05-27 |
|---|---|
| pm10 | 56 Unhealthy for Sensitive Groups |
| pm25 | 56 Unhealthy |
| o3 | 0 Good |
| no2 | 0 Good |
| so2 | 0 Good |

| index | 2020-05 | 2020-04 | 2020-03 | 2020-02 | 2020-01 | 2019-12 | 2019-11 | 2019-10 | 2019-09 | 2019-08 | 2019-07 | 2019-06 | 2019-05 | 2019-04 | 2019-03 | 2019-02 | 2019-01 | 2018-12 | 2018-11 | 2018-10 |
|---|---|---|---|---|---|---|---|---|---|---|---|---|---|---|---|---|---|---|---|---|
| pm25 | 32 (Moderate) | 38 (Unhealthy for Sensitive Groups) | 45 (Unhealthy for Sensitive Groups) | 54 (Unhealthy for Sensitive Groups) | 110 (Very bad Hazardous) | 80 (Very Unhealthy) | 64 (Unhealthy) | 42 (Unhealthy for Sensitive Groups) | 35 (Moderate) | 26 (Moderate) | 30 (Moderate) | 30 (Moderate) | 27 (Moderate) | 52 (Unhealthy for Sensitive Groups) | 46 (Unhealthy for Sensitive Groups) | 121 (Very bad Hazardous) | 102 (Very Unhealthy) | 80 (Very Unhealthy) | 94 (Very Unhealthy) | 49 (Unhealthy for Sensitive Groups) |
| co | 658 (Good) | 618 (Good) | 774 (Good) | 978 (Good) | 1 (Good) | 1 (Good) | 1 (Good) | 840 (Good) | 812 (Good) | 666 (Good) | 832 (Good) | 862 (Good) | 655 (Good) | 849 (Good) | 1 (Good) | 1 (Good) | 1 (Good) | 1 (Good) | 1 (Good) | 950 (Good) |
| no2 | 26 (Good) | 35 (Good) | 35 (Good) | 26 (Good) | 49 (Moderate) | 53 (Moderate) | 58 (Moderate) | 48 (Moderate) | 43 (Moderate) | 30 (Good) | 26 (Good) | 27 (Good) | 31 (Good) | 40 (Moderate) | 38 (Good) | 39 (Good) | 60 (Moderate) | 59 (Moderate) | 62 (Moderate) | 60 (Moderate) |
| o3 | 150 (Unhealthy) | 130 (Unhealthy for Sensitive Groups) | 106 (Moderate) | 90 (Moderate) | 64 (Good) | 46 (Good) | 79 (Moderate) | 108 (Moderate) | 164 (Unhealthy) | 147 (Unhealthy for Sensitive Groups) | 160 (Unhealthy) | 170 (Unhealthy) | 147 (Unhealthy for Sensitive Groups) | 128 (Unhealthy for Sensitive Groups) | 106 (Moderate) | 89 (Moderate) | 49 (Good) | 45 (Good) | 65 (Good) | 105 (Moderate) |
| pm10 | 70 (Unhealthy for Sensitive Groups) | 84 (Unhealthy) | 89 (Unhealthy) | 78 (Unhealthy for Sensitive Groups) | 146 (Very Unhealthy) | 120 (Very Unhealthy) | 128 (Very Unhealthy) | 87 (Unhealthy) | 67 (Unhealthy for Sensitive Groups) | 56 (Unhealthy for Sensitive Groups) | 59 (Unhealthy for Sensitive Groups) | 69 (Unhealthy for Sensitive Groups) | 80 (Unhealthy) | 107 (Unhealthy) | 99 (Unhealthy) | 173 (Very bad Hazardous) | 162 (Very bad Hazardous) | 147 (Very Unhealthy) | 167 (Very bad Hazardous) | 99 (Unhealthy) |
| so2 | 15 (Good) | 17 (Good) | 15 (Good) | 13 (Good) | 16 (Good) | 17 (Good) | 17 (Good) | 15 (Good) | 13 (Good) | 11 (Good) | 11 (Good) | 13 (Good) | 14 (Good) | 19 (Good) | 19 (Good) | 18 (Good) | 25 (Good) | 21 (Good) | 15 (Good) | 19 (Good) |
Green and Parks in the City
Wangcun 0%
Mongolia: 27% Bhutan: 82% Hong Kong: 52% Myanmar: 33%particulate matter PM2.5
Wangcun 84 (Very Unhealthy)
Pleasure of spending time in the city
Wangcun 0%
Mongolia: 22% Bhutan: 61% Hong Kong: 43% Myanmar: 24%particulate matter PM10
Wangcun 140 (Very Unhealthy)
Air Pollution
Wangcun 100%
Mongolia: 87% Bhutan: 45% Hong Kong: 67% Myanmar: 83%Garbage Disposal
Wangcun 0%
Mongolia: 27% Bhutan: 47% Hong Kong: 52% Myanmar: 12%Availability and quality of drinking water
Wangcun 0%
Mongolia: 46% Bhutan: 64% Hong Kong: 66% Myanmar: 34%Cleanliness and tidiness
Wangcun 0%
Mongolia: 29% Bhutan: 57% Hong Kong: 54% Myanmar: 18%Noise and Light pollution
Wangcun 75%
Mongolia: 48% Bhutan: 55% Hong Kong: 66% Myanmar: 52%Water Pollution
Wangcun 100%
Mongolia: 68% Bhutan: 56% Hong Kong: 53% Myanmar: 74%PM10 179 (Very bad Hazardous)
particulate matter (PM10) suspended dustPM2,5 35 (Unhealthy for Sensitive Groups)
particulate matter (PM2.5) dustO3 0.04 (Good)
ozone (O3)NO2 0 (Good)
nitrogen dioxide (NO2)SO2 0 (Good)
sulfur dioxide (SO2)环保西院
| index | 2022-05-27 |
|---|---|
| pm10 | 56 |
| pm25 | 56 |
| o3 | 0.03 |
| no2 | 0 |
| so2 | 0 |
环保西院
| index | 2020-05 | 2020-04 | 2020-03 | 2020-02 | 2020-01 | 2019-12 | 2019-11 | 2019-10 | 2019-09 | 2019-08 | 2019-07 | 2019-06 | 2019-05 | 2019-04 | 2019-03 | 2019-02 | 2019-01 | 2018-12 | 2018-11 | 2018-10 |
|---|---|---|---|---|---|---|---|---|---|---|---|---|---|---|---|---|---|---|---|---|
| pm25 | 32 | 38 | 45 | 54 | 110 | 80 | 64 | 42 | 35 | 26 | 30 | 30 | 27 | 52 | 46 | 121 | 102 | 80 | 94 | 49 |
| co | 658 | 618 | 774 | 978 | 1 | 1 | 1 | 840 | 812 | 666 | 832 | 862 | 655 | 849 | 1 | 1 | 1 | 1 | 1 | 950 |
| no2 | 26 | 35 | 35 | 26 | 49 | 53 | 58 | 48 | 43 | 30 | 26 | 27 | 31 | 40 | 38 | 39 | 60 | 59 | 62 | 60 |
| o3 | 150 | 130 | 106 | 90 | 64 | 46 | 79 | 108 | 164 | 147 | 160 | 170 | 147 | 128 | 106 | 89 | 49 | 45 | 65 | 105 |
| pm10 | 70 | 84 | 89 | 78 | 146 | 120 | 128 | 87 | 67 | 56 | 59 | 69 | 80 | 107 | 99 | 173 | 162 | 147 | 167 | 99 |
| so2 | 15 | 17 | 15 | 13 | 16 | 17 | 17 | 15 | 13 | 11 | 11 | 13 | 14 | 19 | 19 | 18 | 25 | 21 | 15 | 19 |