Air Pollution in Encun: Real-time Air Quality Index and smog alert.
Pollution and air quality forecast for Encun. Today is Tuesday, June 2, 2026. The following air pollution values have been recorded for Encun:- particulate matter (PM10) suspended dust - 179 (Very bad Hazardous)
- particulate matter (PM2.5) dust - 35 (Unhealthy for Sensitive Groups)
- ozone (O3) - 0 (Good)
- nitrogen dioxide (NO2) - 0 (Good)
- sulfur dioxide (SO2) - 0 (Good)

What is the air quality in Encun today? Is the air polluted in Encun?. Is there smog?
What is the level of PM10 today in Encun? (particulate matter (PM10) suspended dust)
The current level of particulate matter PM10 in Encun is:
179 (Very bad Hazardous)
The highest PM10 values usually occur in month: 201 (February 2019).
The lowest value of particulate matter PM10 pollution in Encun is usually recorded in: July (56).
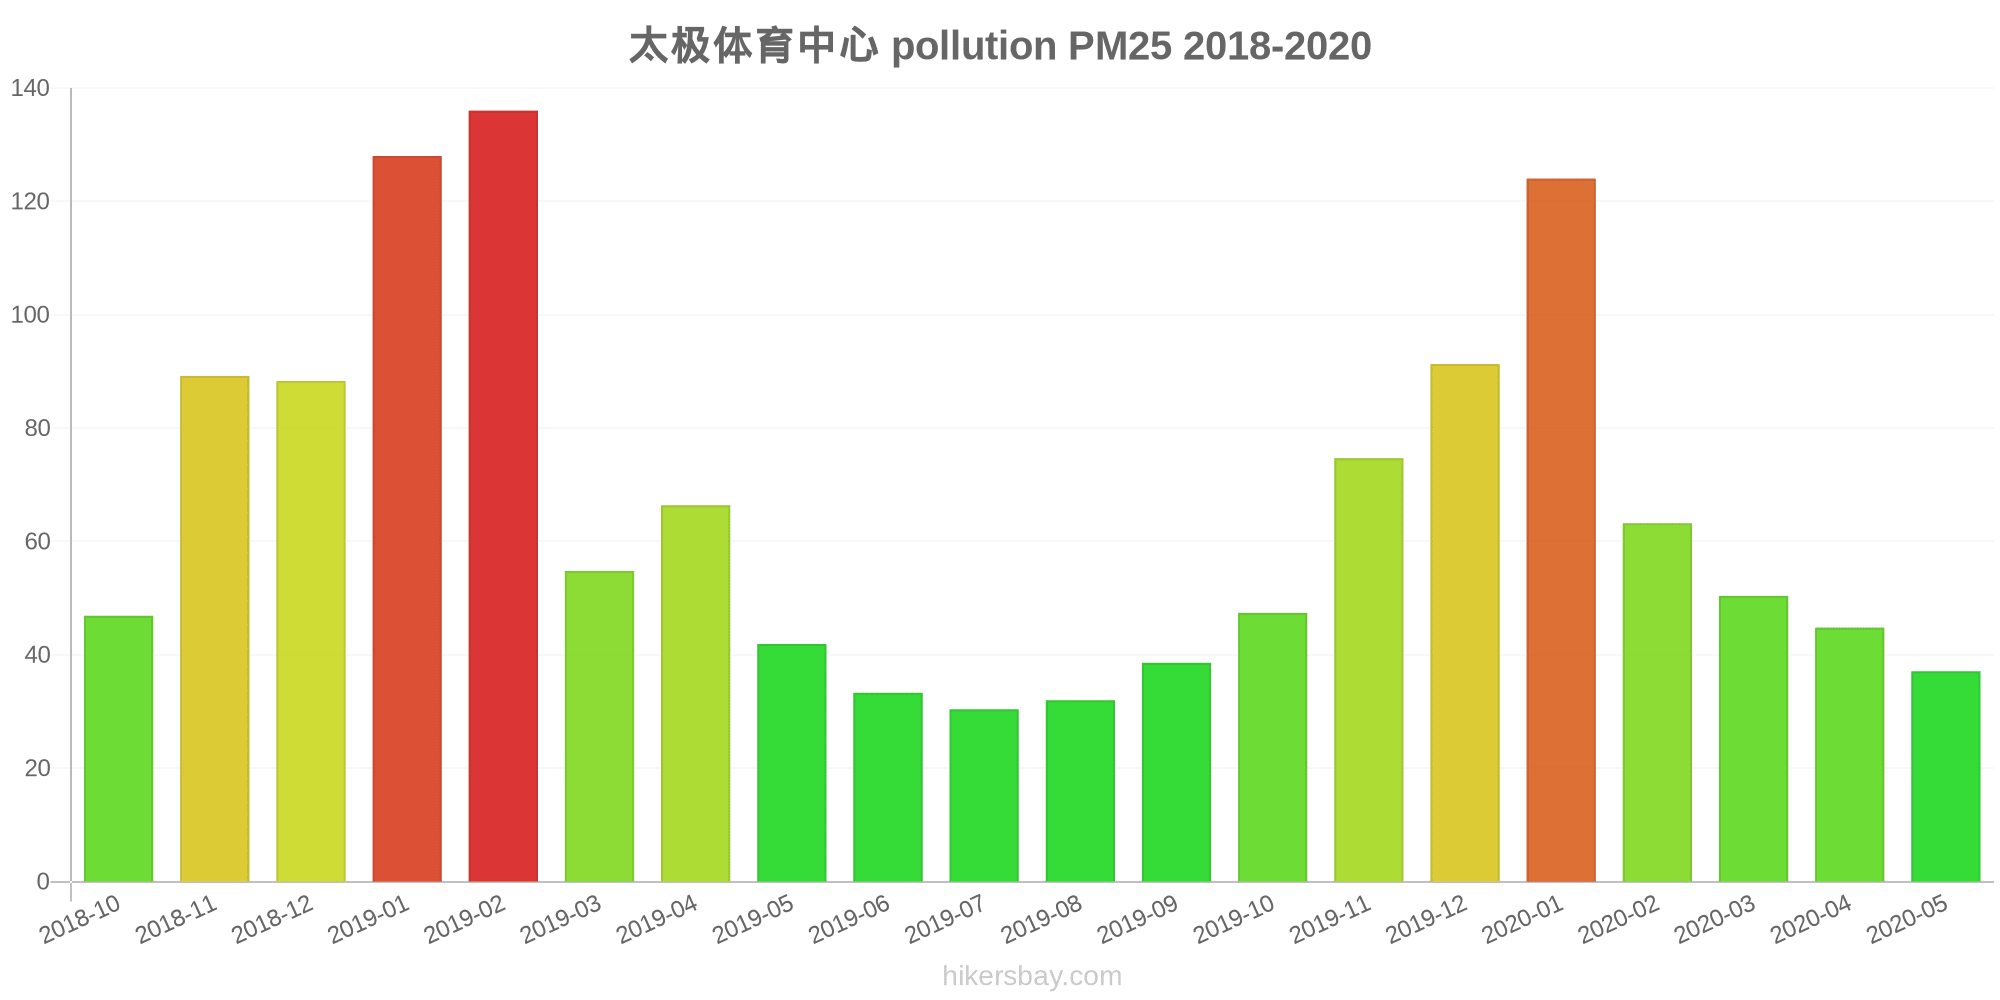
What is the current level of PM2.5 in Encun? (particulate matter (PM2.5) dust)
Today's PM2.5 level is:
35 (Unhealthy for Sensitive Groups)
For comparison, the highest level of PM2.5 in Encun in the last 7 days was: 56 (Friday, May 27, 2022) and the lowest: 56 (Friday, May 27, 2022).
The highest PM2.5 values were recorded: 136 (February 2019).
The lowest level of particulate matter PM2.5 pollution occurs in month: July (30).
How is the O3 level today in Encun? (ozone (O3))
0 (Good)
How high is the level of NO2? (nitrogen dioxide (NO2))
0 (Good)
What is the level of SO2 pollution? (sulfur dioxide (SO2))
0 (Good)
Current data Friday, May 27, 2022, 12:00 PM
PM10 179 (Very bad Hazardous)
PM2,5 35 (Unhealthy for Sensitive Groups)
O3 0 (Good)
NO2 0 (Good)
SO2 0 (Good)
Data on air pollution from recent days in Encun
index
2022-05-27
pm10
56
Unhealthy for Sensitive Groups
pm25
56
Unhealthy
o3
0
Good
no2
0
Good
so2
0
Good
data source »
Air pollution in Encun from October 2018 to May 2020

index
2020-05
2020-04
2020-03
2020-02
2020-01
2019-12
2019-11
2019-10
2019-09
2019-08
2019-07
2019-06
2019-05
2019-04
2019-03
2019-02
2019-01
2018-12
2018-11
2018-10
pm25
37 (Unhealthy for Sensitive Groups)
45 (Unhealthy for Sensitive Groups)
50 (Unhealthy for Sensitive Groups)
63 (Unhealthy)
124 (Very bad Hazardous)
91 (Very Unhealthy)
75 (Unhealthy)
47 (Unhealthy for Sensitive Groups)
39 (Unhealthy for Sensitive Groups)
32 (Moderate)
30 (Moderate)
33 (Moderate)
42 (Unhealthy for Sensitive Groups)
66 (Unhealthy)
55 (Unhealthy for Sensitive Groups)
136 (Very bad Hazardous)
128 (Very bad Hazardous)
88 (Very Unhealthy)
89 (Very Unhealthy)
47 (Unhealthy for Sensitive Groups)
co
698 (Good)
785 (Good)
676 (Good)
913 (Good)
1 (Good)
1 (Good)
885 (Good)
878 (Good)
782 (Good)
710 (Good)
583 (Good)
710 (Good)
601 (Good)
1 (Good)
891 (Good)
1 (Good)
1 (Good)
1 (Good)
1 (Good)
1 (Good)
no2
27 (Good)
36 (Good)
38 (Good)
21 (Good)
45 (Moderate)
49 (Moderate)
51 (Moderate)
39 (Good)
30 (Good)
21 (Good)
18 (Good)
24 (Good)
28 (Good)
34 (Good)
38 (Good)
40 (Moderate)
62 (Moderate)
57 (Moderate)
52 (Moderate)
45 (Moderate)
o3
159 (Unhealthy)
128 (Unhealthy for Sensitive Groups)
100 (Moderate)
88 (Moderate)
60 (Good)
49 (Good)
81 (Moderate)
103 (Moderate)
164 (Unhealthy)
167 (Unhealthy)
185 (Very Unhealthy)
201 (Very Unhealthy)
185 (Very Unhealthy)
139 (Unhealthy for Sensitive Groups)
118 (Moderate)
93 (Moderate)
51 (Good)
45 (Good)
75 (Moderate)
110 (Moderate)
pm10
81 (Unhealthy)
107 (Unhealthy)
112 (Very Unhealthy)
94 (Unhealthy)
170 (Very bad Hazardous)
139 (Very Unhealthy)
141 (Very Unhealthy)
96 (Unhealthy)
73 (Unhealthy for Sensitive Groups)
57 (Unhealthy for Sensitive Groups)
56 (Unhealthy for Sensitive Groups)
76 (Unhealthy for Sensitive Groups)
114 (Very Unhealthy)
134 (Very Unhealthy)
121 (Very Unhealthy)
201 (Very bad Hazardous)
197 (Very bad Hazardous)
170 (Very bad Hazardous)
180 (Very bad Hazardous)
108 (Unhealthy)
so2
11 (Good)
17 (Good)
17 (Good)
11 (Good)
15 (Good)
15 (Good)
15 (Good)
12 (Good)
11 (Good)
8.8 (Good)
6.6 (Good)
10 (Good)
15 (Good)
15 (Good)
16 (Good)
16 (Good)
21 (Good)
23 (Good)
20 (Good)
21 (Good)
data source »
太极体育中心
Friday, May 27, 2022, 12:00 PM
PM10 179 (Very bad Hazardous)
particulate matter (PM10) suspended dust
PM2,5 35 (Unhealthy for Sensitive Groups)
particulate matter (PM2.5) dust
O3 0.04 (Good)
ozone (O3)
NO2 0 (Good)
nitrogen dioxide (NO2)
SO2 0 (Good)
sulfur dioxide (SO2)
太极体育中心
index
2022-05-27
pm10
56
pm25
56
o3
0.03
no2
0
so2
0
太极体育中心
2018-10 2020-05

index
2020-05
2020-04
2020-03
2020-02
2020-01
2019-12
2019-11
2019-10
2019-09
2019-08
2019-07
2019-06
2019-05
2019-04
2019-03
2019-02
2019-01
2018-12
2018-11
2018-10
pm25
37
45
50
63
124
91
75
47
39
32
30
33
42
66
55
136
128
88
89
47
co
698
785
676
913
1
1
885
878
782
710
583
710
601
1
891
1
1
1
1
1
no2
27
36
38
21
45
49
51
39
30
21
18
24
28
34
38
40
62
57
52
45
o3
159
128
100
88
60
49
81
103
164
167
185
201
185
139
118
93
51
45
75
110
pm10
81
107
112
94
170
139
141
96
73
57
56
76
114
134
121
201
197
170
180
108
so2
11
17
17
11
15
15
15
12
11
8.8
6.6
10
15
15
16
16
21
23
20
21
* Pollution data source:
https://openaq.org
(ChinaAQIData)
The data is licensed under CC-By 4.0
PM10 179 (Very bad Hazardous)
PM2,5 35 (Unhealthy for Sensitive Groups)
O3 0 (Good)
NO2 0 (Good)
SO2 0 (Good)
Data on air pollution from recent days in Encun
| index | 2022-05-27 |
|---|---|
| pm10 | 56 Unhealthy for Sensitive Groups |
| pm25 | 56 Unhealthy |
| o3 | 0 Good |
| no2 | 0 Good |
| so2 | 0 Good |

| index | 2020-05 | 2020-04 | 2020-03 | 2020-02 | 2020-01 | 2019-12 | 2019-11 | 2019-10 | 2019-09 | 2019-08 | 2019-07 | 2019-06 | 2019-05 | 2019-04 | 2019-03 | 2019-02 | 2019-01 | 2018-12 | 2018-11 | 2018-10 |
|---|---|---|---|---|---|---|---|---|---|---|---|---|---|---|---|---|---|---|---|---|
| pm25 | 37 (Unhealthy for Sensitive Groups) | 45 (Unhealthy for Sensitive Groups) | 50 (Unhealthy for Sensitive Groups) | 63 (Unhealthy) | 124 (Very bad Hazardous) | 91 (Very Unhealthy) | 75 (Unhealthy) | 47 (Unhealthy for Sensitive Groups) | 39 (Unhealthy for Sensitive Groups) | 32 (Moderate) | 30 (Moderate) | 33 (Moderate) | 42 (Unhealthy for Sensitive Groups) | 66 (Unhealthy) | 55 (Unhealthy for Sensitive Groups) | 136 (Very bad Hazardous) | 128 (Very bad Hazardous) | 88 (Very Unhealthy) | 89 (Very Unhealthy) | 47 (Unhealthy for Sensitive Groups) |
| co | 698 (Good) | 785 (Good) | 676 (Good) | 913 (Good) | 1 (Good) | 1 (Good) | 885 (Good) | 878 (Good) | 782 (Good) | 710 (Good) | 583 (Good) | 710 (Good) | 601 (Good) | 1 (Good) | 891 (Good) | 1 (Good) | 1 (Good) | 1 (Good) | 1 (Good) | 1 (Good) |
| no2 | 27 (Good) | 36 (Good) | 38 (Good) | 21 (Good) | 45 (Moderate) | 49 (Moderate) | 51 (Moderate) | 39 (Good) | 30 (Good) | 21 (Good) | 18 (Good) | 24 (Good) | 28 (Good) | 34 (Good) | 38 (Good) | 40 (Moderate) | 62 (Moderate) | 57 (Moderate) | 52 (Moderate) | 45 (Moderate) |
| o3 | 159 (Unhealthy) | 128 (Unhealthy for Sensitive Groups) | 100 (Moderate) | 88 (Moderate) | 60 (Good) | 49 (Good) | 81 (Moderate) | 103 (Moderate) | 164 (Unhealthy) | 167 (Unhealthy) | 185 (Very Unhealthy) | 201 (Very Unhealthy) | 185 (Very Unhealthy) | 139 (Unhealthy for Sensitive Groups) | 118 (Moderate) | 93 (Moderate) | 51 (Good) | 45 (Good) | 75 (Moderate) | 110 (Moderate) |
| pm10 | 81 (Unhealthy) | 107 (Unhealthy) | 112 (Very Unhealthy) | 94 (Unhealthy) | 170 (Very bad Hazardous) | 139 (Very Unhealthy) | 141 (Very Unhealthy) | 96 (Unhealthy) | 73 (Unhealthy for Sensitive Groups) | 57 (Unhealthy for Sensitive Groups) | 56 (Unhealthy for Sensitive Groups) | 76 (Unhealthy for Sensitive Groups) | 114 (Very Unhealthy) | 134 (Very Unhealthy) | 121 (Very Unhealthy) | 201 (Very bad Hazardous) | 197 (Very bad Hazardous) | 170 (Very bad Hazardous) | 180 (Very bad Hazardous) | 108 (Unhealthy) |
| so2 | 11 (Good) | 17 (Good) | 17 (Good) | 11 (Good) | 15 (Good) | 15 (Good) | 15 (Good) | 12 (Good) | 11 (Good) | 8.8 (Good) | 6.6 (Good) | 10 (Good) | 15 (Good) | 15 (Good) | 16 (Good) | 16 (Good) | 21 (Good) | 23 (Good) | 20 (Good) | 21 (Good) |
PM10 179 (Very bad Hazardous)
particulate matter (PM10) suspended dustPM2,5 35 (Unhealthy for Sensitive Groups)
particulate matter (PM2.5) dustO3 0.04 (Good)
ozone (O3)NO2 0 (Good)
nitrogen dioxide (NO2)SO2 0 (Good)
sulfur dioxide (SO2)太极体育中心
| index | 2022-05-27 |
|---|---|
| pm10 | 56 |
| pm25 | 56 |
| o3 | 0.03 |
| no2 | 0 |
| so2 | 0 |
太极体育中心
| index | 2020-05 | 2020-04 | 2020-03 | 2020-02 | 2020-01 | 2019-12 | 2019-11 | 2019-10 | 2019-09 | 2019-08 | 2019-07 | 2019-06 | 2019-05 | 2019-04 | 2019-03 | 2019-02 | 2019-01 | 2018-12 | 2018-11 | 2018-10 |
|---|---|---|---|---|---|---|---|---|---|---|---|---|---|---|---|---|---|---|---|---|
| pm25 | 37 | 45 | 50 | 63 | 124 | 91 | 75 | 47 | 39 | 32 | 30 | 33 | 42 | 66 | 55 | 136 | 128 | 88 | 89 | 47 |
| co | 698 | 785 | 676 | 913 | 1 | 1 | 885 | 878 | 782 | 710 | 583 | 710 | 601 | 1 | 891 | 1 | 1 | 1 | 1 | 1 |
| no2 | 27 | 36 | 38 | 21 | 45 | 49 | 51 | 39 | 30 | 21 | 18 | 24 | 28 | 34 | 38 | 40 | 62 | 57 | 52 | 45 |
| o3 | 159 | 128 | 100 | 88 | 60 | 49 | 81 | 103 | 164 | 167 | 185 | 201 | 185 | 139 | 118 | 93 | 51 | 45 | 75 | 110 |
| pm10 | 81 | 107 | 112 | 94 | 170 | 139 | 141 | 96 | 73 | 57 | 56 | 76 | 114 | 134 | 121 | 201 | 197 | 170 | 180 | 108 |
| so2 | 11 | 17 | 17 | 11 | 15 | 15 | 15 | 12 | 11 | 8.8 | 6.6 | 10 | 15 | 15 | 16 | 16 | 21 | 23 | 20 | 21 |