Air Pollution in Liwan: Real-time Air Quality Index and smog alert.
Pollution and air quality forecast for Liwan. Today is Tuesday, June 2, 2026. The following air pollution values have been recorded for Liwan:- particulate matter (PM10) suspended dust - 179 (Very bad Hazardous)
- particulate matter (PM2.5) dust - 35 (Unhealthy for Sensitive Groups)
- ozone (O3) - 0 (Good)
- nitrogen dioxide (NO2) - 0 (Good)
- sulfur dioxide (SO2) - 0 (Good)

What is the air quality in Liwan today? Is the air polluted in Liwan?. Is there smog?
What is the level of PM10 today in Liwan? (particulate matter (PM10) suspended dust)
The current level of particulate matter PM10 in Liwan is:
179 (Very bad Hazardous)
The highest PM10 values usually occur in month: 196 (February 2019).
The lowest value of particulate matter PM10 pollution in Liwan is usually recorded in: August (55).
What is the current level of PM2.5 in Liwan? (particulate matter (PM2.5) dust)
Today's PM2.5 level is:
35 (Unhealthy for Sensitive Groups)
For comparison, the highest level of PM2.5 in Liwan in the last 7 days was: 56 (Friday, May 27, 2022) and the lowest: 56 (Friday, May 27, 2022).
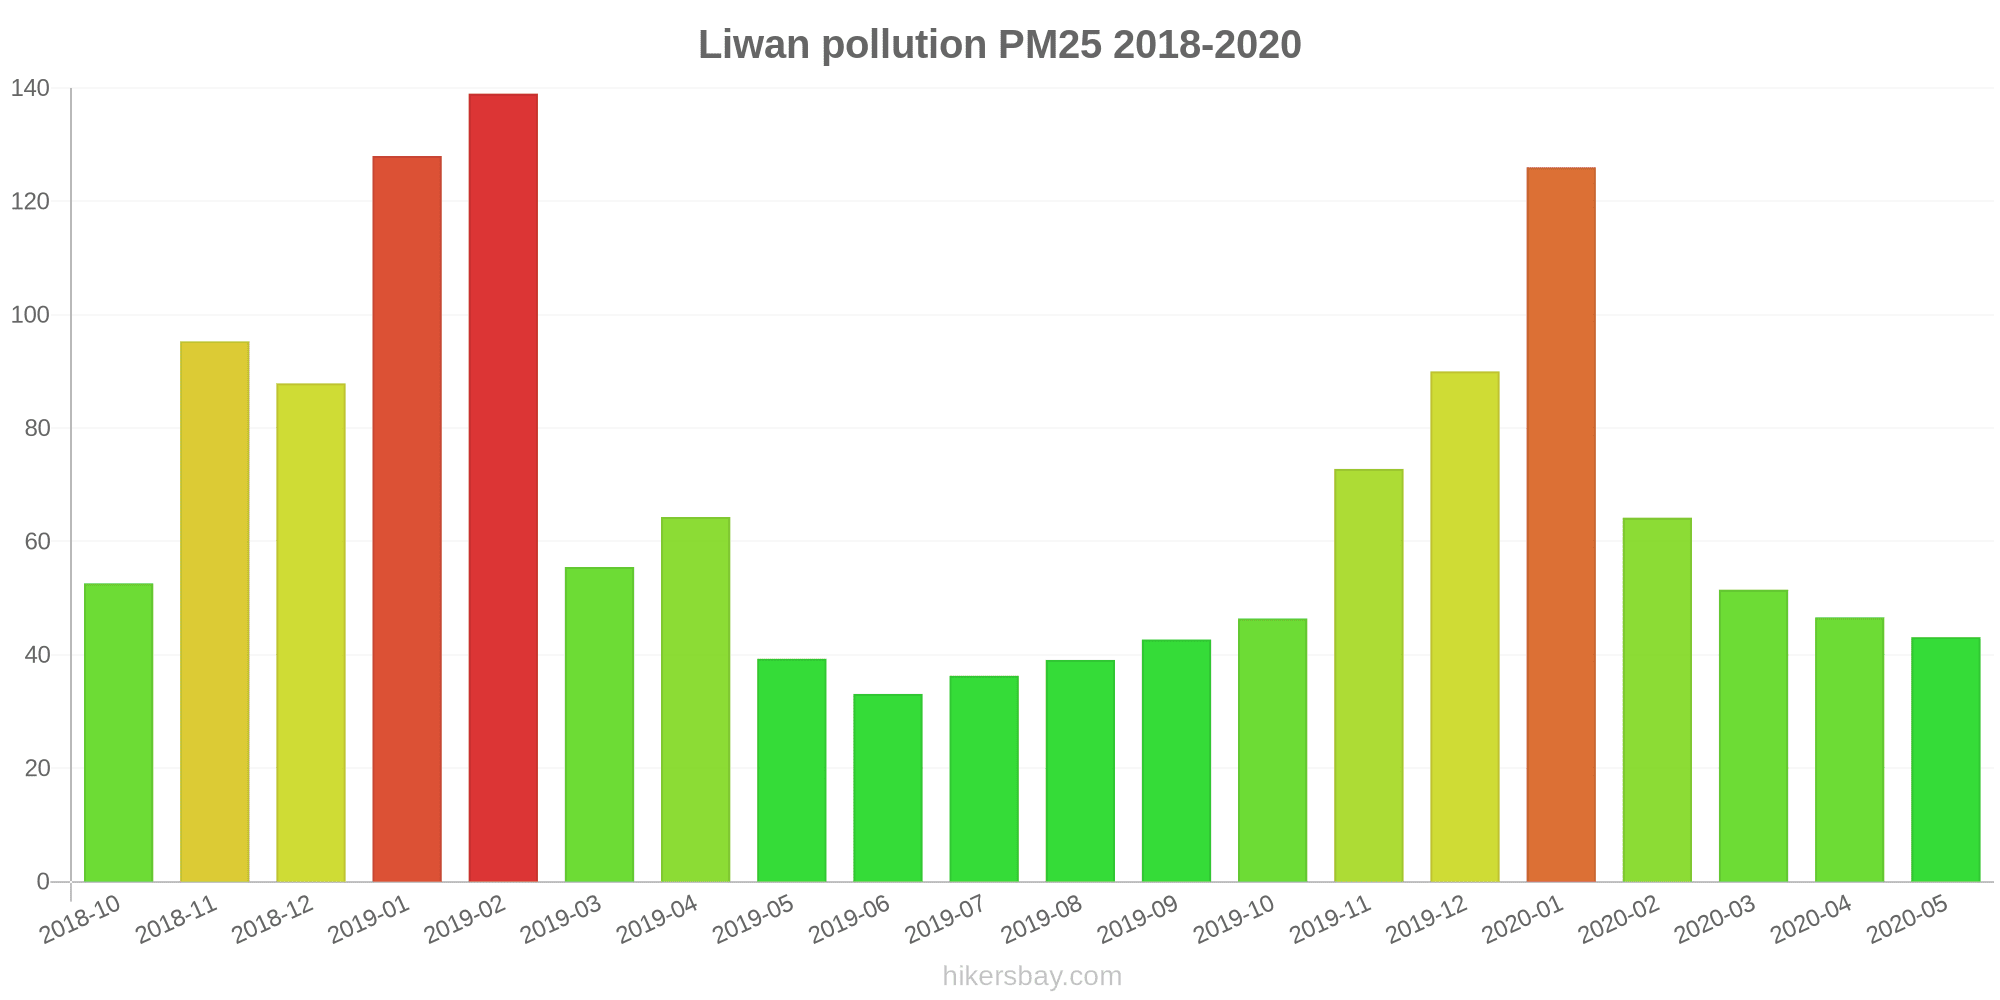
The highest PM2.5 values were recorded: 139 (February 2019).
The lowest level of particulate matter PM2.5 pollution occurs in month: June (33).
How is the O3 level today in Liwan? (ozone (O3))
0 (Good)
How high is the level of NO2? (nitrogen dioxide (NO2))
0 (Good)
What is the level of SO2 pollution? (sulfur dioxide (SO2))
0 (Good)
Current data Friday, May 27, 2022, 12:00 PM
PM10 179 (Very bad Hazardous)
PM2,5 35 (Unhealthy for Sensitive Groups)
O3 0 (Good)
NO2 0 (Good)
SO2 0 (Good)
Data on air pollution from recent days in Liwan
index
2022-05-27
pm10
56
Unhealthy for Sensitive Groups
pm25
56
Unhealthy
o3
0
Good
no2
0
Good
so2
0
Good
data source »
Air pollution in Liwan from October 2018 to May 2020

index
2020-05
2020-04
2020-03
2020-02
2020-01
2019-12
2019-11
2019-10
2019-09
2019-08
2019-07
2019-06
2019-05
2019-04
2019-03
2019-02
2019-01
2018-12
2018-11
2018-10
pm25
43 (Unhealthy for Sensitive Groups)
47 (Unhealthy for Sensitive Groups)
52 (Unhealthy for Sensitive Groups)
64 (Unhealthy)
126 (Very bad Hazardous)
90 (Very Unhealthy)
73 (Unhealthy)
46 (Unhealthy for Sensitive Groups)
43 (Unhealthy for Sensitive Groups)
39 (Unhealthy for Sensitive Groups)
36 (Unhealthy for Sensitive Groups)
33 (Moderate)
39 (Unhealthy for Sensitive Groups)
64 (Unhealthy)
56 (Unhealthy)
139 (Very bad Hazardous)
128 (Very bad Hazardous)
88 (Very Unhealthy)
95 (Very Unhealthy)
53 (Unhealthy for Sensitive Groups)
co
593 (Good)
653 (Good)
699 (Good)
931 (Good)
1 (Good)
1 (Good)
853 (Good)
566 (Good)
506 (Good)
668 (Good)
527 (Good)
450 (Good)
431 (Good)
749 (Good)
669 (Good)
1 (Good)
1 (Good)
1 (Good)
1 (Good)
760 (Good)
no2
25 (Good)
41 (Moderate)
39 (Good)
22 (Good)
44 (Moderate)
52 (Moderate)
52 (Moderate)
43 (Moderate)
33 (Good)
22 (Good)
26 (Good)
34 (Good)
34 (Good)
35 (Good)
39 (Good)
33 (Good)
64 (Moderate)
56 (Moderate)
55 (Moderate)
44 (Moderate)
o3
158 (Unhealthy)
131 (Unhealthy for Sensitive Groups)
105 (Moderate)
96 (Moderate)
63 (Good)
54 (Good)
86 (Moderate)
109 (Moderate)
202 (Very Unhealthy)
176 (Unhealthy)
202 (Very Unhealthy)
214 (Very Unhealthy)
183 (Very Unhealthy)
140 (Unhealthy for Sensitive Groups)
119 (Moderate)
98 (Moderate)
54 (Good)
47 (Good)
80 (Moderate)
113 (Moderate)
pm10
74 (Unhealthy for Sensitive Groups)
101 (Unhealthy)
104 (Unhealthy)
91 (Unhealthy)
160 (Very bad Hazardous)
130 (Very Unhealthy)
135 (Very Unhealthy)
95 (Unhealthy)
82 (Unhealthy)
55 (Unhealthy for Sensitive Groups)
56 (Unhealthy for Sensitive Groups)
83 (Unhealthy)
104 (Unhealthy)
134 (Very Unhealthy)
121 (Very Unhealthy)
196 (Very bad Hazardous)
195 (Very bad Hazardous)
162 (Very bad Hazardous)
176 (Very bad Hazardous)
114 (Very Unhealthy)
so2
15 (Good)
18 (Good)
18 (Good)
13 (Good)
18 (Good)
15 (Good)
16 (Good)
13 (Good)
11 (Good)
9.2 (Good)
8.3 (Good)
13 (Good)
16 (Good)
15 (Good)
17 (Good)
14 (Good)
20 (Good)
20 (Good)
14 (Good)
15 (Good)
data source »
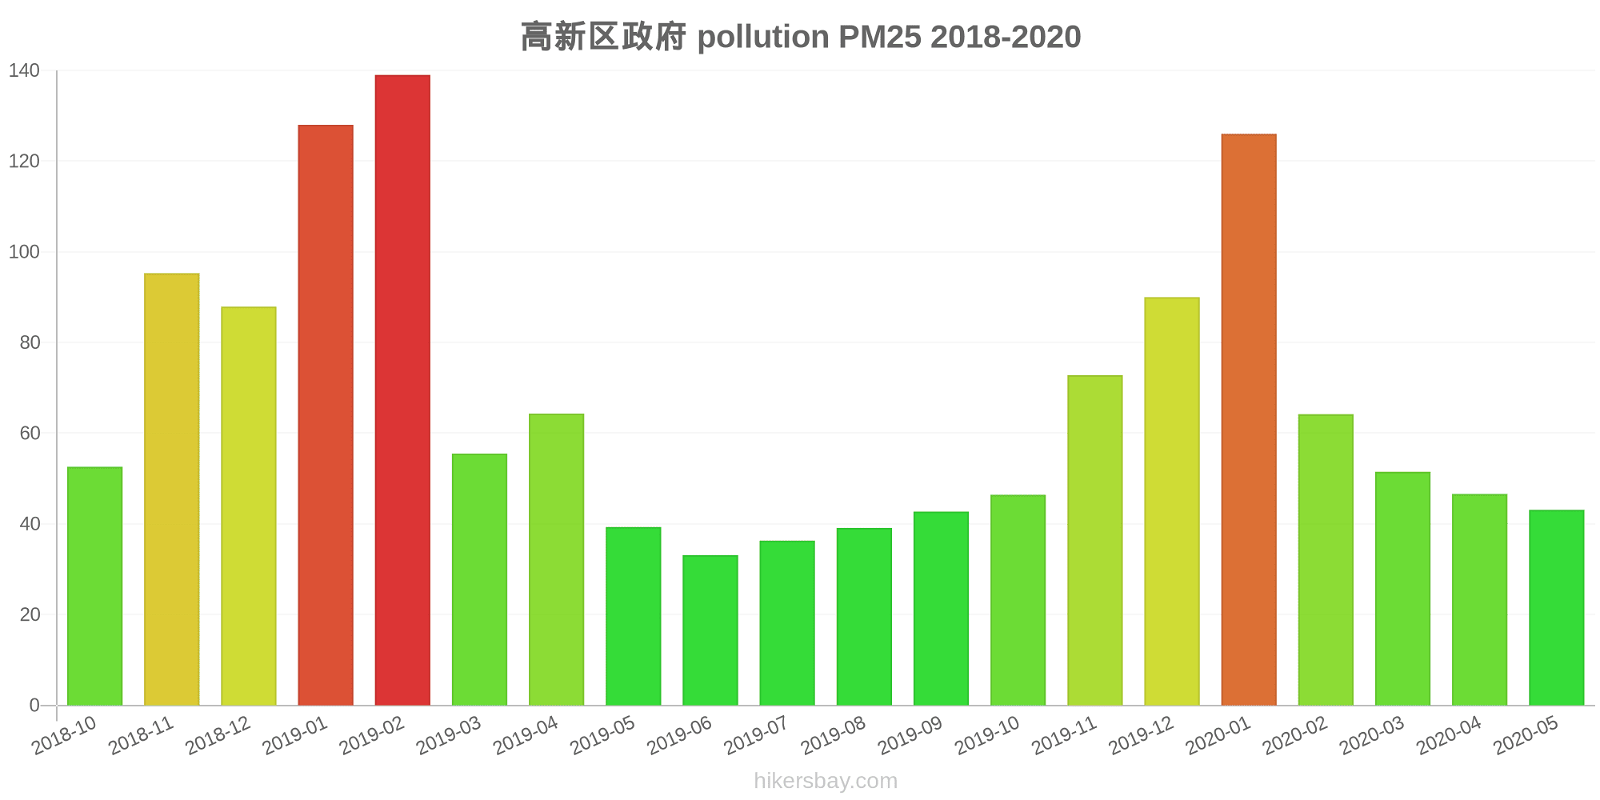
高新区政府
Friday, May 27, 2022, 12:00 PM
PM10 179 (Very bad Hazardous)
particulate matter (PM10) suspended dust
PM2,5 35 (Unhealthy for Sensitive Groups)
particulate matter (PM2.5) dust
O3 0.04 (Good)
ozone (O3)
NO2 0 (Good)
nitrogen dioxide (NO2)
SO2 0 (Good)
sulfur dioxide (SO2)
高新区政府
index
2022-05-27
pm10
56
pm25
56
o3
0.03
no2
0
so2
0
高新区政府
2018-10 2020-05
index
2020-05
2020-04
2020-03
2020-02
2020-01
2019-12
2019-11
2019-10
2019-09
2019-08
2019-07
2019-06
2019-05
2019-04
2019-03
2019-02
2019-01
2018-12
2018-11
2018-10
pm25
43
47
52
64
126
90
73
46
43
39
36
33
39
64
56
139
128
88
95
53
co
593
653
699
931
1
1
853
566
506
668
527
450
431
749
669
1
1
1
1
760
no2
25
41
39
22
44
52
52
43
33
22
26
34
34
35
39
33
64
56
55
44
o3
158
131
105
96
63
54
86
109
202
176
202
214
183
140
119
98
54
47
80
113
pm10
74
101
104
91
160
130
135
95
82
55
56
83
104
134
121
196
195
162
176
114
so2
15
18
18
13
18
15
16
13
11
9.2
8.3
13
16
15
17
14
20
20
14
15
* Pollution data source:
https://openaq.org
(ChinaAQIData)
The data is licensed under CC-By 4.0
PM10 179 (Very bad Hazardous)
PM2,5 35 (Unhealthy for Sensitive Groups)
O3 0 (Good)
NO2 0 (Good)
SO2 0 (Good)
Data on air pollution from recent days in Liwan
| index | 2022-05-27 |
|---|---|
| pm10 | 56 Unhealthy for Sensitive Groups |
| pm25 | 56 Unhealthy |
| o3 | 0 Good |
| no2 | 0 Good |
| so2 | 0 Good |
| index | 2020-05 | 2020-04 | 2020-03 | 2020-02 | 2020-01 | 2019-12 | 2019-11 | 2019-10 | 2019-09 | 2019-08 | 2019-07 | 2019-06 | 2019-05 | 2019-04 | 2019-03 | 2019-02 | 2019-01 | 2018-12 | 2018-11 | 2018-10 |
|---|---|---|---|---|---|---|---|---|---|---|---|---|---|---|---|---|---|---|---|---|
| pm25 | 43 (Unhealthy for Sensitive Groups) | 47 (Unhealthy for Sensitive Groups) | 52 (Unhealthy for Sensitive Groups) | 64 (Unhealthy) | 126 (Very bad Hazardous) | 90 (Very Unhealthy) | 73 (Unhealthy) | 46 (Unhealthy for Sensitive Groups) | 43 (Unhealthy for Sensitive Groups) | 39 (Unhealthy for Sensitive Groups) | 36 (Unhealthy for Sensitive Groups) | 33 (Moderate) | 39 (Unhealthy for Sensitive Groups) | 64 (Unhealthy) | 56 (Unhealthy) | 139 (Very bad Hazardous) | 128 (Very bad Hazardous) | 88 (Very Unhealthy) | 95 (Very Unhealthy) | 53 (Unhealthy for Sensitive Groups) |
| co | 593 (Good) | 653 (Good) | 699 (Good) | 931 (Good) | 1 (Good) | 1 (Good) | 853 (Good) | 566 (Good) | 506 (Good) | 668 (Good) | 527 (Good) | 450 (Good) | 431 (Good) | 749 (Good) | 669 (Good) | 1 (Good) | 1 (Good) | 1 (Good) | 1 (Good) | 760 (Good) |
| no2 | 25 (Good) | 41 (Moderate) | 39 (Good) | 22 (Good) | 44 (Moderate) | 52 (Moderate) | 52 (Moderate) | 43 (Moderate) | 33 (Good) | 22 (Good) | 26 (Good) | 34 (Good) | 34 (Good) | 35 (Good) | 39 (Good) | 33 (Good) | 64 (Moderate) | 56 (Moderate) | 55 (Moderate) | 44 (Moderate) |
| o3 | 158 (Unhealthy) | 131 (Unhealthy for Sensitive Groups) | 105 (Moderate) | 96 (Moderate) | 63 (Good) | 54 (Good) | 86 (Moderate) | 109 (Moderate) | 202 (Very Unhealthy) | 176 (Unhealthy) | 202 (Very Unhealthy) | 214 (Very Unhealthy) | 183 (Very Unhealthy) | 140 (Unhealthy for Sensitive Groups) | 119 (Moderate) | 98 (Moderate) | 54 (Good) | 47 (Good) | 80 (Moderate) | 113 (Moderate) |
| pm10 | 74 (Unhealthy for Sensitive Groups) | 101 (Unhealthy) | 104 (Unhealthy) | 91 (Unhealthy) | 160 (Very bad Hazardous) | 130 (Very Unhealthy) | 135 (Very Unhealthy) | 95 (Unhealthy) | 82 (Unhealthy) | 55 (Unhealthy for Sensitive Groups) | 56 (Unhealthy for Sensitive Groups) | 83 (Unhealthy) | 104 (Unhealthy) | 134 (Very Unhealthy) | 121 (Very Unhealthy) | 196 (Very bad Hazardous) | 195 (Very bad Hazardous) | 162 (Very bad Hazardous) | 176 (Very bad Hazardous) | 114 (Very Unhealthy) |
| so2 | 15 (Good) | 18 (Good) | 18 (Good) | 13 (Good) | 18 (Good) | 15 (Good) | 16 (Good) | 13 (Good) | 11 (Good) | 9.2 (Good) | 8.3 (Good) | 13 (Good) | 16 (Good) | 15 (Good) | 17 (Good) | 14 (Good) | 20 (Good) | 20 (Good) | 14 (Good) | 15 (Good) |
PM10 179 (Very bad Hazardous)
particulate matter (PM10) suspended dustPM2,5 35 (Unhealthy for Sensitive Groups)
particulate matter (PM2.5) dustO3 0.04 (Good)
ozone (O3)NO2 0 (Good)
nitrogen dioxide (NO2)SO2 0 (Good)
sulfur dioxide (SO2)高新区政府
| index | 2022-05-27 |
|---|---|
| pm10 | 56 |
| pm25 | 56 |
| o3 | 0.03 |
| no2 | 0 |
| so2 | 0 |
高新区政府

| index | 2020-05 | 2020-04 | 2020-03 | 2020-02 | 2020-01 | 2019-12 | 2019-11 | 2019-10 | 2019-09 | 2019-08 | 2019-07 | 2019-06 | 2019-05 | 2019-04 | 2019-03 | 2019-02 | 2019-01 | 2018-12 | 2018-11 | 2018-10 |
|---|---|---|---|---|---|---|---|---|---|---|---|---|---|---|---|---|---|---|---|---|
| pm25 | 43 | 47 | 52 | 64 | 126 | 90 | 73 | 46 | 43 | 39 | 36 | 33 | 39 | 64 | 56 | 139 | 128 | 88 | 95 | 53 |
| co | 593 | 653 | 699 | 931 | 1 | 1 | 853 | 566 | 506 | 668 | 527 | 450 | 431 | 749 | 669 | 1 | 1 | 1 | 1 | 760 |
| no2 | 25 | 41 | 39 | 22 | 44 | 52 | 52 | 43 | 33 | 22 | 26 | 34 | 34 | 35 | 39 | 33 | 64 | 56 | 55 | 44 |
| o3 | 158 | 131 | 105 | 96 | 63 | 54 | 86 | 109 | 202 | 176 | 202 | 214 | 183 | 140 | 119 | 98 | 54 | 47 | 80 | 113 |
| pm10 | 74 | 101 | 104 | 91 | 160 | 130 | 135 | 95 | 82 | 55 | 56 | 83 | 104 | 134 | 121 | 196 | 195 | 162 | 176 | 114 |
| so2 | 15 | 18 | 18 | 13 | 18 | 15 | 16 | 13 | 11 | 9.2 | 8.3 | 13 | 16 | 15 | 17 | 14 | 20 | 20 | 14 | 15 |