Air Pollution in Liangjiapu: Real-time Air Quality Index and smog alert.
Pollution and air quality forecast for Liangjiapu. Today is Tuesday, June 2, 2026. The following air pollution values have been recorded for Liangjiapu:- particulate matter (PM10) suspended dust - 179 (Very bad Hazardous)
- particulate matter (PM2.5) dust - 35 (Unhealthy for Sensitive Groups)
- ozone (O3) - 0 (Good)
- nitrogen dioxide (NO2) - 0 (Good)
- sulfur dioxide (SO2) - 0 (Good)

What is the air quality in Liangjiapu today? Is the air polluted in Liangjiapu?. Is there smog?
What is the level of PM10 today in Liangjiapu? (particulate matter (PM10) suspended dust)
The current level of particulate matter PM10 in Liangjiapu is:
179 (Very bad Hazardous)
The highest PM10 values usually occur in month: 115 (December 2018).
The lowest value of particulate matter PM10 pollution in Liangjiapu is usually recorded in: September (35).
What is the current level of PM2.5 in Liangjiapu? (particulate matter (PM2.5) dust)
Today's PM2.5 level is:
35 (Unhealthy for Sensitive Groups)
For comparison, the highest level of PM2.5 in Liangjiapu in the last 7 days was: 56 (Friday, May 27, 2022) and the lowest: 56 (Friday, May 27, 2022).
The highest PM2.5 values were recorded: 67 (January 2019).
The lowest level of particulate matter PM2.5 pollution occurs in month: July (17).
How is the O3 level today in Liangjiapu? (ozone (O3))
0 (Good)
How high is the level of NO2? (nitrogen dioxide (NO2))
0 (Good)
What is the level of SO2 pollution? (sulfur dioxide (SO2))
0 (Good)
Current data Friday, May 27, 2022, 12:00 PM
PM10 179 (Very bad Hazardous)
PM2,5 35 (Unhealthy for Sensitive Groups)
O3 0 (Good)
NO2 0 (Good)
SO2 0 (Good)
Data on air pollution from recent days in Liangjiapu
index
2022-05-27
pm10
56
Unhealthy for Sensitive Groups
pm25
56
Unhealthy
o3
0
Good
no2
0
Good
so2
0
Good
data source »
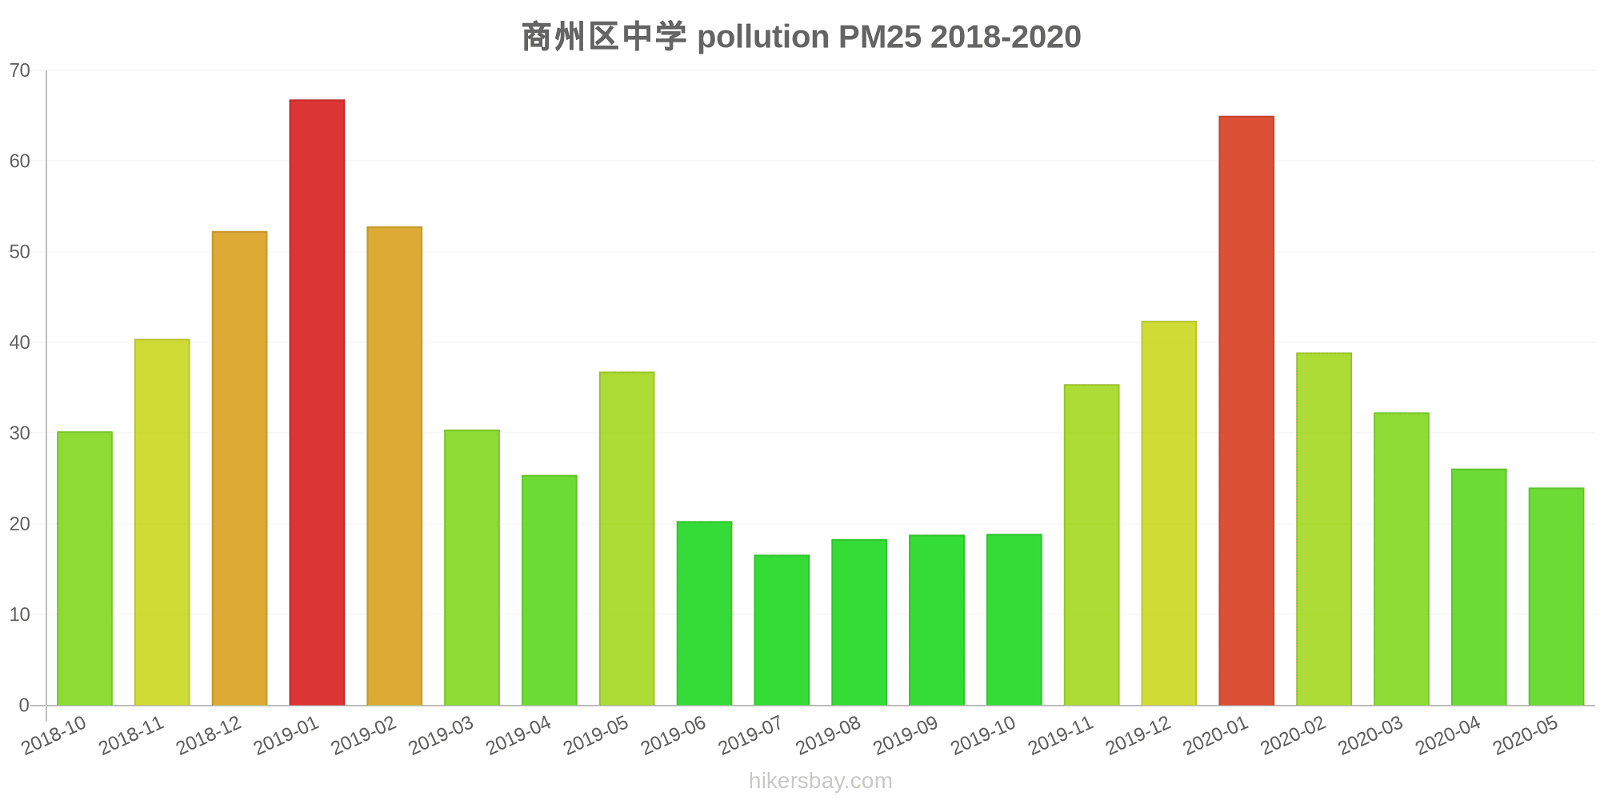
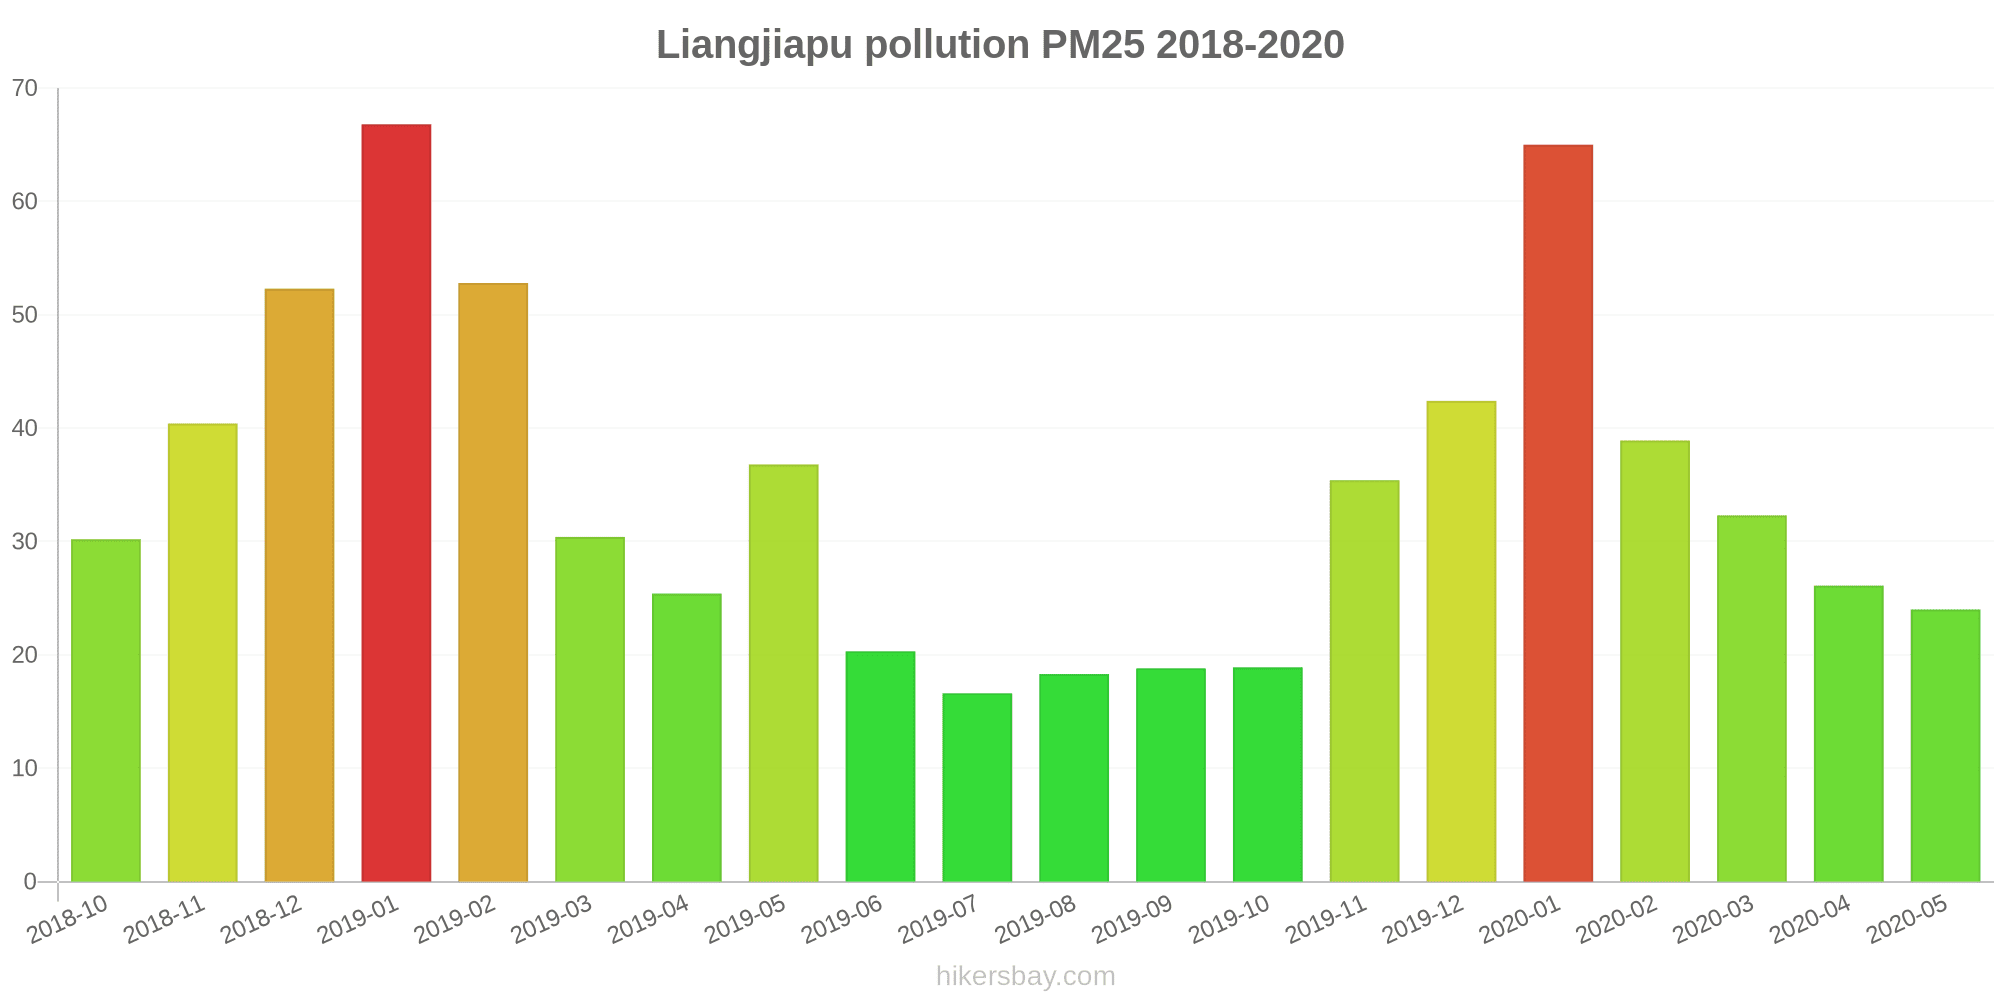
Air pollution in Liangjiapu from October 2018 to May 2020

index
2020-05
2020-04
2020-03
2020-02
2020-01
2019-12
2019-11
2019-10
2019-09
2019-08
2019-07
2019-06
2019-05
2019-04
2019-03
2019-02
2019-01
2018-12
2018-11
2018-10
pm25
24 (Moderate)
26 (Moderate)
32 (Moderate)
39 (Unhealthy for Sensitive Groups)
65 (Unhealthy)
42 (Unhealthy for Sensitive Groups)
35 (Unhealthy for Sensitive Groups)
19 (Moderate)
19 (Moderate)
18 (Moderate)
17 (Moderate)
20 (Moderate)
37 (Unhealthy for Sensitive Groups)
25 (Moderate)
30 (Moderate)
53 (Unhealthy for Sensitive Groups)
67 (Unhealthy)
52 (Unhealthy for Sensitive Groups)
40 (Unhealthy for Sensitive Groups)
30 (Moderate)
co
558 (Good)
439 (Good)
472 (Good)
619 (Good)
1 (Good)
731 (Good)
734 (Good)
646 (Good)
531 (Good)
509 (Good)
462 (Good)
555 (Good)
637 (Good)
699 (Good)
683 (Good)
985 (Good)
1 (Good)
741 (Good)
593 (Good)
536 (Good)
no2
21 (Good)
30 (Good)
21 (Good)
11 (Good)
28 (Good)
33 (Good)
28 (Good)
21 (Good)
17 (Good)
15 (Good)
16 (Good)
19 (Good)
22 (Good)
25 (Good)
31 (Good)
22 (Good)
38 (Good)
36 (Good)
36 (Good)
36 (Good)
o3
145 (Unhealthy for Sensitive Groups)
125 (Unhealthy for Sensitive Groups)
117 (Moderate)
96 (Moderate)
79 (Moderate)
78 (Moderate)
89 (Moderate)
81 (Moderate)
121 (Unhealthy for Sensitive Groups)
126 (Unhealthy for Sensitive Groups)
136 (Unhealthy for Sensitive Groups)
146 (Unhealthy for Sensitive Groups)
129 (Unhealthy for Sensitive Groups)
116 (Moderate)
107 (Moderate)
87 (Moderate)
76 (Moderate)
61 (Good)
77 (Moderate)
97 (Moderate)
pm10
60 (Unhealthy for Sensitive Groups)
58 (Unhealthy for Sensitive Groups)
80 (Unhealthy)
61 (Unhealthy for Sensitive Groups)
72 (Unhealthy for Sensitive Groups)
59 (Unhealthy for Sensitive Groups)
64 (Unhealthy for Sensitive Groups)
43 (Moderate)
35 (Moderate)
37 (Moderate)
36 (Moderate)
41 (Moderate)
103 (Unhealthy)
60 (Unhealthy for Sensitive Groups)
74 (Unhealthy for Sensitive Groups)
86 (Unhealthy)
99 (Unhealthy)
115 (Very Unhealthy)
93 (Unhealthy)
61 (Unhealthy for Sensitive Groups)
so2
12 (Good)
12 (Good)
10 (Good)
10 (Good)
20 (Good)
13 (Good)
17 (Good)
13 (Good)
13 (Good)
12 (Good)
16 (Good)
14 (Good)
11 (Good)
20 (Good)
13 (Good)
16 (Good)
16 (Good)
22 (Good)
11 (Good)
12 (Good)
data source »
商州区中学
Friday, May 27, 2022, 12:00 PM
PM10 179 (Very bad Hazardous)
particulate matter (PM10) suspended dust
PM2,5 35 (Unhealthy for Sensitive Groups)
particulate matter (PM2.5) dust
O3 0.04 (Good)
ozone (O3)
NO2 0 (Good)
nitrogen dioxide (NO2)
SO2 0 (Good)
sulfur dioxide (SO2)
商州区中学
index
2022-05-27
pm10
56
pm25
56
o3
0.03
no2
0
so2
0
商州区中学
2018-10 2020-05
index
2020-05
2020-04
2020-03
2020-02
2020-01
2019-12
2019-11
2019-10
2019-09
2019-08
2019-07
2019-06
2019-05
2019-04
2019-03
2019-02
2019-01
2018-12
2018-11
2018-10
pm25
24
26
32
39
65
42
35
19
19
18
17
20
37
25
30
53
67
52
40
30
co
558
439
472
619
1
731
734
646
531
509
462
555
637
699
683
985
1
741
593
536
no2
21
30
21
11
28
33
28
21
17
15
16
19
22
25
31
22
38
36
36
36
o3
145
125
117
96
79
78
89
81
121
126
136
146
129
116
107
87
76
61
77
97
pm10
60
58
80
61
72
59
64
43
35
37
36
41
103
60
74
86
99
115
93
61
so2
12
12
10
10
20
13
17
13
13
12
16
14
11
20
13
16
16
22
11
12
* Pollution data source:
https://openaq.org
(ChinaAQIData)
The data is licensed under CC-By 4.0
PM10 179 (Very bad Hazardous)
PM2,5 35 (Unhealthy for Sensitive Groups)
O3 0 (Good)
NO2 0 (Good)
SO2 0 (Good)
Data on air pollution from recent days in Liangjiapu
| index | 2022-05-27 |
|---|---|
| pm10 | 56 Unhealthy for Sensitive Groups |
| pm25 | 56 Unhealthy |
| o3 | 0 Good |
| no2 | 0 Good |
| so2 | 0 Good |
| index | 2020-05 | 2020-04 | 2020-03 | 2020-02 | 2020-01 | 2019-12 | 2019-11 | 2019-10 | 2019-09 | 2019-08 | 2019-07 | 2019-06 | 2019-05 | 2019-04 | 2019-03 | 2019-02 | 2019-01 | 2018-12 | 2018-11 | 2018-10 |
|---|---|---|---|---|---|---|---|---|---|---|---|---|---|---|---|---|---|---|---|---|
| pm25 | 24 (Moderate) | 26 (Moderate) | 32 (Moderate) | 39 (Unhealthy for Sensitive Groups) | 65 (Unhealthy) | 42 (Unhealthy for Sensitive Groups) | 35 (Unhealthy for Sensitive Groups) | 19 (Moderate) | 19 (Moderate) | 18 (Moderate) | 17 (Moderate) | 20 (Moderate) | 37 (Unhealthy for Sensitive Groups) | 25 (Moderate) | 30 (Moderate) | 53 (Unhealthy for Sensitive Groups) | 67 (Unhealthy) | 52 (Unhealthy for Sensitive Groups) | 40 (Unhealthy for Sensitive Groups) | 30 (Moderate) |
| co | 558 (Good) | 439 (Good) | 472 (Good) | 619 (Good) | 1 (Good) | 731 (Good) | 734 (Good) | 646 (Good) | 531 (Good) | 509 (Good) | 462 (Good) | 555 (Good) | 637 (Good) | 699 (Good) | 683 (Good) | 985 (Good) | 1 (Good) | 741 (Good) | 593 (Good) | 536 (Good) |
| no2 | 21 (Good) | 30 (Good) | 21 (Good) | 11 (Good) | 28 (Good) | 33 (Good) | 28 (Good) | 21 (Good) | 17 (Good) | 15 (Good) | 16 (Good) | 19 (Good) | 22 (Good) | 25 (Good) | 31 (Good) | 22 (Good) | 38 (Good) | 36 (Good) | 36 (Good) | 36 (Good) |
| o3 | 145 (Unhealthy for Sensitive Groups) | 125 (Unhealthy for Sensitive Groups) | 117 (Moderate) | 96 (Moderate) | 79 (Moderate) | 78 (Moderate) | 89 (Moderate) | 81 (Moderate) | 121 (Unhealthy for Sensitive Groups) | 126 (Unhealthy for Sensitive Groups) | 136 (Unhealthy for Sensitive Groups) | 146 (Unhealthy for Sensitive Groups) | 129 (Unhealthy for Sensitive Groups) | 116 (Moderate) | 107 (Moderate) | 87 (Moderate) | 76 (Moderate) | 61 (Good) | 77 (Moderate) | 97 (Moderate) |
| pm10 | 60 (Unhealthy for Sensitive Groups) | 58 (Unhealthy for Sensitive Groups) | 80 (Unhealthy) | 61 (Unhealthy for Sensitive Groups) | 72 (Unhealthy for Sensitive Groups) | 59 (Unhealthy for Sensitive Groups) | 64 (Unhealthy for Sensitive Groups) | 43 (Moderate) | 35 (Moderate) | 37 (Moderate) | 36 (Moderate) | 41 (Moderate) | 103 (Unhealthy) | 60 (Unhealthy for Sensitive Groups) | 74 (Unhealthy for Sensitive Groups) | 86 (Unhealthy) | 99 (Unhealthy) | 115 (Very Unhealthy) | 93 (Unhealthy) | 61 (Unhealthy for Sensitive Groups) |
| so2 | 12 (Good) | 12 (Good) | 10 (Good) | 10 (Good) | 20 (Good) | 13 (Good) | 17 (Good) | 13 (Good) | 13 (Good) | 12 (Good) | 16 (Good) | 14 (Good) | 11 (Good) | 20 (Good) | 13 (Good) | 16 (Good) | 16 (Good) | 22 (Good) | 11 (Good) | 12 (Good) |
PM10 179 (Very bad Hazardous)
particulate matter (PM10) suspended dustPM2,5 35 (Unhealthy for Sensitive Groups)
particulate matter (PM2.5) dustO3 0.04 (Good)
ozone (O3)NO2 0 (Good)
nitrogen dioxide (NO2)SO2 0 (Good)
sulfur dioxide (SO2)商州区中学
| index | 2022-05-27 |
|---|---|
| pm10 | 56 |
| pm25 | 56 |
| o3 | 0.03 |
| no2 | 0 |
| so2 | 0 |
商州区中学

| index | 2020-05 | 2020-04 | 2020-03 | 2020-02 | 2020-01 | 2019-12 | 2019-11 | 2019-10 | 2019-09 | 2019-08 | 2019-07 | 2019-06 | 2019-05 | 2019-04 | 2019-03 | 2019-02 | 2019-01 | 2018-12 | 2018-11 | 2018-10 |
|---|---|---|---|---|---|---|---|---|---|---|---|---|---|---|---|---|---|---|---|---|
| pm25 | 24 | 26 | 32 | 39 | 65 | 42 | 35 | 19 | 19 | 18 | 17 | 20 | 37 | 25 | 30 | 53 | 67 | 52 | 40 | 30 |
| co | 558 | 439 | 472 | 619 | 1 | 731 | 734 | 646 | 531 | 509 | 462 | 555 | 637 | 699 | 683 | 985 | 1 | 741 | 593 | 536 |
| no2 | 21 | 30 | 21 | 11 | 28 | 33 | 28 | 21 | 17 | 15 | 16 | 19 | 22 | 25 | 31 | 22 | 38 | 36 | 36 | 36 |
| o3 | 145 | 125 | 117 | 96 | 79 | 78 | 89 | 81 | 121 | 126 | 136 | 146 | 129 | 116 | 107 | 87 | 76 | 61 | 77 | 97 |
| pm10 | 60 | 58 | 80 | 61 | 72 | 59 | 64 | 43 | 35 | 37 | 36 | 41 | 103 | 60 | 74 | 86 | 99 | 115 | 93 | 61 |
| so2 | 12 | 12 | 10 | 10 | 20 | 13 | 17 | 13 | 13 | 12 | 16 | 14 | 11 | 20 | 13 | 16 | 16 | 22 | 11 | 12 |