Air Pollution in Wanghu: Real-time Air Quality Index and smog alert.
Pollution and air quality forecast for Wanghu. Today is Tuesday, June 16, 2026. The following air pollution values have been recorded for Wanghu:- particulate matter (PM2.5) dust - 61 (Unhealthy)
- nitrogen dioxide (NO2) - 22 (Good)
- particulate matter (PM10) suspended dust - 69 (Unhealthy for Sensitive Groups)
- carbon monoxide (CO) - 219 (Good)
- ozone (O3) - 0 (Good)
- sulfur dioxide (SO2) - 8 (Good)

What is the air quality in Wanghu today? Is the air polluted in Wanghu?. Is there smog?
What is the current level of PM2.5 in Wanghu? (particulate matter (PM2.5) dust)
Today's PM2.5 level is:
61 (Unhealthy)
For comparison, the highest level of PM2.5 in Wanghu in the last 7 days was: 28 (Friday, May 27, 2022) and the lowest: 28 (Friday, May 27, 2022).
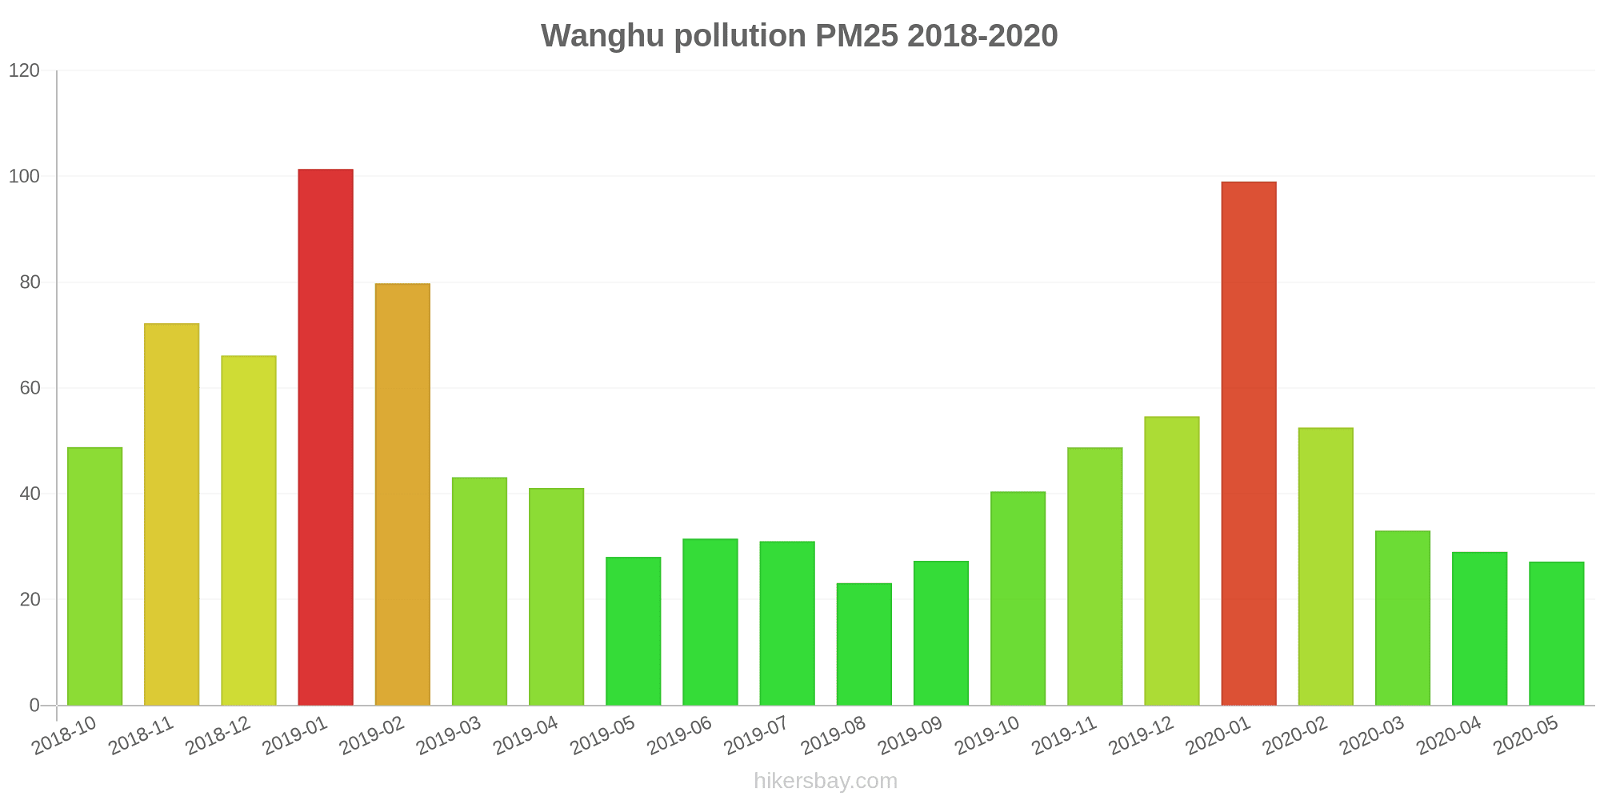
The highest PM2.5 values were recorded: 101 (January 2019).
The lowest level of particulate matter PM2.5 pollution occurs in month: August (23).
How high is the level of NO2? (nitrogen dioxide (NO2))
22 (Good)
What is the level of PM10 today in Wanghu? (particulate matter (PM10) suspended dust)
The current level of particulate matter PM10 in Wanghu is:
69 (Unhealthy for Sensitive Groups)
The highest PM10 values usually occur in month: 159 (January 2019).
The lowest value of particulate matter PM10 pollution in Wanghu is usually recorded in: August (44).
How high is the CO level? (carbon monoxide (CO))
219 (Good)
How is the O3 level today in Wanghu? (ozone (O3))
0 (Good)
What is the level of SO2 pollution? (sulfur dioxide (SO2))
8 (Good)
Current data Friday, May 27, 2022, 3:00 PM
PM2,5 61 (Unhealthy)
NO2 22 (Good)
PM10 69 (Unhealthy for Sensitive Groups)
CO 219 (Good)
O3 0 (Good)
SO2 8 (Good)
Data on air pollution from recent days in Wanghu
index
2022-05-27
pm25
28
Moderate
no2
22
Good
pm10
35
Moderate
co
579
Good
o3
22
Good
so2
5
Good
data source »
Air pollution in Wanghu from October 2018 to May 2020
index
2020-05
2020-04
2020-03
2020-02
2020-01
2019-12
2019-11
2019-10
2019-09
2019-08
2019-07
2019-06
2019-05
2019-04
2019-03
2019-02
2019-01
2018-12
2018-11
2018-10
pm25
27 (Moderate)
29 (Moderate)
33 (Moderate)
53 (Unhealthy for Sensitive Groups)
99 (Very Unhealthy)
55 (Unhealthy for Sensitive Groups)
49 (Unhealthy for Sensitive Groups)
40 (Unhealthy for Sensitive Groups)
27 (Moderate)
23 (Moderate)
31 (Moderate)
32 (Moderate)
28 (Moderate)
41 (Unhealthy for Sensitive Groups)
43 (Unhealthy for Sensitive Groups)
80 (Very Unhealthy)
101 (Very Unhealthy)
66 (Unhealthy)
72 (Unhealthy)
49 (Unhealthy for Sensitive Groups)
co
604 (Good)
538 (Good)
632 (Good)
918 (Good)
1 (Good)
473 (Good)
878 (Good)
807 (Good)
687 (Good)
727 (Good)
716 (Good)
802 (Good)
770 (Good)
875 (Good)
448 (Good)
1 (Good)
1 (Good)
1 (Good)
1 (Good)
1 (Good)
no2
27 (Good)
36 (Good)
34 (Good)
28 (Good)
50 (Moderate)
51 (Moderate)
49 (Moderate)
42 (Moderate)
35 (Good)
28 (Good)
25 (Good)
32 (Good)
40 (Good)
40 (Good)
44 (Moderate)
42 (Moderate)
64 (Moderate)
57 (Moderate)
60 (Moderate)
48 (Moderate)
o3
158 (Unhealthy)
130 (Unhealthy for Sensitive Groups)
108 (Moderate)
91 (Moderate)
71 (Moderate)
55 (Good)
66 (Good)
103 (Moderate)
149 (Unhealthy for Sensitive Groups)
157 (Unhealthy)
203 (Very Unhealthy)
208 (Very Unhealthy)
160 (Unhealthy)
134 (Unhealthy for Sensitive Groups)
115 (Moderate)
94 (Moderate)
47 (Good)
42 (Good)
68 (Good)
99 (Moderate)
pm10
65 (Unhealthy for Sensitive Groups)
69 (Unhealthy for Sensitive Groups)
68 (Unhealthy for Sensitive Groups)
80 (Unhealthy)
139 (Very Unhealthy)
94 (Unhealthy)
98 (Unhealthy)
82 (Unhealthy)
51 (Unhealthy for Sensitive Groups)
44 (Moderate)
52 (Unhealthy for Sensitive Groups)
56 (Unhealthy for Sensitive Groups)
77 (Unhealthy for Sensitive Groups)
90 (Unhealthy)
94 (Unhealthy)
121 (Very Unhealthy)
159 (Very bad Hazardous)
135 (Very Unhealthy)
137 (Very Unhealthy)
102 (Unhealthy)
so2
14 (Good)
14 (Good)
20 (Good)
27 (Good)
44 (Good)
43 (Good)
31 (Good)
17 (Good)
12 (Good)
8.6 (Good)
9.6 (Good)
12 (Good)
16 (Good)
19 (Good)
28 (Good)
47 (Good)
71 (Moderate)
58 (Moderate)
44 (Good)
23 (Good)
data source »
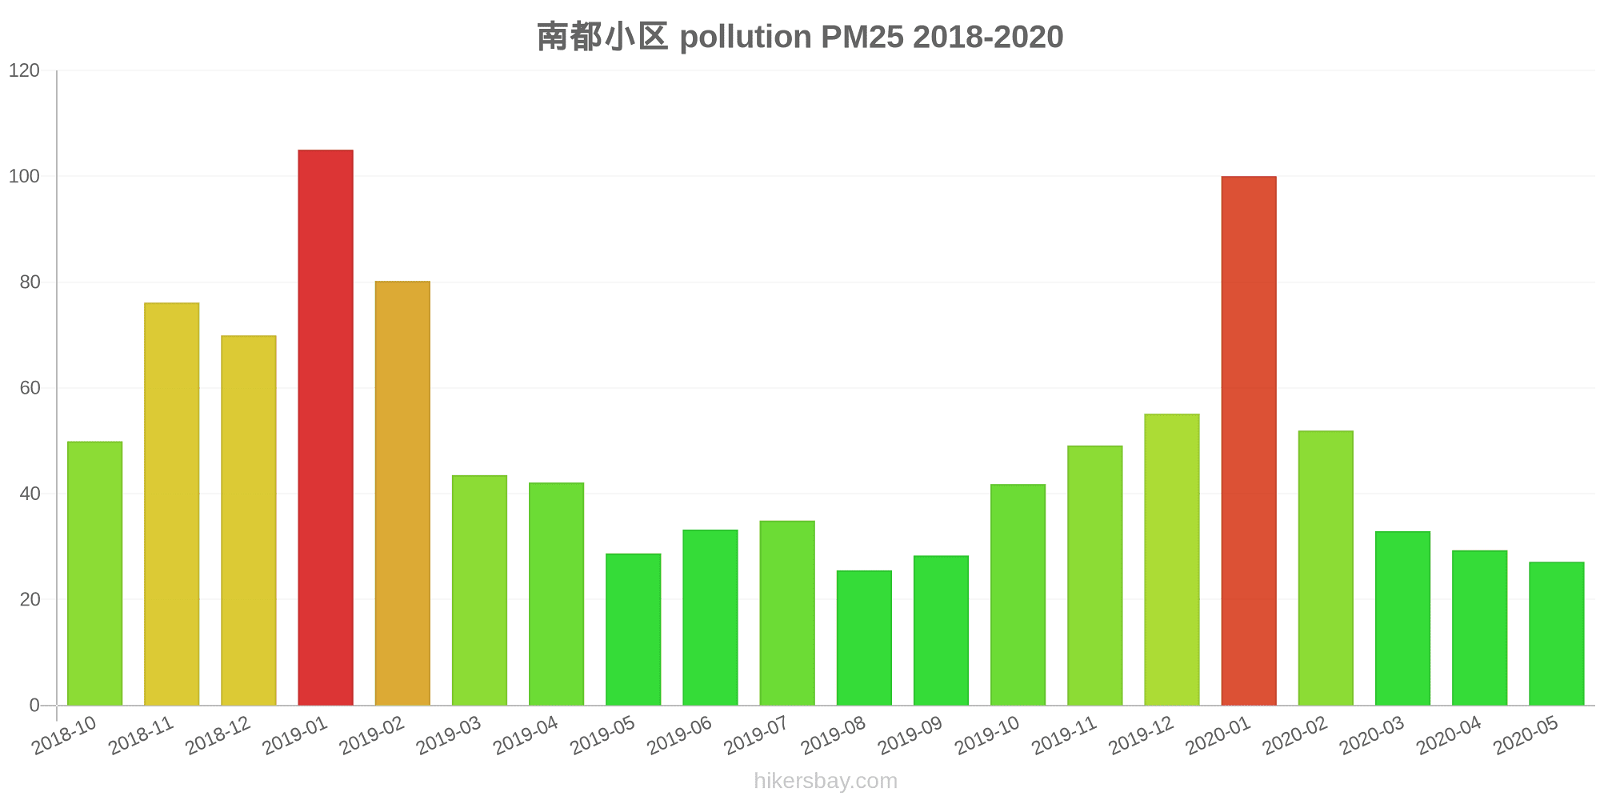
南都小区
Friday, May 27, 2022, 3:00 PM
PM2,5 61 (Unhealthy)
particulate matter (PM2.5) dust
NO2 22 (Good)
nitrogen dioxide (NO2)
PM10 69 (Unhealthy for Sensitive Groups)
particulate matter (PM10) suspended dust
CO 219 (Good)
carbon monoxide (CO)
O3 0.05 (Good)
ozone (O3)
SO2 7.7 (Good)
sulfur dioxide (SO2)
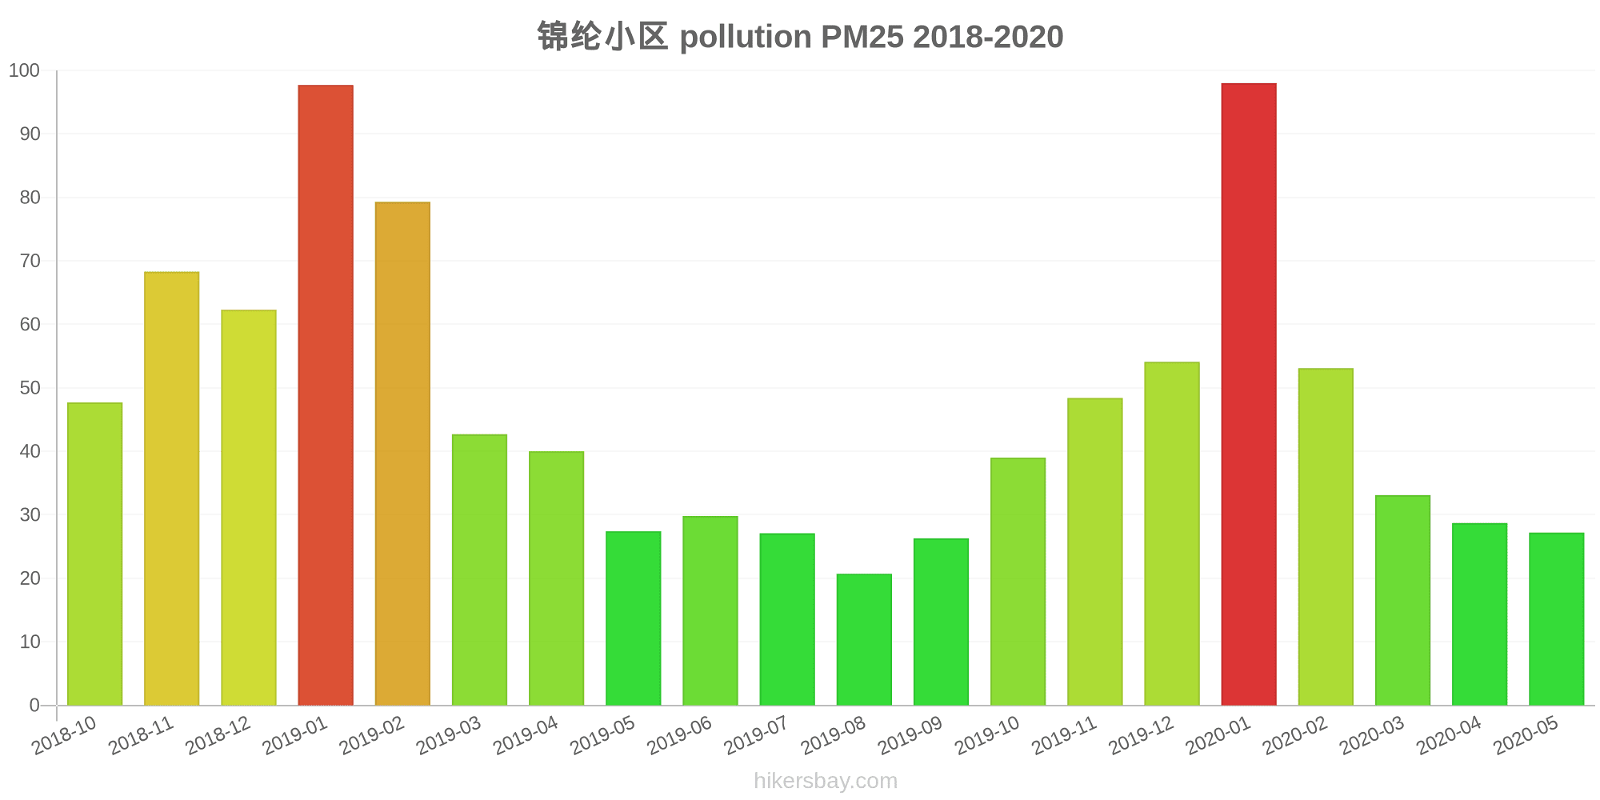
锦纶小区
Friday, May 27, 2022, 3:00 PM
PM2,5 61 (Unhealthy)
particulate matter (PM2.5) dust
NO2 22 (Good)
nitrogen dioxide (NO2)
PM10 69 (Unhealthy for Sensitive Groups)
particulate matter (PM10) suspended dust
CO 219 (Good)
carbon monoxide (CO)
O3 0.05 (Good)
ozone (O3)
SO2 7.7 (Good)
sulfur dioxide (SO2)
南都小区
index
2022-05-27
pm25
28
no2
22
pm10
35
co
579
o3
22
so2
4.6
锦纶小区
index
2022-05-27
pm25
28
no2
22
pm10
35
co
579
o3
22
so2
4.6
南都小区
2018-10 2020-05
index
2020-05
2020-04
2020-03
2020-02
2020-01
2019-12
2019-11
2019-10
2019-09
2019-08
2019-07
2019-06
2019-05
2019-04
2019-03
2019-02
2019-01
2018-12
2018-11
2018-10
pm25
27
29
33
52
100
55
49
42
28
26
35
33
29
42
44
80
105
70
76
50
co
642
556
638
978
1
944
894
835
766
799
745
777
778
831
894
1
1
1
1
1
no2
28
36
35
28
48
50
48
41
36
28
24
32
42
42
45
40
60
56
62
50
o3
159
134
111
93
74
58
66
103
148
158
205
208
163
136
122
92
45
42
71
103
pm10
66
69
68
79
137
94
100
84
52
46
57
59
81
91
97
121
159
140
140
108
so2
15
15
22
28
47
46
33
18
12
8
9.4
13
18
19
30
50
71
56
44
22
锦纶小区
2018-10 2020-05
index
2020-05
2020-04
2020-03
2020-02
2020-01
2019-12
2019-11
2019-10
2019-09
2019-08
2019-07
2019-06
2019-05
2019-04
2019-03
2019-02
2019-01
2018-12
2018-11
2018-10
pm25
27
29
33
53
98
54
48
39
26
21
27
30
27
40
43
79
98
62
68
48
co
565
519
626
858
1
1
861
778
607
654
686
826
761
918
1
1
1
1
1
1
no2
27
35
33
27
52
53
49
43
34
28
25
32
38
38
44
45
68
57
59
47
o3
157
125
105
89
67
52
66
102
150
156
201
208
157
132
107
95
48
43
66
96
pm10
64
68
69
82
140
93
95
80
50
42
47
54
73
90
91
121
158
130
133
96
so2
13
12
18
26
41
39
29
16
12
9.2
9.8
11
14
20
27
44
70
60
45
23
* Pollution data source:
https://openaq.org
(ChinaAQIData)
The data is licensed under CC-By 4.0
PM2,5 61 (Unhealthy)
NO2 22 (Good)
PM10 69 (Unhealthy for Sensitive Groups)
CO 219 (Good)
O3 0 (Good)
SO2 8 (Good)
Data on air pollution from recent days in Wanghu
| index | 2022-05-27 |
|---|---|
| pm25 | 28 Moderate |
| no2 | 22 Good |
| pm10 | 35 Moderate |
| co | 579 Good |
| o3 | 22 Good |
| so2 | 5 Good |

| index | 2020-05 | 2020-04 | 2020-03 | 2020-02 | 2020-01 | 2019-12 | 2019-11 | 2019-10 | 2019-09 | 2019-08 | 2019-07 | 2019-06 | 2019-05 | 2019-04 | 2019-03 | 2019-02 | 2019-01 | 2018-12 | 2018-11 | 2018-10 |
|---|---|---|---|---|---|---|---|---|---|---|---|---|---|---|---|---|---|---|---|---|
| pm25 | 27 (Moderate) | 29 (Moderate) | 33 (Moderate) | 53 (Unhealthy for Sensitive Groups) | 99 (Very Unhealthy) | 55 (Unhealthy for Sensitive Groups) | 49 (Unhealthy for Sensitive Groups) | 40 (Unhealthy for Sensitive Groups) | 27 (Moderate) | 23 (Moderate) | 31 (Moderate) | 32 (Moderate) | 28 (Moderate) | 41 (Unhealthy for Sensitive Groups) | 43 (Unhealthy for Sensitive Groups) | 80 (Very Unhealthy) | 101 (Very Unhealthy) | 66 (Unhealthy) | 72 (Unhealthy) | 49 (Unhealthy for Sensitive Groups) |
| co | 604 (Good) | 538 (Good) | 632 (Good) | 918 (Good) | 1 (Good) | 473 (Good) | 878 (Good) | 807 (Good) | 687 (Good) | 727 (Good) | 716 (Good) | 802 (Good) | 770 (Good) | 875 (Good) | 448 (Good) | 1 (Good) | 1 (Good) | 1 (Good) | 1 (Good) | 1 (Good) |
| no2 | 27 (Good) | 36 (Good) | 34 (Good) | 28 (Good) | 50 (Moderate) | 51 (Moderate) | 49 (Moderate) | 42 (Moderate) | 35 (Good) | 28 (Good) | 25 (Good) | 32 (Good) | 40 (Good) | 40 (Good) | 44 (Moderate) | 42 (Moderate) | 64 (Moderate) | 57 (Moderate) | 60 (Moderate) | 48 (Moderate) |
| o3 | 158 (Unhealthy) | 130 (Unhealthy for Sensitive Groups) | 108 (Moderate) | 91 (Moderate) | 71 (Moderate) | 55 (Good) | 66 (Good) | 103 (Moderate) | 149 (Unhealthy for Sensitive Groups) | 157 (Unhealthy) | 203 (Very Unhealthy) | 208 (Very Unhealthy) | 160 (Unhealthy) | 134 (Unhealthy for Sensitive Groups) | 115 (Moderate) | 94 (Moderate) | 47 (Good) | 42 (Good) | 68 (Good) | 99 (Moderate) |
| pm10 | 65 (Unhealthy for Sensitive Groups) | 69 (Unhealthy for Sensitive Groups) | 68 (Unhealthy for Sensitive Groups) | 80 (Unhealthy) | 139 (Very Unhealthy) | 94 (Unhealthy) | 98 (Unhealthy) | 82 (Unhealthy) | 51 (Unhealthy for Sensitive Groups) | 44 (Moderate) | 52 (Unhealthy for Sensitive Groups) | 56 (Unhealthy for Sensitive Groups) | 77 (Unhealthy for Sensitive Groups) | 90 (Unhealthy) | 94 (Unhealthy) | 121 (Very Unhealthy) | 159 (Very bad Hazardous) | 135 (Very Unhealthy) | 137 (Very Unhealthy) | 102 (Unhealthy) |
| so2 | 14 (Good) | 14 (Good) | 20 (Good) | 27 (Good) | 44 (Good) | 43 (Good) | 31 (Good) | 17 (Good) | 12 (Good) | 8.6 (Good) | 9.6 (Good) | 12 (Good) | 16 (Good) | 19 (Good) | 28 (Good) | 47 (Good) | 71 (Moderate) | 58 (Moderate) | 44 (Good) | 23 (Good) |
PM2,5 61 (Unhealthy)
particulate matter (PM2.5) dustNO2 22 (Good)
nitrogen dioxide (NO2)PM10 69 (Unhealthy for Sensitive Groups)
particulate matter (PM10) suspended dustCO 219 (Good)
carbon monoxide (CO)O3 0.05 (Good)
ozone (O3)SO2 7.7 (Good)
sulfur dioxide (SO2)PM2,5 61 (Unhealthy)
particulate matter (PM2.5) dustNO2 22 (Good)
nitrogen dioxide (NO2)PM10 69 (Unhealthy for Sensitive Groups)
particulate matter (PM10) suspended dustCO 219 (Good)
carbon monoxide (CO)O3 0.05 (Good)
ozone (O3)SO2 7.7 (Good)
sulfur dioxide (SO2)南都小区
| index | 2022-05-27 |
|---|---|
| pm25 | 28 |
| no2 | 22 |
| pm10 | 35 |
| co | 579 |
| o3 | 22 |
| so2 | 4.6 |
锦纶小区
| index | 2022-05-27 |
|---|---|
| pm25 | 28 |
| no2 | 22 |
| pm10 | 35 |
| co | 579 |
| o3 | 22 |
| so2 | 4.6 |
南都小区

| index | 2020-05 | 2020-04 | 2020-03 | 2020-02 | 2020-01 | 2019-12 | 2019-11 | 2019-10 | 2019-09 | 2019-08 | 2019-07 | 2019-06 | 2019-05 | 2019-04 | 2019-03 | 2019-02 | 2019-01 | 2018-12 | 2018-11 | 2018-10 |
|---|---|---|---|---|---|---|---|---|---|---|---|---|---|---|---|---|---|---|---|---|
| pm25 | 27 | 29 | 33 | 52 | 100 | 55 | 49 | 42 | 28 | 26 | 35 | 33 | 29 | 42 | 44 | 80 | 105 | 70 | 76 | 50 |
| co | 642 | 556 | 638 | 978 | 1 | 944 | 894 | 835 | 766 | 799 | 745 | 777 | 778 | 831 | 894 | 1 | 1 | 1 | 1 | 1 |
| no2 | 28 | 36 | 35 | 28 | 48 | 50 | 48 | 41 | 36 | 28 | 24 | 32 | 42 | 42 | 45 | 40 | 60 | 56 | 62 | 50 |
| o3 | 159 | 134 | 111 | 93 | 74 | 58 | 66 | 103 | 148 | 158 | 205 | 208 | 163 | 136 | 122 | 92 | 45 | 42 | 71 | 103 |
| pm10 | 66 | 69 | 68 | 79 | 137 | 94 | 100 | 84 | 52 | 46 | 57 | 59 | 81 | 91 | 97 | 121 | 159 | 140 | 140 | 108 |
| so2 | 15 | 15 | 22 | 28 | 47 | 46 | 33 | 18 | 12 | 8 | 9.4 | 13 | 18 | 19 | 30 | 50 | 71 | 56 | 44 | 22 |
锦纶小区

| index | 2020-05 | 2020-04 | 2020-03 | 2020-02 | 2020-01 | 2019-12 | 2019-11 | 2019-10 | 2019-09 | 2019-08 | 2019-07 | 2019-06 | 2019-05 | 2019-04 | 2019-03 | 2019-02 | 2019-01 | 2018-12 | 2018-11 | 2018-10 |
|---|---|---|---|---|---|---|---|---|---|---|---|---|---|---|---|---|---|---|---|---|
| pm25 | 27 | 29 | 33 | 53 | 98 | 54 | 48 | 39 | 26 | 21 | 27 | 30 | 27 | 40 | 43 | 79 | 98 | 62 | 68 | 48 |
| co | 565 | 519 | 626 | 858 | 1 | 1 | 861 | 778 | 607 | 654 | 686 | 826 | 761 | 918 | 1 | 1 | 1 | 1 | 1 | 1 |
| no2 | 27 | 35 | 33 | 27 | 52 | 53 | 49 | 43 | 34 | 28 | 25 | 32 | 38 | 38 | 44 | 45 | 68 | 57 | 59 | 47 |
| o3 | 157 | 125 | 105 | 89 | 67 | 52 | 66 | 102 | 150 | 156 | 201 | 208 | 157 | 132 | 107 | 95 | 48 | 43 | 66 | 96 |
| pm10 | 64 | 68 | 69 | 82 | 140 | 93 | 95 | 80 | 50 | 42 | 47 | 54 | 73 | 90 | 91 | 121 | 158 | 130 | 133 | 96 |
| so2 | 13 | 12 | 18 | 26 | 41 | 39 | 29 | 16 | 12 | 9.2 | 9.8 | 11 | 14 | 20 | 27 | 44 | 70 | 60 | 45 | 23 |