Air Pollution in Qinxian: Real-time Air Quality Index and smog alert.
Pollution and air quality forecast for Qinxian. Today is Tuesday, June 16, 2026. The following air pollution values have been recorded for Qinxian:- particulate matter (PM2.5) dust - 61 (Unhealthy)
- nitrogen dioxide (NO2) - 22 (Good)
- particulate matter (PM10) suspended dust - 69 (Unhealthy for Sensitive Groups)
- carbon monoxide (CO) - 219 (Good)
- ozone (O3) - 0 (Good)
- sulfur dioxide (SO2) - 8 (Good)

What is the air quality in Qinxian today? Is the air polluted in Qinxian?. Is there smog?
What is the current level of PM2.5 in Qinxian? (particulate matter (PM2.5) dust)
Today's PM2.5 level is:
61 (Unhealthy)
For comparison, the highest level of PM2.5 in Qinxian in the last 7 days was: 28 (Friday, May 27, 2022) and the lowest: 28 (Friday, May 27, 2022).
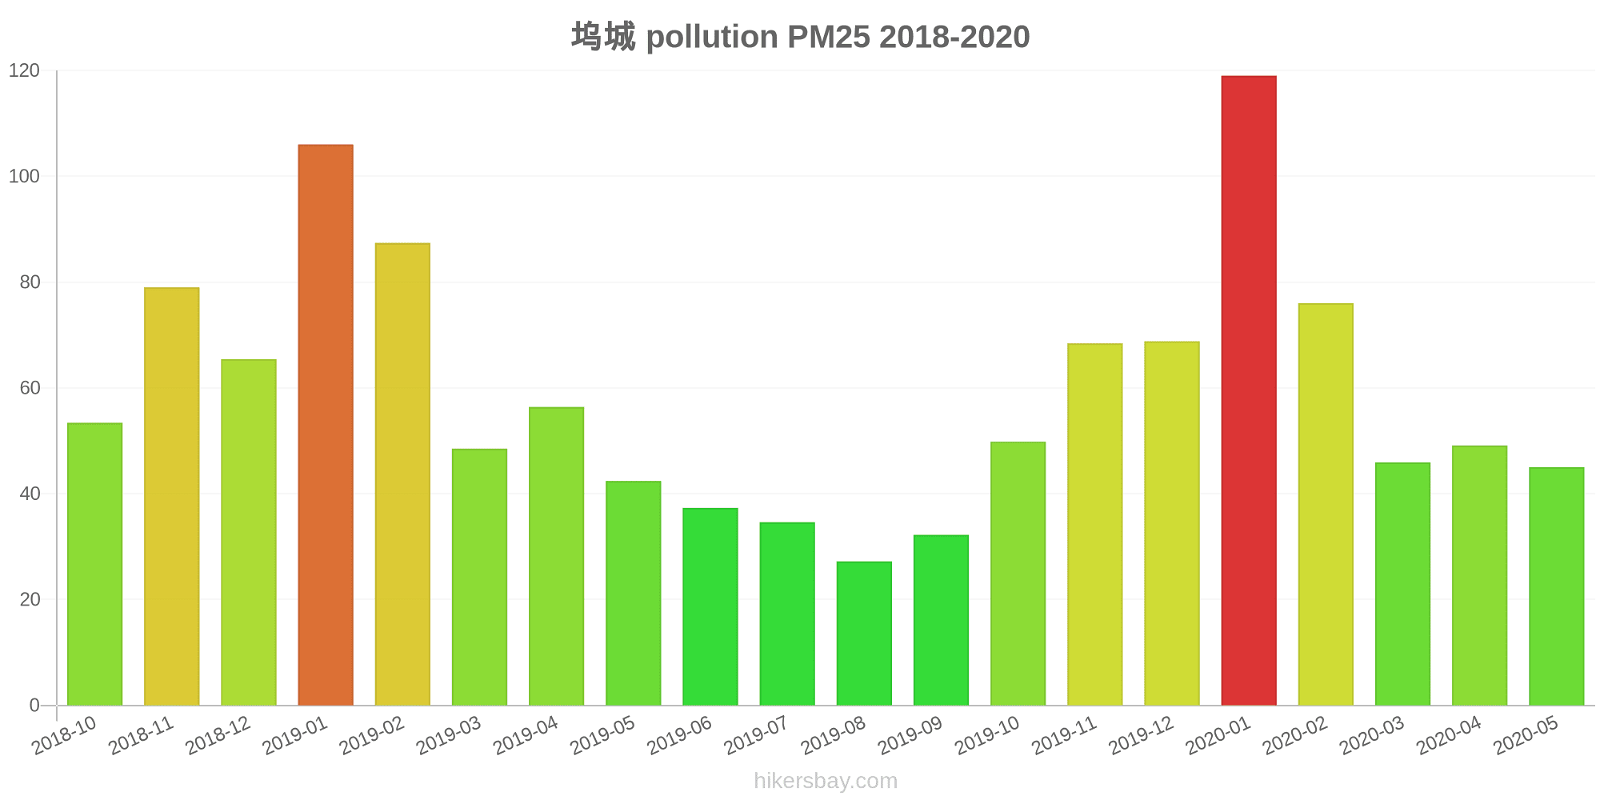
The highest PM2.5 values were recorded: 119 (January 2020).
The lowest level of particulate matter PM2.5 pollution occurs in month: August (27).
How high is the level of NO2? (nitrogen dioxide (NO2))
22 (Good)
What is the level of PM10 today in Qinxian? (particulate matter (PM10) suspended dust)
The current level of particulate matter PM10 in Qinxian is:
69 (Unhealthy for Sensitive Groups)
The highest PM10 values usually occur in month: 189 (January 2019).
The lowest value of particulate matter PM10 pollution in Qinxian is usually recorded in: August (56).
How high is the CO level? (carbon monoxide (CO))
219 (Good)
How is the O3 level today in Qinxian? (ozone (O3))
0 (Good)
What is the level of SO2 pollution? (sulfur dioxide (SO2))
8 (Good)
Current data Friday, May 27, 2022, 3:00 PM
PM2,5 61 (Unhealthy)
NO2 22 (Good)
PM10 69 (Unhealthy for Sensitive Groups)
CO 219 (Good)
O3 0 (Good)
SO2 8 (Good)
Data on air pollution from recent days in Qinxian
index
2022-05-27
pm25
28
Moderate
no2
22
Good
pm10
35
Moderate
co
579
Good
o3
22
Good
so2
5
Good
data source »
Air pollution in Qinxian from October 2018 to May 2020

index
2020-05
2020-04
2020-03
2020-02
2020-01
2019-12
2019-11
2019-10
2019-09
2019-08
2019-07
2019-06
2019-05
2019-04
2019-03
2019-02
2019-01
2018-12
2018-11
2018-10
pm25
45 (Unhealthy for Sensitive Groups)
49 (Unhealthy for Sensitive Groups)
46 (Unhealthy for Sensitive Groups)
76 (Very Unhealthy)
119 (Very bad Hazardous)
69 (Unhealthy)
68 (Unhealthy)
50 (Unhealthy for Sensitive Groups)
32 (Moderate)
27 (Moderate)
35 (Moderate)
37 (Unhealthy for Sensitive Groups)
42 (Unhealthy for Sensitive Groups)
56 (Unhealthy)
49 (Unhealthy for Sensitive Groups)
87 (Very Unhealthy)
106 (Very Unhealthy)
65 (Unhealthy)
79 (Very Unhealthy)
53 (Unhealthy for Sensitive Groups)
co
822 (Good)
732 (Good)
702 (Good)
1 (Good)
1 (Good)
1 (Good)
1 (Good)
1 (Good)
999 (Good)
897 (Good)
842 (Good)
905 (Good)
720 (Good)
892 (Good)
992 (Good)
1 (Good)
1 (Good)
1 (Good)
1 (Good)
794 (Good)
no2
36 (Good)
50 (Moderate)
38 (Good)
38 (Good)
57 (Moderate)
55 (Moderate)
58 (Moderate)
52 (Moderate)
52 (Moderate)
37 (Good)
33 (Good)
36 (Good)
46 (Moderate)
48 (Moderate)
46 (Moderate)
50 (Moderate)
75 (Moderate)
54 (Moderate)
63 (Moderate)
51 (Moderate)
o3
157 (Unhealthy)
133 (Unhealthy for Sensitive Groups)
109 (Moderate)
93 (Moderate)
68 (Good)
53 (Good)
54 (Good)
95 (Moderate)
138 (Unhealthy for Sensitive Groups)
153 (Unhealthy)
201 (Very Unhealthy)
211 (Very Unhealthy)
159 (Unhealthy)
125 (Unhealthy for Sensitive Groups)
114 (Moderate)
92 (Moderate)
48 (Good)
49 (Good)
70 (Good)
95 (Moderate)
pm10
102 (Unhealthy)
113 (Very Unhealthy)
99 (Unhealthy)
109 (Unhealthy)
159 (Very bad Hazardous)
116 (Very Unhealthy)
133 (Very Unhealthy)
116 (Very Unhealthy)
74 (Unhealthy for Sensitive Groups)
56 (Unhealthy for Sensitive Groups)
64 (Unhealthy for Sensitive Groups)
74 (Unhealthy for Sensitive Groups)
126 (Very Unhealthy)
130 (Very Unhealthy)
113 (Very Unhealthy)
141 (Very Unhealthy)
189 (Very bad Hazardous)
164 (Very bad Hazardous)
176 (Very bad Hazardous)
123 (Very Unhealthy)
so2
13 (Good)
14 (Good)
21 (Good)
30 (Good)
39 (Good)
37 (Good)
28 (Good)
16 (Good)
15 (Good)
11 (Good)
10 (Good)
15 (Good)
17 (Good)
19 (Good)
24 (Good)
42 (Good)
70 (Moderate)
47 (Good)
35 (Good)
15 (Good)
data source »
坞城
Friday, May 27, 2022, 3:00 PM
PM2,5 61 (Unhealthy)
particulate matter (PM2.5) dust
NO2 22 (Good)
nitrogen dioxide (NO2)
PM10 69 (Unhealthy for Sensitive Groups)
particulate matter (PM10) suspended dust
CO 219 (Good)
carbon monoxide (CO)
O3 0.05 (Good)
ozone (O3)
SO2 7.7 (Good)
sulfur dioxide (SO2)
坞城
index
2022-05-27
pm25
28
no2
22
pm10
35
co
579
o3
22
so2
4.6
坞城
2018-10 2020-05
index
2020-05
2020-04
2020-03
2020-02
2020-01
2019-12
2019-11
2019-10
2019-09
2019-08
2019-07
2019-06
2019-05
2019-04
2019-03
2019-02
2019-01
2018-12
2018-11
2018-10
pm25
45
49
46
76
119
69
68
50
32
27
35
37
42
56
49
87
106
65
79
53
co
822
732
702
1
1
1
1
1
999
897
842
905
720
892
992
1
1
1
1
794
no2
36
50
38
38
57
55
58
52
52
37
33
36
46
48
46
50
75
54
63
51
o3
157
133
109
93
68
53
54
95
138
153
201
211
159
125
114
92
48
49
70
95
pm10
102
113
99
109
159
116
133
116
74
56
64
74
126
130
113
141
189
164
176
123
so2
13
14
21
30
39
37
28
16
15
11
10
15
17
19
24
42
70
47
35
15
* Pollution data source:
https://openaq.org
(ChinaAQIData)
The data is licensed under CC-By 4.0
PM2,5 61 (Unhealthy)
NO2 22 (Good)
PM10 69 (Unhealthy for Sensitive Groups)
CO 219 (Good)
O3 0 (Good)
SO2 8 (Good)
Data on air pollution from recent days in Qinxian
| index | 2022-05-27 |
|---|---|
| pm25 | 28 Moderate |
| no2 | 22 Good |
| pm10 | 35 Moderate |
| co | 579 Good |
| o3 | 22 Good |
| so2 | 5 Good |

| index | 2020-05 | 2020-04 | 2020-03 | 2020-02 | 2020-01 | 2019-12 | 2019-11 | 2019-10 | 2019-09 | 2019-08 | 2019-07 | 2019-06 | 2019-05 | 2019-04 | 2019-03 | 2019-02 | 2019-01 | 2018-12 | 2018-11 | 2018-10 |
|---|---|---|---|---|---|---|---|---|---|---|---|---|---|---|---|---|---|---|---|---|
| pm25 | 45 (Unhealthy for Sensitive Groups) | 49 (Unhealthy for Sensitive Groups) | 46 (Unhealthy for Sensitive Groups) | 76 (Very Unhealthy) | 119 (Very bad Hazardous) | 69 (Unhealthy) | 68 (Unhealthy) | 50 (Unhealthy for Sensitive Groups) | 32 (Moderate) | 27 (Moderate) | 35 (Moderate) | 37 (Unhealthy for Sensitive Groups) | 42 (Unhealthy for Sensitive Groups) | 56 (Unhealthy) | 49 (Unhealthy for Sensitive Groups) | 87 (Very Unhealthy) | 106 (Very Unhealthy) | 65 (Unhealthy) | 79 (Very Unhealthy) | 53 (Unhealthy for Sensitive Groups) |
| co | 822 (Good) | 732 (Good) | 702 (Good) | 1 (Good) | 1 (Good) | 1 (Good) | 1 (Good) | 1 (Good) | 999 (Good) | 897 (Good) | 842 (Good) | 905 (Good) | 720 (Good) | 892 (Good) | 992 (Good) | 1 (Good) | 1 (Good) | 1 (Good) | 1 (Good) | 794 (Good) |
| no2 | 36 (Good) | 50 (Moderate) | 38 (Good) | 38 (Good) | 57 (Moderate) | 55 (Moderate) | 58 (Moderate) | 52 (Moderate) | 52 (Moderate) | 37 (Good) | 33 (Good) | 36 (Good) | 46 (Moderate) | 48 (Moderate) | 46 (Moderate) | 50 (Moderate) | 75 (Moderate) | 54 (Moderate) | 63 (Moderate) | 51 (Moderate) |
| o3 | 157 (Unhealthy) | 133 (Unhealthy for Sensitive Groups) | 109 (Moderate) | 93 (Moderate) | 68 (Good) | 53 (Good) | 54 (Good) | 95 (Moderate) | 138 (Unhealthy for Sensitive Groups) | 153 (Unhealthy) | 201 (Very Unhealthy) | 211 (Very Unhealthy) | 159 (Unhealthy) | 125 (Unhealthy for Sensitive Groups) | 114 (Moderate) | 92 (Moderate) | 48 (Good) | 49 (Good) | 70 (Good) | 95 (Moderate) |
| pm10 | 102 (Unhealthy) | 113 (Very Unhealthy) | 99 (Unhealthy) | 109 (Unhealthy) | 159 (Very bad Hazardous) | 116 (Very Unhealthy) | 133 (Very Unhealthy) | 116 (Very Unhealthy) | 74 (Unhealthy for Sensitive Groups) | 56 (Unhealthy for Sensitive Groups) | 64 (Unhealthy for Sensitive Groups) | 74 (Unhealthy for Sensitive Groups) | 126 (Very Unhealthy) | 130 (Very Unhealthy) | 113 (Very Unhealthy) | 141 (Very Unhealthy) | 189 (Very bad Hazardous) | 164 (Very bad Hazardous) | 176 (Very bad Hazardous) | 123 (Very Unhealthy) |
| so2 | 13 (Good) | 14 (Good) | 21 (Good) | 30 (Good) | 39 (Good) | 37 (Good) | 28 (Good) | 16 (Good) | 15 (Good) | 11 (Good) | 10 (Good) | 15 (Good) | 17 (Good) | 19 (Good) | 24 (Good) | 42 (Good) | 70 (Moderate) | 47 (Good) | 35 (Good) | 15 (Good) |
PM2,5 61 (Unhealthy)
particulate matter (PM2.5) dustNO2 22 (Good)
nitrogen dioxide (NO2)PM10 69 (Unhealthy for Sensitive Groups)
particulate matter (PM10) suspended dustCO 219 (Good)
carbon monoxide (CO)O3 0.05 (Good)
ozone (O3)SO2 7.7 (Good)
sulfur dioxide (SO2)坞城
| index | 2022-05-27 |
|---|---|
| pm25 | 28 |
| no2 | 22 |
| pm10 | 35 |
| co | 579 |
| o3 | 22 |
| so2 | 4.6 |
坞城

| index | 2020-05 | 2020-04 | 2020-03 | 2020-02 | 2020-01 | 2019-12 | 2019-11 | 2019-10 | 2019-09 | 2019-08 | 2019-07 | 2019-06 | 2019-05 | 2019-04 | 2019-03 | 2019-02 | 2019-01 | 2018-12 | 2018-11 | 2018-10 |
|---|---|---|---|---|---|---|---|---|---|---|---|---|---|---|---|---|---|---|---|---|
| pm25 | 45 | 49 | 46 | 76 | 119 | 69 | 68 | 50 | 32 | 27 | 35 | 37 | 42 | 56 | 49 | 87 | 106 | 65 | 79 | 53 |
| co | 822 | 732 | 702 | 1 | 1 | 1 | 1 | 1 | 999 | 897 | 842 | 905 | 720 | 892 | 992 | 1 | 1 | 1 | 1 | 794 |
| no2 | 36 | 50 | 38 | 38 | 57 | 55 | 58 | 52 | 52 | 37 | 33 | 36 | 46 | 48 | 46 | 50 | 75 | 54 | 63 | 51 |
| o3 | 157 | 133 | 109 | 93 | 68 | 53 | 54 | 95 | 138 | 153 | 201 | 211 | 159 | 125 | 114 | 92 | 48 | 49 | 70 | 95 |
| pm10 | 102 | 113 | 99 | 109 | 159 | 116 | 133 | 116 | 74 | 56 | 64 | 74 | 126 | 130 | 113 | 141 | 189 | 164 | 176 | 123 |
| so2 | 13 | 14 | 21 | 30 | 39 | 37 | 28 | 16 | 15 | 11 | 10 | 15 | 17 | 19 | 24 | 42 | 70 | 47 | 35 | 15 |