Air Pollution in Fulilu: Real-time Air Quality Index and smog alert.
Pollution and air quality forecast for Fulilu. Today is Tuesday, June 2, 2026. The following air pollution values have been recorded for Fulilu:- particulate matter (PM10) suspended dust - 7 (Good)
- particulate matter (PM2.5) dust - 2 (Good)
- carbon monoxide (CO) - 100 (Good)
- nitrogen dioxide (NO2) - 8 (Good)
- ozone (O3) - 0 (Good)
- sulfur dioxide (SO2) - 9 (Good)

What is the air quality in Fulilu today? Is the air polluted in Fulilu?. Is there smog?
What is the level of PM10 today in Fulilu? (particulate matter (PM10) suspended dust)
The current level of particulate matter PM10 in Fulilu is:
7 (Good)
The highest PM10 values usually occur in month: 187 (November 2018).
The lowest value of particulate matter PM10 pollution in Fulilu is usually recorded in: August (47).
What is the current level of PM2.5 in Fulilu? (particulate matter (PM2.5) dust)
Today's PM2.5 level is:
2 (Good)
For comparison, the highest level of PM2.5 in Fulilu in the last 7 days was: 24 (Friday, May 27, 2022) and the lowest: 24 (Friday, May 27, 2022).
The highest PM2.5 values were recorded: 78 (December 2019).
The lowest level of particulate matter PM2.5 pollution occurs in month: July (23).
How high is the CO level? (carbon monoxide (CO))
100 (Good)
How high is the level of NO2? (nitrogen dioxide (NO2))
8 (Good)
How is the O3 level today in Fulilu? (ozone (O3))
0 (Good)
What is the level of SO2 pollution? (sulfur dioxide (SO2))
9 (Good)
Current data Friday, May 27, 2022, 12:00 PM
PM10 7 (Good)
PM2,5 2 (Good)
CO 100 (Good)
NO2 8 (Good)
O3 0 (Good)
SO2 9 (Good)
Data on air pollution from recent days in Fulilu
index
2022-05-27
pm10
32
Moderate
pm25
24
Moderate
co
468
Good
no2
21
Good
o3
32
Good
so2
5
Good
data source »
Air pollution in Fulilu from October 2018 to May 2020

index
2020-05
2020-04
2020-03
2020-02
2020-01
2019-12
2019-11
2019-10
2019-09
2019-08
2019-07
2019-06
2019-05
2019-04
2019-03
2019-02
2019-01
2018-12
2018-11
2018-10
pm25
39 (Unhealthy for Sensitive Groups)
43 (Unhealthy for Sensitive Groups)
46 (Unhealthy for Sensitive Groups)
50 (Unhealthy for Sensitive Groups)
73 (Unhealthy)
78 (Very Unhealthy)
58 (Unhealthy)
42 (Unhealthy for Sensitive Groups)
31 (Moderate)
25 (Moderate)
23 (Moderate)
24 (Moderate)
47 (Unhealthy for Sensitive Groups)
41 (Unhealthy for Sensitive Groups)
47 (Unhealthy for Sensitive Groups)
49 (Unhealthy for Sensitive Groups)
66 (Unhealthy)
73 (Unhealthy)
74 (Unhealthy)
48 (Unhealthy for Sensitive Groups)
co
738 (Good)
704 (Good)
765 (Good)
967 (Good)
1 (Good)
1 (Good)
1 (Good)
835 (Good)
610 (Good)
519 (Good)
481 (Good)
487 (Good)
525 (Good)
604 (Good)
796 (Good)
946 (Good)
1 (Good)
1 (Good)
1 (Good)
976 (Good)
no2
43 (Moderate)
44 (Moderate)
45 (Moderate)
44 (Moderate)
62 (Moderate)
60 (Moderate)
56 (Moderate)
51 (Moderate)
45 (Moderate)
38 (Good)
37 (Good)
35 (Good)
36 (Good)
46 (Moderate)
52 (Moderate)
41 (Moderate)
67 (Moderate)
68 (Moderate)
73 (Moderate)
63 (Moderate)
o3
183 (Very Unhealthy)
166 (Unhealthy)
149 (Unhealthy for Sensitive Groups)
168 (Unhealthy)
109 (Moderate)
93 (Moderate)
90 (Moderate)
105 (Moderate)
158 (Unhealthy)
191 (Very Unhealthy)
203 (Very Unhealthy)
159 (Unhealthy)
139 (Unhealthy for Sensitive Groups)
212 (Very Unhealthy)
153 (Unhealthy)
114 (Moderate)
104 (Moderate)
77 (Moderate)
128 (Unhealthy for Sensitive Groups)
139 (Unhealthy for Sensitive Groups)
pm10
94 (Unhealthy)
100 (Unhealthy)
105 (Unhealthy)
97 (Unhealthy)
96 (Unhealthy)
120 (Very Unhealthy)
107 (Unhealthy)
80 (Unhealthy)
61 (Unhealthy for Sensitive Groups)
47 (Moderate)
52 (Unhealthy for Sensitive Groups)
49 (Moderate)
131 (Very Unhealthy)
102 (Unhealthy)
109 (Unhealthy)
99 (Unhealthy)
110 (Very Unhealthy)
150 (Very bad Hazardous)
187 (Very bad Hazardous)
105 (Unhealthy)
so2
16 (Good)
17 (Good)
16 (Good)
20 (Good)
24 (Good)
43 (Good)
24 (Good)
18 (Good)
14 (Good)
10 (Good)
9.6 (Good)
11 (Good)
9.2 (Good)
18 (Good)
21 (Good)
24 (Good)
31 (Good)
33 (Good)
25 (Good)
20 (Good)
data source »
兰炼宾馆
Friday, May 27, 2022, 12:00 PM
PM10 6.7 (Good)
particulate matter (PM10) suspended dust
PM2,5 1.7 (Good)
particulate matter (PM2.5) dust
CO 100 (Good)
carbon monoxide (CO)
NO2 7.6 (Good)
nitrogen dioxide (NO2)
O3 0.02 (Good)
ozone (O3)
SO2 8.6 (Good)
sulfur dioxide (SO2)
兰炼宾馆
index
2022-05-27
pm10
32
pm25
24
co
468
no2
21
o3
32
so2
4.6
兰炼宾馆
2018-10 2020-05
index
2020-05
2020-04
2020-03
2020-02
2020-01
2019-12
2019-11
2019-10
2019-09
2019-08
2019-07
2019-06
2019-05
2019-04
2019-03
2019-02
2019-01
2018-12
2018-11
2018-10
pm25
39
43
46
50
73
78
58
42
31
25
23
24
47
41
47
49
66
73
74
48
co
738
704
765
967
1
1
1
835
610
519
481
487
525
604
796
946
1
1
1
976
no2
43
44
45
44
62
60
56
51
45
38
37
35
36
46
52
41
67
68
73
63
o3
183
166
149
168
109
93
90
105
158
191
203
159
139
212
153
114
104
77
128
139
pm10
94
100
105
97
96
120
107
80
61
47
52
49
131
102
109
99
110
150
187
105
so2
16
17
16
20
24
43
24
18
14
10
9.6
11
9.2
18
21
24
31
33
25
20
* Pollution data source:
https://openaq.org
(ChinaAQIData)
The data is licensed under CC-By 4.0
PM10 7 (Good)
PM2,5 2 (Good)
CO 100 (Good)
NO2 8 (Good)
O3 0 (Good)
SO2 9 (Good)
Data on air pollution from recent days in Fulilu
| index | 2022-05-27 |
|---|---|
| pm10 | 32 Moderate |
| pm25 | 24 Moderate |
| co | 468 Good |
| no2 | 21 Good |
| o3 | 32 Good |
| so2 | 5 Good |

| index | 2020-05 | 2020-04 | 2020-03 | 2020-02 | 2020-01 | 2019-12 | 2019-11 | 2019-10 | 2019-09 | 2019-08 | 2019-07 | 2019-06 | 2019-05 | 2019-04 | 2019-03 | 2019-02 | 2019-01 | 2018-12 | 2018-11 | 2018-10 |
|---|---|---|---|---|---|---|---|---|---|---|---|---|---|---|---|---|---|---|---|---|
| pm25 | 39 (Unhealthy for Sensitive Groups) | 43 (Unhealthy for Sensitive Groups) | 46 (Unhealthy for Sensitive Groups) | 50 (Unhealthy for Sensitive Groups) | 73 (Unhealthy) | 78 (Very Unhealthy) | 58 (Unhealthy) | 42 (Unhealthy for Sensitive Groups) | 31 (Moderate) | 25 (Moderate) | 23 (Moderate) | 24 (Moderate) | 47 (Unhealthy for Sensitive Groups) | 41 (Unhealthy for Sensitive Groups) | 47 (Unhealthy for Sensitive Groups) | 49 (Unhealthy for Sensitive Groups) | 66 (Unhealthy) | 73 (Unhealthy) | 74 (Unhealthy) | 48 (Unhealthy for Sensitive Groups) |
| co | 738 (Good) | 704 (Good) | 765 (Good) | 967 (Good) | 1 (Good) | 1 (Good) | 1 (Good) | 835 (Good) | 610 (Good) | 519 (Good) | 481 (Good) | 487 (Good) | 525 (Good) | 604 (Good) | 796 (Good) | 946 (Good) | 1 (Good) | 1 (Good) | 1 (Good) | 976 (Good) |
| no2 | 43 (Moderate) | 44 (Moderate) | 45 (Moderate) | 44 (Moderate) | 62 (Moderate) | 60 (Moderate) | 56 (Moderate) | 51 (Moderate) | 45 (Moderate) | 38 (Good) | 37 (Good) | 35 (Good) | 36 (Good) | 46 (Moderate) | 52 (Moderate) | 41 (Moderate) | 67 (Moderate) | 68 (Moderate) | 73 (Moderate) | 63 (Moderate) |
| o3 | 183 (Very Unhealthy) | 166 (Unhealthy) | 149 (Unhealthy for Sensitive Groups) | 168 (Unhealthy) | 109 (Moderate) | 93 (Moderate) | 90 (Moderate) | 105 (Moderate) | 158 (Unhealthy) | 191 (Very Unhealthy) | 203 (Very Unhealthy) | 159 (Unhealthy) | 139 (Unhealthy for Sensitive Groups) | 212 (Very Unhealthy) | 153 (Unhealthy) | 114 (Moderate) | 104 (Moderate) | 77 (Moderate) | 128 (Unhealthy for Sensitive Groups) | 139 (Unhealthy for Sensitive Groups) |
| pm10 | 94 (Unhealthy) | 100 (Unhealthy) | 105 (Unhealthy) | 97 (Unhealthy) | 96 (Unhealthy) | 120 (Very Unhealthy) | 107 (Unhealthy) | 80 (Unhealthy) | 61 (Unhealthy for Sensitive Groups) | 47 (Moderate) | 52 (Unhealthy for Sensitive Groups) | 49 (Moderate) | 131 (Very Unhealthy) | 102 (Unhealthy) | 109 (Unhealthy) | 99 (Unhealthy) | 110 (Very Unhealthy) | 150 (Very bad Hazardous) | 187 (Very bad Hazardous) | 105 (Unhealthy) |
| so2 | 16 (Good) | 17 (Good) | 16 (Good) | 20 (Good) | 24 (Good) | 43 (Good) | 24 (Good) | 18 (Good) | 14 (Good) | 10 (Good) | 9.6 (Good) | 11 (Good) | 9.2 (Good) | 18 (Good) | 21 (Good) | 24 (Good) | 31 (Good) | 33 (Good) | 25 (Good) | 20 (Good) |
PM10 6.7 (Good)
particulate matter (PM10) suspended dustPM2,5 1.7 (Good)
particulate matter (PM2.5) dustCO 100 (Good)
carbon monoxide (CO)NO2 7.6 (Good)
nitrogen dioxide (NO2)O3 0.02 (Good)
ozone (O3)SO2 8.6 (Good)
sulfur dioxide (SO2)兰炼宾馆
| index | 2022-05-27 |
|---|---|
| pm10 | 32 |
| pm25 | 24 |
| co | 468 |
| no2 | 21 |
| o3 | 32 |
| so2 | 4.6 |
兰炼宾馆

| index | 2020-05 | 2020-04 | 2020-03 | 2020-02 | 2020-01 | 2019-12 | 2019-11 | 2019-10 | 2019-09 | 2019-08 | 2019-07 | 2019-06 | 2019-05 | 2019-04 | 2019-03 | 2019-02 | 2019-01 | 2018-12 | 2018-11 | 2018-10 |
|---|---|---|---|---|---|---|---|---|---|---|---|---|---|---|---|---|---|---|---|---|
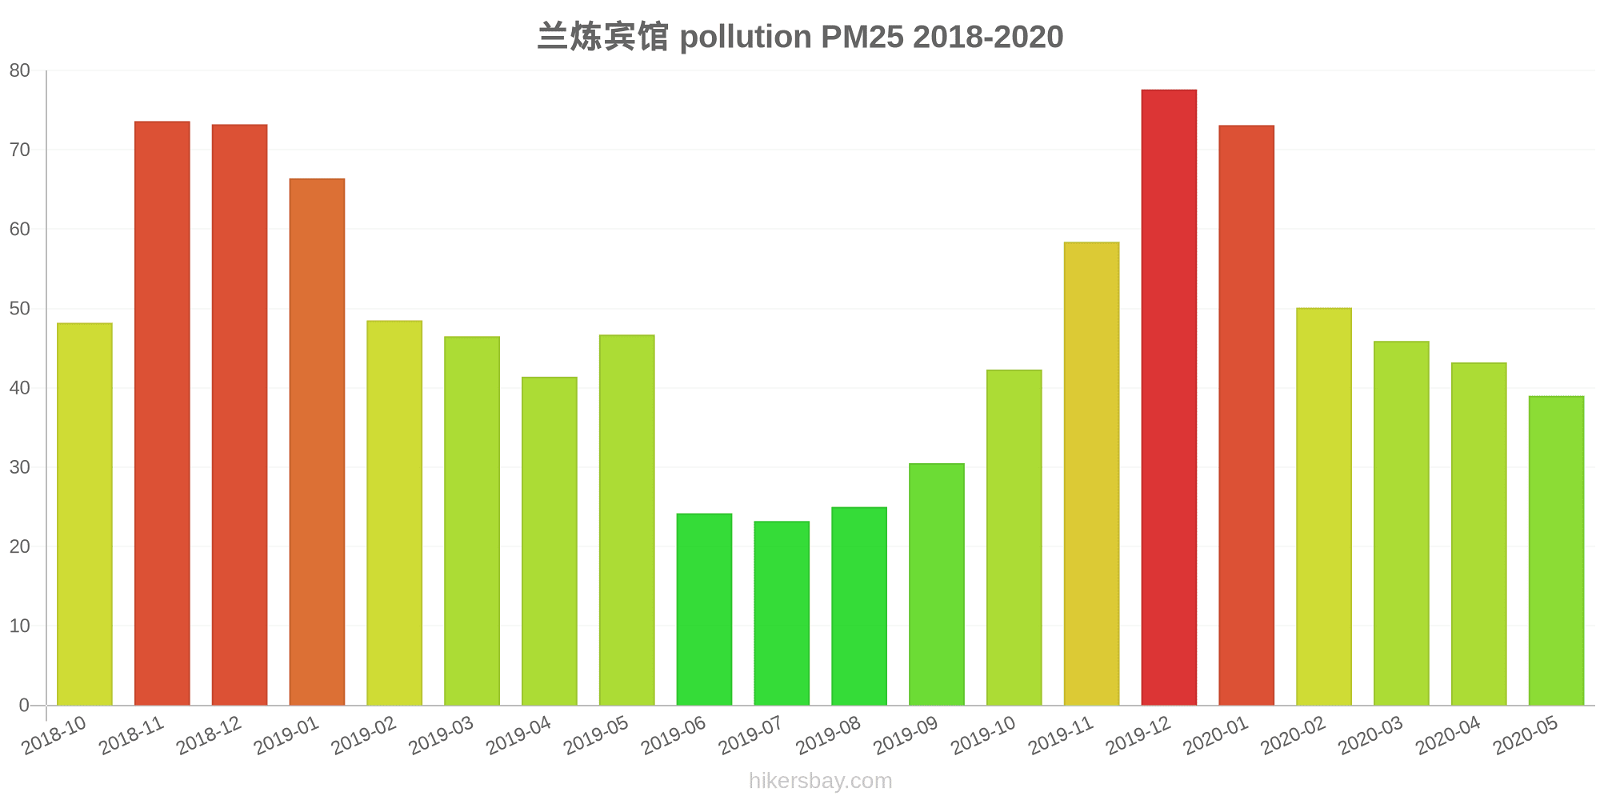
| pm25 | 39 | 43 | 46 | 50 | 73 | 78 | 58 | 42 | 31 | 25 | 23 | 24 | 47 | 41 | 47 | 49 | 66 | 73 | 74 | 48 |
| co | 738 | 704 | 765 | 967 | 1 | 1 | 1 | 835 | 610 | 519 | 481 | 487 | 525 | 604 | 796 | 946 | 1 | 1 | 1 | 976 |
| no2 | 43 | 44 | 45 | 44 | 62 | 60 | 56 | 51 | 45 | 38 | 37 | 35 | 36 | 46 | 52 | 41 | 67 | 68 | 73 | 63 |
| o3 | 183 | 166 | 149 | 168 | 109 | 93 | 90 | 105 | 158 | 191 | 203 | 159 | 139 | 212 | 153 | 114 | 104 | 77 | 128 | 139 |
| pm10 | 94 | 100 | 105 | 97 | 96 | 120 | 107 | 80 | 61 | 47 | 52 | 49 | 131 | 102 | 109 | 99 | 110 | 150 | 187 | 105 |
| so2 | 16 | 17 | 16 | 20 | 24 | 43 | 24 | 18 | 14 | 10 | 9.6 | 11 | 9.2 | 18 | 21 | 24 | 31 | 33 | 25 | 20 |