Air Pollution in Jingbiancun: Real-time Air Quality Index and smog alert.
Pollution and air quality forecast for Jingbiancun. Today is Wednesday, June 10, 2026. The following air pollution values have been recorded for Jingbiancun:- particulate matter (PM2.5) dust - 61 (Unhealthy)
- nitrogen dioxide (NO2) - 22 (Good)
- particulate matter (PM10) suspended dust - 69 (Unhealthy for Sensitive Groups)
- carbon monoxide (CO) - 219 (Good)
- ozone (O3) - 0 (Good)
- sulfur dioxide (SO2) - 8 (Good)

What is the air quality in Jingbiancun today? Is the air polluted in Jingbiancun?. Is there smog?
What is the current level of PM2.5 in Jingbiancun? (particulate matter (PM2.5) dust)
Today's PM2.5 level is:
61 (Unhealthy)
For comparison, the highest level of PM2.5 in Jingbiancun in the last 7 days was: 28 (Friday, May 27, 2022) and the lowest: 28 (Friday, May 27, 2022).
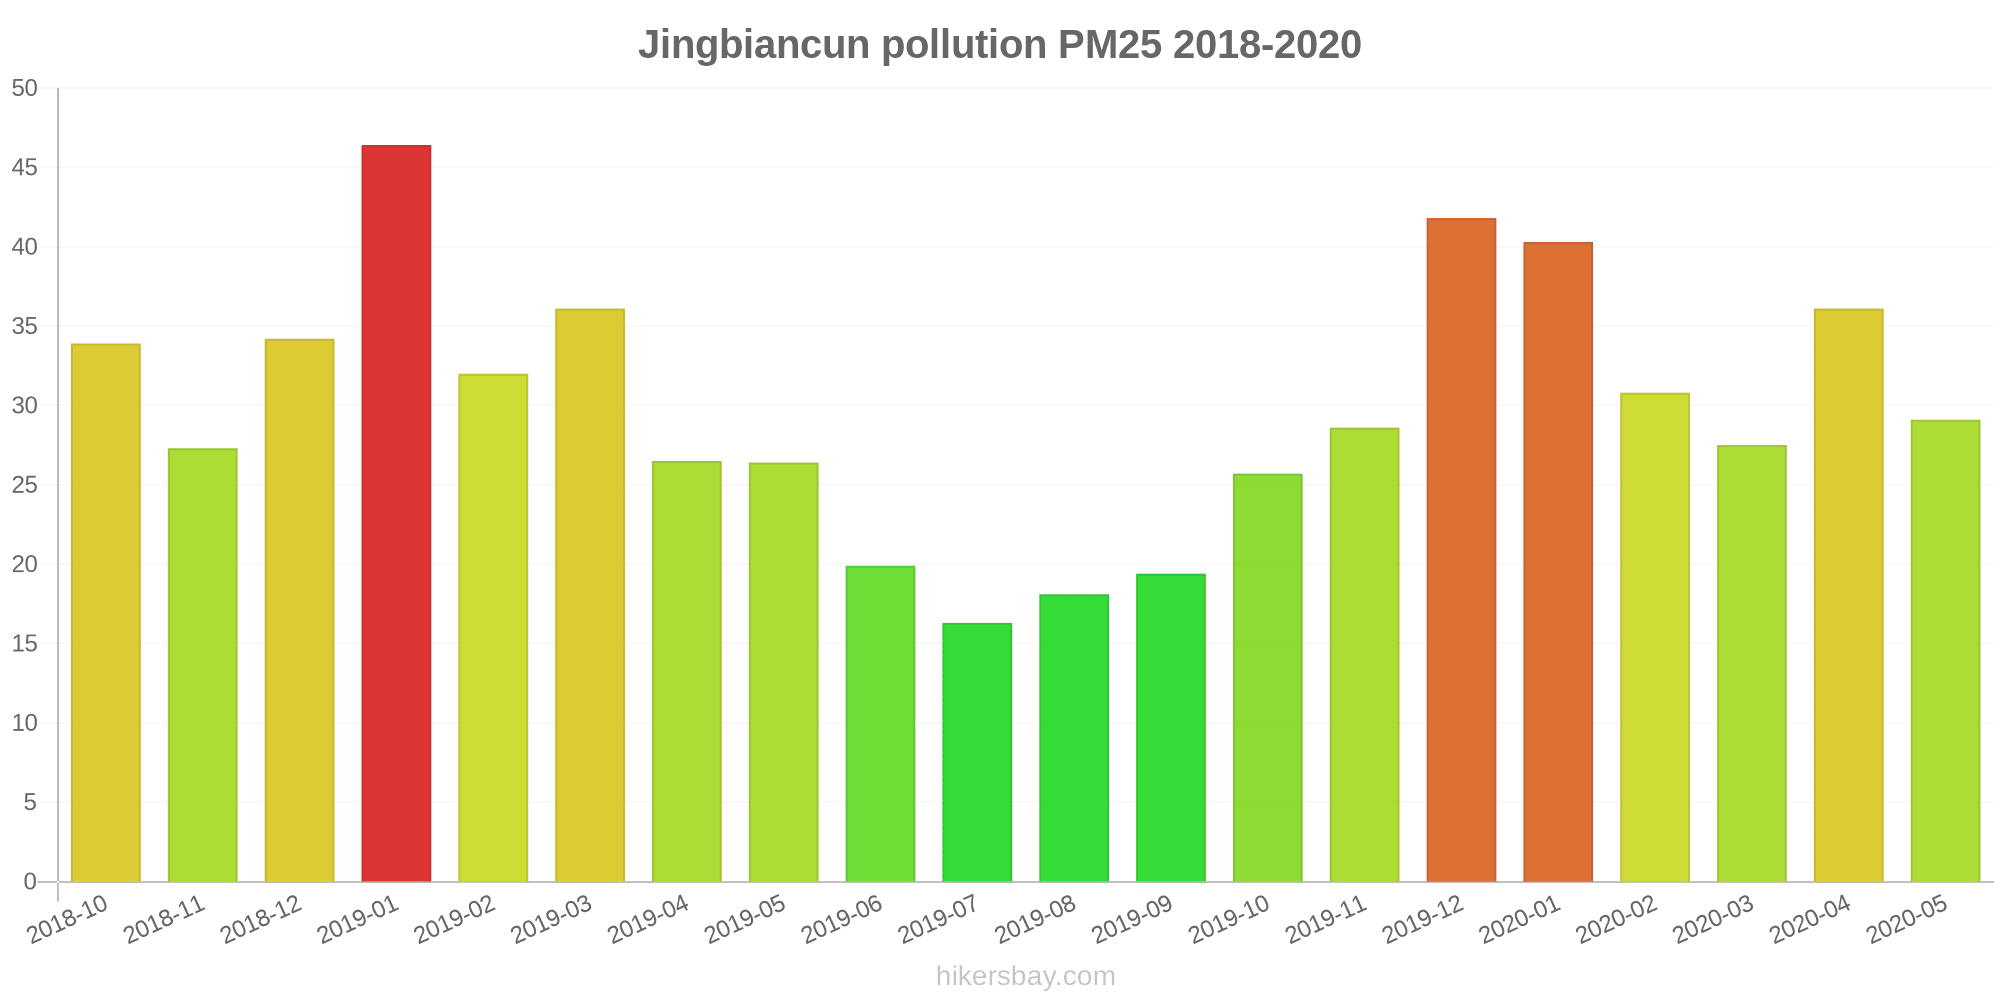
The highest PM2.5 values were recorded: 46 (January 2019).
The lowest level of particulate matter PM2.5 pollution occurs in month: July (16).
How high is the level of NO2? (nitrogen dioxide (NO2))
22 (Good)
What is the level of PM10 today in Jingbiancun? (particulate matter (PM10) suspended dust)
The current level of particulate matter PM10 in Jingbiancun is:
69 (Unhealthy for Sensitive Groups)
The highest PM10 values usually occur in month: 70 (December 2019).
The lowest value of particulate matter PM10 pollution in Jingbiancun is usually recorded in: July (30).
How high is the CO level? (carbon monoxide (CO))
219 (Good)
How is the O3 level today in Jingbiancun? (ozone (O3))
0 (Good)
What is the level of SO2 pollution? (sulfur dioxide (SO2))
8 (Good)
Current data Friday, May 27, 2022, 3:00 PM
PM2,5 61 (Unhealthy)
NO2 22 (Good)
PM10 69 (Unhealthy for Sensitive Groups)
CO 219 (Good)
O3 0 (Good)
SO2 8 (Good)
Data on air pollution from recent days in Jingbiancun
index
2022-05-27
pm25
28
Moderate
no2
22
Good
pm10
35
Moderate
co
579
Good
o3
22
Good
so2
5
Good
data source »
Air pollution in Jingbiancun from October 2018 to May 2020

index
2020-05
2020-04
2020-03
2020-02
2020-01
2019-12
2019-11
2019-10
2019-09
2019-08
2019-07
2019-06
2019-05
2019-04
2019-03
2019-02
2019-01
2018-12
2018-11
2018-10
pm25
29 (Moderate)
36 (Unhealthy for Sensitive Groups)
28 (Moderate)
31 (Moderate)
40 (Unhealthy for Sensitive Groups)
42 (Unhealthy for Sensitive Groups)
29 (Moderate)
26 (Moderate)
19 (Moderate)
18 (Moderate)
16 (Moderate)
20 (Moderate)
26 (Moderate)
27 (Moderate)
36 (Unhealthy for Sensitive Groups)
32 (Moderate)
46 (Unhealthy for Sensitive Groups)
34 (Moderate)
27 (Moderate)
34 (Moderate)
co
600 (Good)
509 (Good)
498 (Good)
506 (Good)
678 (Good)
649 (Good)
470 (Good)
515 (Good)
502 (Good)
493 (Good)
521 (Good)
524 (Good)
508 (Good)
551 (Good)
580 (Good)
676 (Good)
698 (Good)
585 (Good)
488 (Good)
524 (Good)
no2
20 (Good)
26 (Good)
23 (Good)
9.9 (Good)
26 (Good)
39 (Good)
32 (Good)
21 (Good)
15 (Good)
11 (Good)
11 (Good)
12 (Good)
20 (Good)
23 (Good)
23 (Good)
17 (Good)
34 (Good)
35 (Good)
33 (Good)
33 (Good)
o3
130 (Unhealthy for Sensitive Groups)
153 (Unhealthy)
106 (Moderate)
91 (Moderate)
70 (Good)
82 (Moderate)
103 (Moderate)
131 (Unhealthy for Sensitive Groups)
136 (Unhealthy for Sensitive Groups)
98 (Moderate)
90 (Moderate)
114 (Moderate)
152 (Unhealthy)
129 (Unhealthy for Sensitive Groups)
118 (Moderate)
79 (Moderate)
78 (Moderate)
62 (Good)
84 (Moderate)
118 (Moderate)
pm10
45 (Moderate)
65 (Unhealthy for Sensitive Groups)
47 (Moderate)
43 (Moderate)
56 (Unhealthy for Sensitive Groups)
70 (Unhealthy for Sensitive Groups)
64 (Unhealthy for Sensitive Groups)
53 (Unhealthy for Sensitive Groups)
37 (Moderate)
33 (Moderate)
30 (Moderate)
33 (Moderate)
55 (Unhealthy for Sensitive Groups)
47 (Moderate)
56 (Unhealthy for Sensitive Groups)
42 (Moderate)
69 (Unhealthy for Sensitive Groups)
58 (Unhealthy for Sensitive Groups)
48 (Moderate)
66 (Unhealthy for Sensitive Groups)
so2
2.5 (Good)
4.2 (Good)
3.6 (Good)
3.2 (Good)
4.7 (Good)
6.1 (Good)
4.9 (Good)
3.8 (Good)
3.9 (Good)
3.9 (Good)
3.8 (Good)
3.1 (Good)
4.7 (Good)
3.1 (Good)
3.9 (Good)
3.1 (Good)
5.3 (Good)
6.2 (Good)
5.8 (Good)
7.3 (Good)
data source »
台州环保大楼
Friday, May 27, 2022, 3:00 PM
PM2,5 61 (Unhealthy)
particulate matter (PM2.5) dust
NO2 22 (Good)
nitrogen dioxide (NO2)
PM10 69 (Unhealthy for Sensitive Groups)
particulate matter (PM10) suspended dust
CO 219 (Good)
carbon monoxide (CO)
O3 0.05 (Good)
ozone (O3)
SO2 7.7 (Good)
sulfur dioxide (SO2)
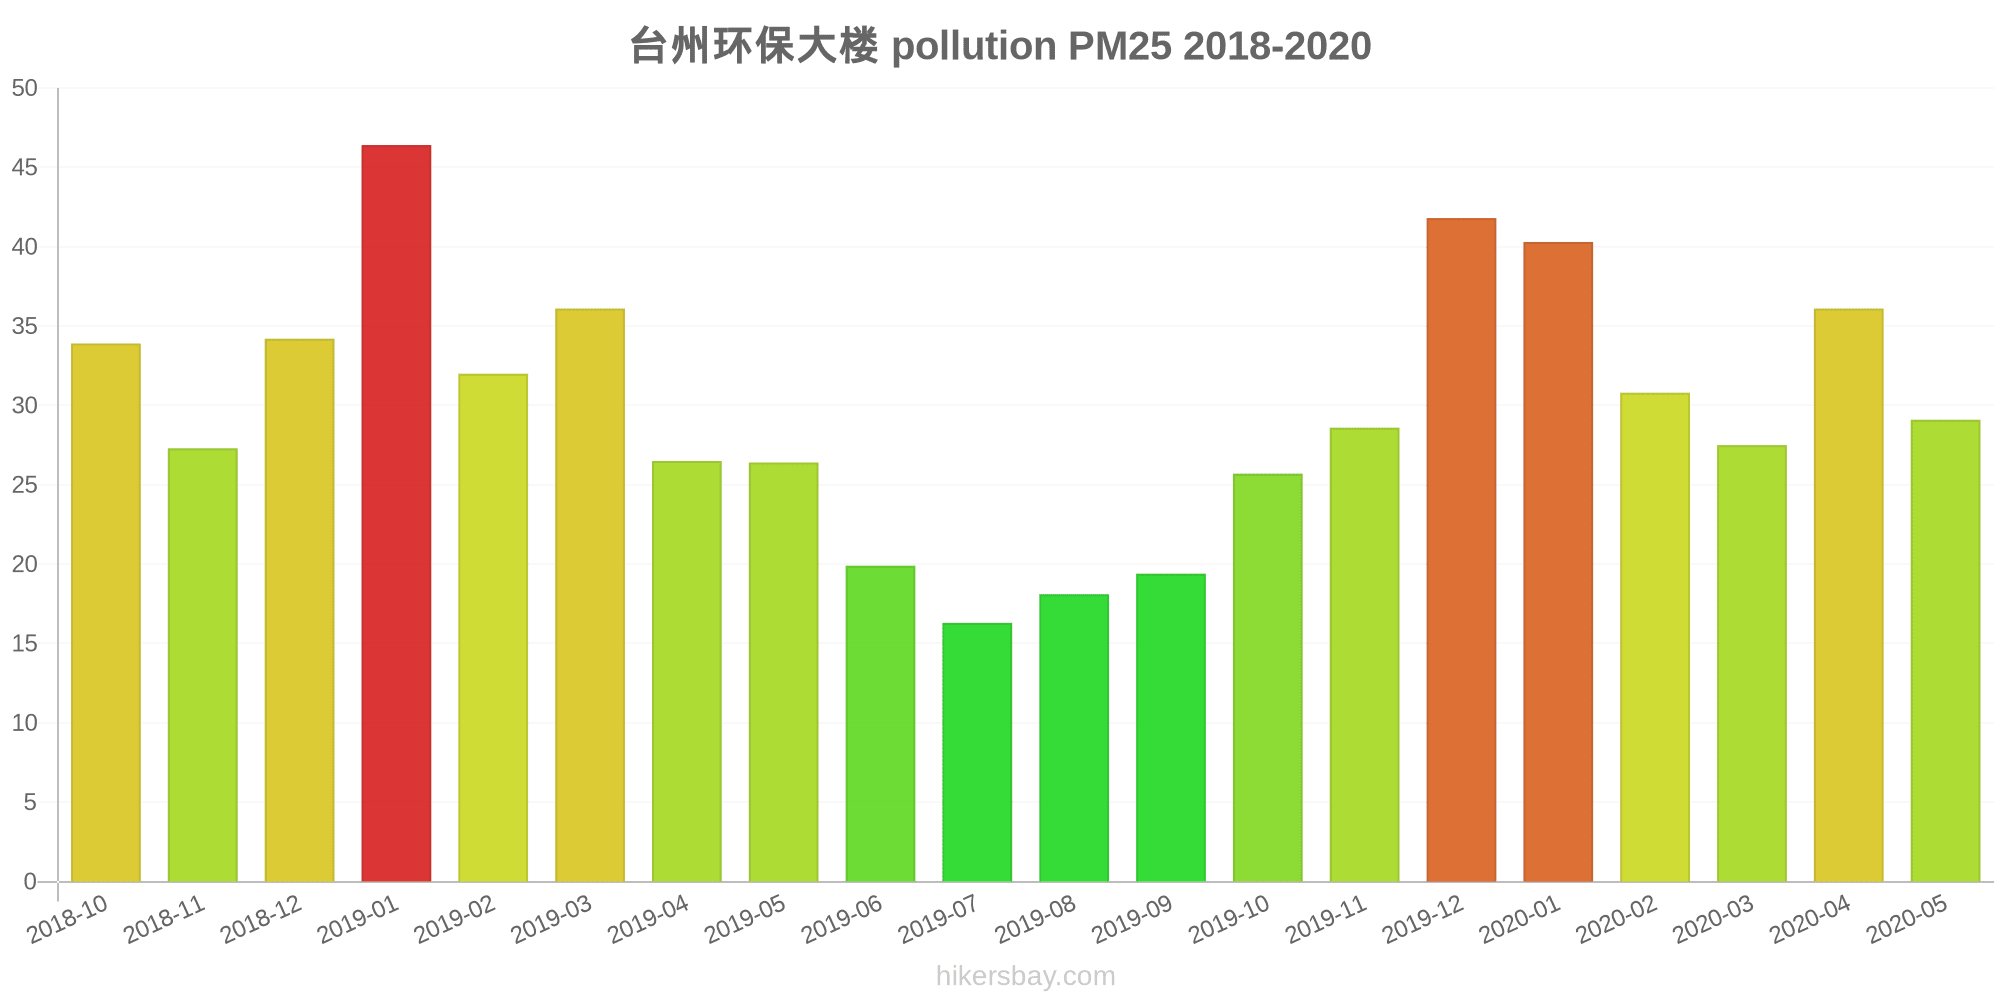
台州环保大楼
index
2022-05-27
pm25
28
no2
22
pm10
35
co
579
o3
22
so2
4.6
台州环保大楼
2018-10 2020-05

index
2020-05
2020-04
2020-03
2020-02
2020-01
2019-12
2019-11
2019-10
2019-09
2019-08
2019-07
2019-06
2019-05
2019-04
2019-03
2019-02
2019-01
2018-12
2018-11
2018-10
pm25
29
36
28
31
40
42
29
26
19
18
16
20
26
27
36
32
46
34
27
34
co
600
509
498
506
678
649
470
515
502
493
521
524
508
551
580
676
698
585
488
524
no2
20
26
23
9.9
26
39
32
21
15
11
11
12
20
23
23
17
34
35
33
33
o3
130
153
106
91
70
82
103
131
136
98
90
114
152
129
118
79
78
62
84
118
pm10
45
65
47
43
56
70
64
53
37
33
30
33
55
47
56
42
69
58
48
66
so2
2.5
4.2
3.6
3.2
4.7
6.1
4.9
3.8
3.9
3.9
3.8
3.1
4.7
3.1
3.9
3.1
5.3
6.2
5.8
7.3
* Pollution data source:
https://openaq.org
(ChinaAQIData)
The data is licensed under CC-By 4.0
PM2,5 61 (Unhealthy)
NO2 22 (Good)
PM10 69 (Unhealthy for Sensitive Groups)
CO 219 (Good)
O3 0 (Good)
SO2 8 (Good)
Data on air pollution from recent days in Jingbiancun
| index | 2022-05-27 |
|---|---|
| pm25 | 28 Moderate |
| no2 | 22 Good |
| pm10 | 35 Moderate |
| co | 579 Good |
| o3 | 22 Good |
| so2 | 5 Good |
| index | 2020-05 | 2020-04 | 2020-03 | 2020-02 | 2020-01 | 2019-12 | 2019-11 | 2019-10 | 2019-09 | 2019-08 | 2019-07 | 2019-06 | 2019-05 | 2019-04 | 2019-03 | 2019-02 | 2019-01 | 2018-12 | 2018-11 | 2018-10 |
|---|---|---|---|---|---|---|---|---|---|---|---|---|---|---|---|---|---|---|---|---|
| pm25 | 29 (Moderate) | 36 (Unhealthy for Sensitive Groups) | 28 (Moderate) | 31 (Moderate) | 40 (Unhealthy for Sensitive Groups) | 42 (Unhealthy for Sensitive Groups) | 29 (Moderate) | 26 (Moderate) | 19 (Moderate) | 18 (Moderate) | 16 (Moderate) | 20 (Moderate) | 26 (Moderate) | 27 (Moderate) | 36 (Unhealthy for Sensitive Groups) | 32 (Moderate) | 46 (Unhealthy for Sensitive Groups) | 34 (Moderate) | 27 (Moderate) | 34 (Moderate) |
| co | 600 (Good) | 509 (Good) | 498 (Good) | 506 (Good) | 678 (Good) | 649 (Good) | 470 (Good) | 515 (Good) | 502 (Good) | 493 (Good) | 521 (Good) | 524 (Good) | 508 (Good) | 551 (Good) | 580 (Good) | 676 (Good) | 698 (Good) | 585 (Good) | 488 (Good) | 524 (Good) |
| no2 | 20 (Good) | 26 (Good) | 23 (Good) | 9.9 (Good) | 26 (Good) | 39 (Good) | 32 (Good) | 21 (Good) | 15 (Good) | 11 (Good) | 11 (Good) | 12 (Good) | 20 (Good) | 23 (Good) | 23 (Good) | 17 (Good) | 34 (Good) | 35 (Good) | 33 (Good) | 33 (Good) |
| o3 | 130 (Unhealthy for Sensitive Groups) | 153 (Unhealthy) | 106 (Moderate) | 91 (Moderate) | 70 (Good) | 82 (Moderate) | 103 (Moderate) | 131 (Unhealthy for Sensitive Groups) | 136 (Unhealthy for Sensitive Groups) | 98 (Moderate) | 90 (Moderate) | 114 (Moderate) | 152 (Unhealthy) | 129 (Unhealthy for Sensitive Groups) | 118 (Moderate) | 79 (Moderate) | 78 (Moderate) | 62 (Good) | 84 (Moderate) | 118 (Moderate) |
| pm10 | 45 (Moderate) | 65 (Unhealthy for Sensitive Groups) | 47 (Moderate) | 43 (Moderate) | 56 (Unhealthy for Sensitive Groups) | 70 (Unhealthy for Sensitive Groups) | 64 (Unhealthy for Sensitive Groups) | 53 (Unhealthy for Sensitive Groups) | 37 (Moderate) | 33 (Moderate) | 30 (Moderate) | 33 (Moderate) | 55 (Unhealthy for Sensitive Groups) | 47 (Moderate) | 56 (Unhealthy for Sensitive Groups) | 42 (Moderate) | 69 (Unhealthy for Sensitive Groups) | 58 (Unhealthy for Sensitive Groups) | 48 (Moderate) | 66 (Unhealthy for Sensitive Groups) |
| so2 | 2.5 (Good) | 4.2 (Good) | 3.6 (Good) | 3.2 (Good) | 4.7 (Good) | 6.1 (Good) | 4.9 (Good) | 3.8 (Good) | 3.9 (Good) | 3.9 (Good) | 3.8 (Good) | 3.1 (Good) | 4.7 (Good) | 3.1 (Good) | 3.9 (Good) | 3.1 (Good) | 5.3 (Good) | 6.2 (Good) | 5.8 (Good) | 7.3 (Good) |
PM2,5 61 (Unhealthy)
particulate matter (PM2.5) dustNO2 22 (Good)
nitrogen dioxide (NO2)PM10 69 (Unhealthy for Sensitive Groups)
particulate matter (PM10) suspended dustCO 219 (Good)
carbon monoxide (CO)O3 0.05 (Good)
ozone (O3)SO2 7.7 (Good)
sulfur dioxide (SO2)台州环保大楼
| index | 2022-05-27 |
|---|---|
| pm25 | 28 |
| no2 | 22 |
| pm10 | 35 |
| co | 579 |
| o3 | 22 |
| so2 | 4.6 |
台州环保大楼
| index | 2020-05 | 2020-04 | 2020-03 | 2020-02 | 2020-01 | 2019-12 | 2019-11 | 2019-10 | 2019-09 | 2019-08 | 2019-07 | 2019-06 | 2019-05 | 2019-04 | 2019-03 | 2019-02 | 2019-01 | 2018-12 | 2018-11 | 2018-10 |
|---|---|---|---|---|---|---|---|---|---|---|---|---|---|---|---|---|---|---|---|---|
| pm25 | 29 | 36 | 28 | 31 | 40 | 42 | 29 | 26 | 19 | 18 | 16 | 20 | 26 | 27 | 36 | 32 | 46 | 34 | 27 | 34 |
| co | 600 | 509 | 498 | 506 | 678 | 649 | 470 | 515 | 502 | 493 | 521 | 524 | 508 | 551 | 580 | 676 | 698 | 585 | 488 | 524 |
| no2 | 20 | 26 | 23 | 9.9 | 26 | 39 | 32 | 21 | 15 | 11 | 11 | 12 | 20 | 23 | 23 | 17 | 34 | 35 | 33 | 33 |
| o3 | 130 | 153 | 106 | 91 | 70 | 82 | 103 | 131 | 136 | 98 | 90 | 114 | 152 | 129 | 118 | 79 | 78 | 62 | 84 | 118 |
| pm10 | 45 | 65 | 47 | 43 | 56 | 70 | 64 | 53 | 37 | 33 | 30 | 33 | 55 | 47 | 56 | 42 | 69 | 58 | 48 | 66 |
| so2 | 2.5 | 4.2 | 3.6 | 3.2 | 4.7 | 6.1 | 4.9 | 3.8 | 3.9 | 3.9 | 3.8 | 3.1 | 4.7 | 3.1 | 3.9 | 3.1 | 5.3 | 6.2 | 5.8 | 7.3 |