Air Pollution in Eryangou: Real-time Air Quality Index and smog alert.
Pollution and air quality forecast for Eryangou. Today is Tuesday, June 2, 2026. The following air pollution values have been recorded for Eryangou:- particulate matter (PM10) suspended dust - 179 (Very bad Hazardous)
- particulate matter (PM2.5) dust - 35 (Unhealthy for Sensitive Groups)
- ozone (O3) - 0 (Good)
- nitrogen dioxide (NO2) - 0 (Good)
- sulfur dioxide (SO2) - 0 (Good)

What is the air quality in Eryangou today? Is the air polluted in Eryangou?. Is there smog?
What is the level of PM10 today in Eryangou? (particulate matter (PM10) suspended dust)
The current level of particulate matter PM10 in Eryangou is:
179 (Very bad Hazardous)
The highest PM10 values usually occur in month: 130 (January 2019).
The lowest value of particulate matter PM10 pollution in Eryangou is usually recorded in: July (33).
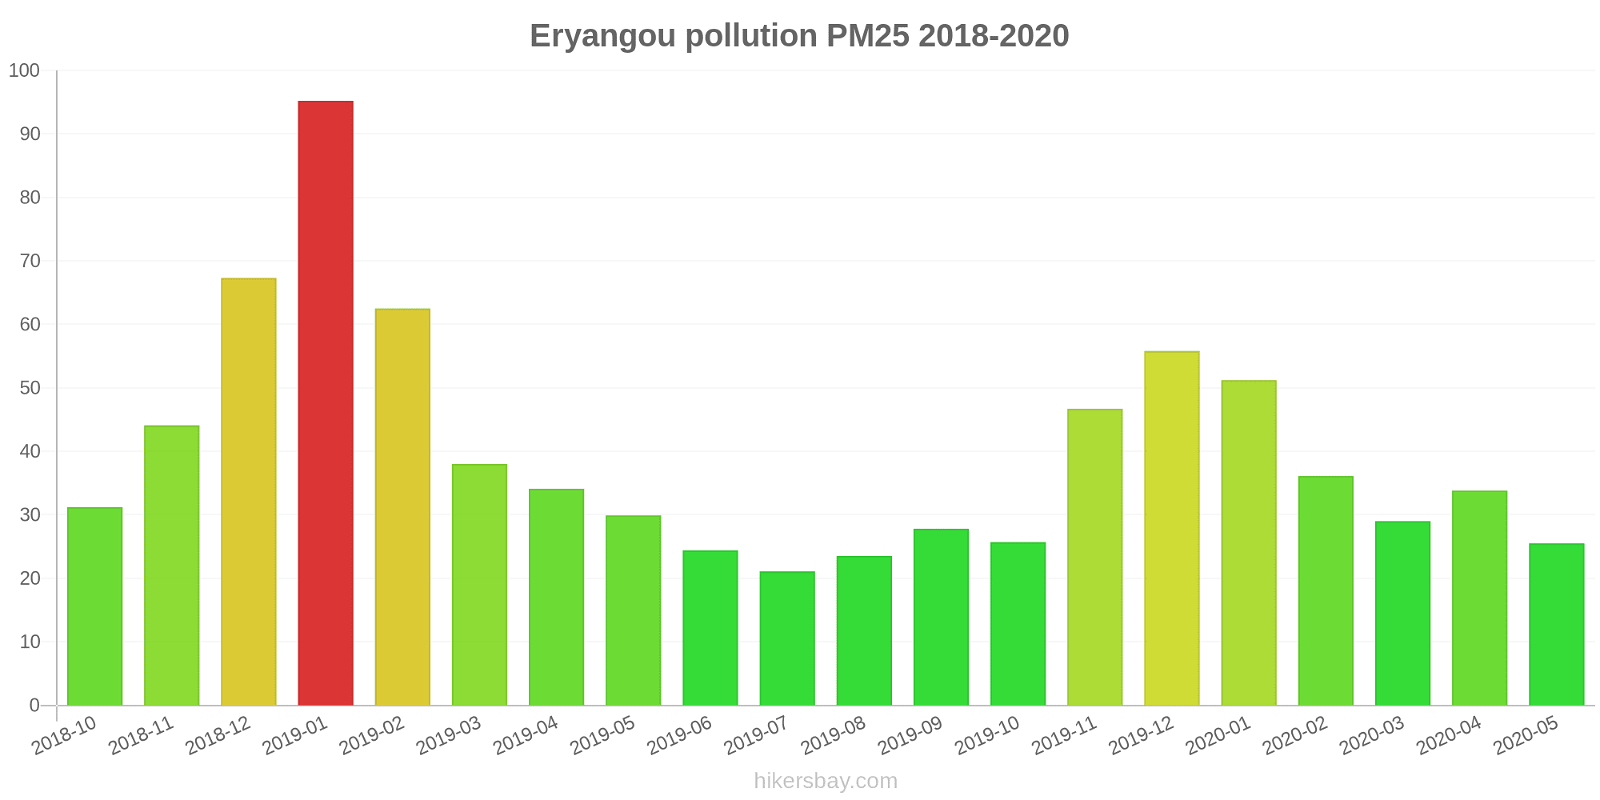
What is the current level of PM2.5 in Eryangou? (particulate matter (PM2.5) dust)
Today's PM2.5 level is:
35 (Unhealthy for Sensitive Groups)
For comparison, the highest level of PM2.5 in Eryangou in the last 7 days was: 56 (Friday, May 27, 2022) and the lowest: 56 (Friday, May 27, 2022).
The highest PM2.5 values were recorded: 95 (January 2019).
The lowest level of particulate matter PM2.5 pollution occurs in month: July (21).
How is the O3 level today in Eryangou? (ozone (O3))
0 (Good)
How high is the level of NO2? (nitrogen dioxide (NO2))
0 (Good)
What is the level of SO2 pollution? (sulfur dioxide (SO2))
0 (Good)
Current data Friday, May 27, 2022, 12:00 PM
PM10 179 (Very bad Hazardous)
PM2,5 35 (Unhealthy for Sensitive Groups)
O3 0 (Good)
NO2 0 (Good)
SO2 0 (Good)
Data on air pollution from recent days in Eryangou
index
2022-05-27
pm10
56
Unhealthy for Sensitive Groups
pm25
56
Unhealthy
o3
0
Good
no2
0
Good
so2
0
Good
data source »
Air pollution in Eryangou from October 2018 to May 2020
index
2020-05
2020-04
2020-03
2020-02
2020-01
2019-12
2019-11
2019-10
2019-09
2019-08
2019-07
2019-06
2019-05
2019-04
2019-03
2019-02
2019-01
2018-12
2018-11
2018-10
pm25
26 (Moderate)
34 (Moderate)
29 (Moderate)
36 (Unhealthy for Sensitive Groups)
51 (Unhealthy for Sensitive Groups)
56 (Unhealthy)
47 (Unhealthy for Sensitive Groups)
26 (Moderate)
28 (Moderate)
24 (Moderate)
21 (Moderate)
24 (Moderate)
30 (Moderate)
34 (Moderate)
38 (Unhealthy for Sensitive Groups)
63 (Unhealthy)
95 (Very Unhealthy)
67 (Unhealthy)
44 (Unhealthy for Sensitive Groups)
31 (Moderate)
co
725 (Good)
747 (Good)
1 (Good)
1 (Good)
1 (Good)
819 (Good)
867 (Good)
800 (Good)
794 (Good)
828 (Good)
759 (Good)
903 (Good)
788 (Good)
918 (Good)
794 (Good)
1 (Good)
1 (Good)
1 (Good)
923 (Good)
817 (Good)
no2
12 (Good)
18 (Good)
10 (Good)
7.8 (Good)
22 (Good)
31 (Good)
32 (Good)
19 (Good)
17 (Good)
13 (Good)
13 (Good)
15 (Good)
16 (Good)
22 (Good)
24 (Good)
26 (Good)
43 (Moderate)
33 (Good)
28 (Good)
23 (Good)
o3
127 (Unhealthy for Sensitive Groups)
113 (Moderate)
100 (Moderate)
81 (Moderate)
64 (Good)
60 (Good)
74 (Moderate)
85 (Moderate)
125 (Unhealthy for Sensitive Groups)
132 (Unhealthy for Sensitive Groups)
142 (Unhealthy for Sensitive Groups)
139 (Unhealthy for Sensitive Groups)
132 (Unhealthy for Sensitive Groups)
125 (Unhealthy for Sensitive Groups)
109 (Moderate)
77 (Moderate)
54 (Good)
48 (Good)
65 (Good)
85 (Moderate)
pm10
40 (Moderate)
53 (Unhealthy for Sensitive Groups)
56 (Unhealthy for Sensitive Groups)
52 (Unhealthy for Sensitive Groups)
73 (Unhealthy for Sensitive Groups)
79 (Unhealthy for Sensitive Groups)
74 (Unhealthy for Sensitive Groups)
42 (Moderate)
44 (Moderate)
39 (Moderate)
33 (Moderate)
37 (Moderate)
63 (Unhealthy for Sensitive Groups)
60 (Unhealthy for Sensitive Groups)
71 (Unhealthy for Sensitive Groups)
86 (Unhealthy)
130 (Very Unhealthy)
117 (Very Unhealthy)
75 (Unhealthy for Sensitive Groups)
54 (Unhealthy for Sensitive Groups)
so2
5.4 (Good)
5.9 (Good)
4.5 (Good)
2.2 (Good)
5.1 (Good)
6.4 (Good)
6.2 (Good)
6.2 (Good)
6.6 (Good)
6.2 (Good)
6.8 (Good)
7.3 (Good)
7.4 (Good)
7.1 (Good)
11 (Good)
19 (Good)
20 (Good)
18 (Good)
14 (Good)
15 (Good)
data source »
刘家沟
Friday, May 27, 2022, 12:00 PM
PM10 179 (Very bad Hazardous)
particulate matter (PM10) suspended dust
PM2,5 35 (Unhealthy for Sensitive Groups)
particulate matter (PM2.5) dust
O3 0.04 (Good)
ozone (O3)
NO2 0 (Good)
nitrogen dioxide (NO2)
SO2 0 (Good)
sulfur dioxide (SO2)
刘家沟
index
2022-05-27
pm10
56
pm25
56
o3
0.03
no2
0
so2
0
刘家沟
2018-10 2020-05
index
2020-05
2020-04
2020-03
2020-02
2020-01
2019-12
2019-11
2019-10
2019-09
2019-08
2019-07
2019-06
2019-05
2019-04
2019-03
2019-02
2019-01
2018-12
2018-11
2018-10
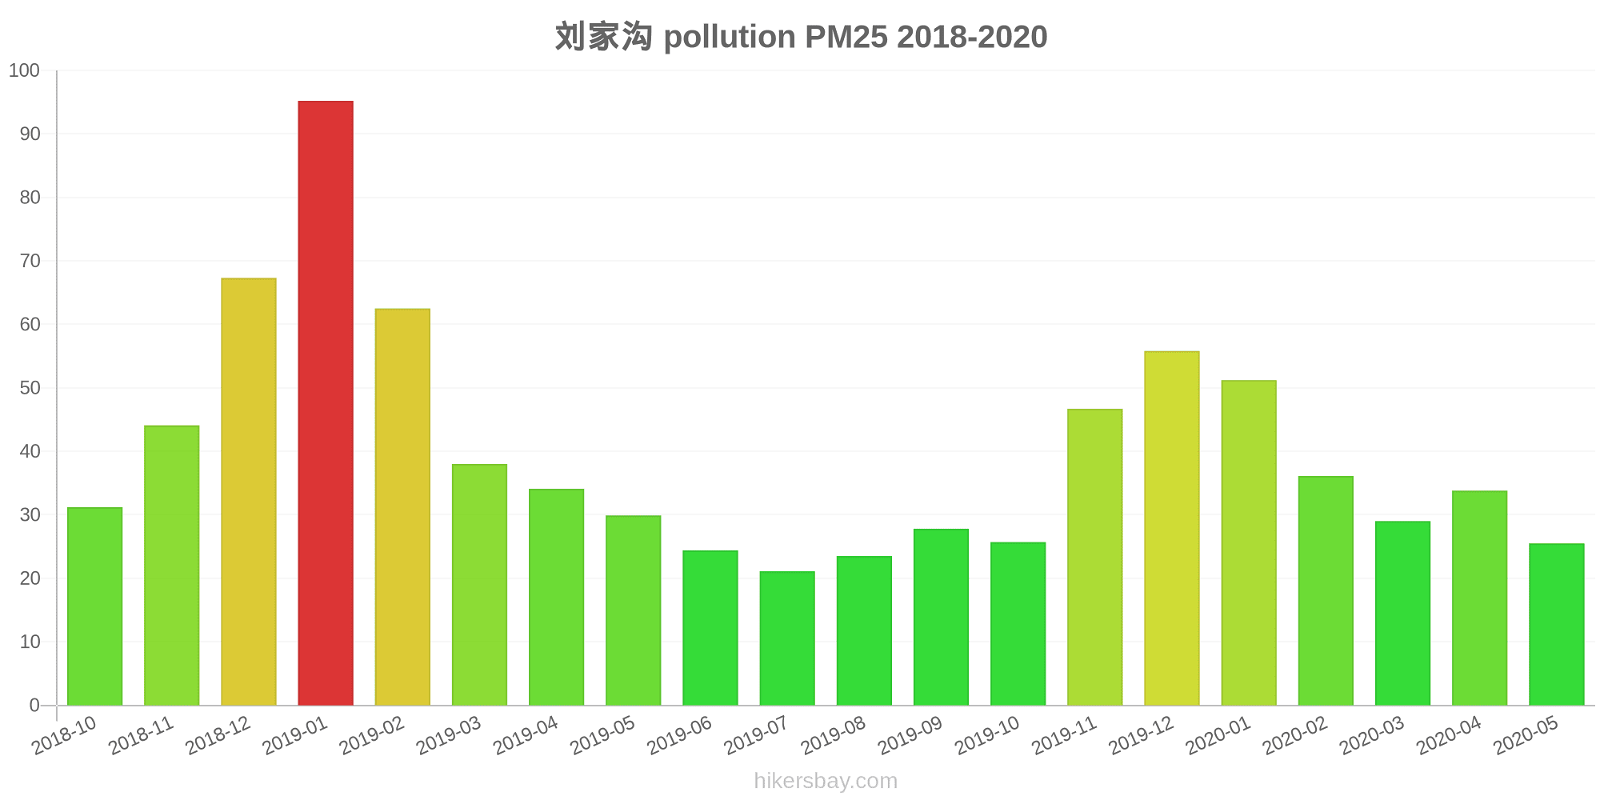
pm25
26
34
29
36
51
56
47
26
28
24
21
24
30
34
38
63
95
67
44
31
co
725
747
1
1
1
819
867
800
794
828
759
903
788
918
794
1
1
1
923
817
no2
12
18
10
7.8
22
31
32
19
17
13
13
15
16
22
24
26
43
33
28
23
o3
127
113
100
81
64
60
74
85
125
132
142
139
132
125
109
77
54
48
65
85
pm10
40
53
56
52
73
79
74
42
44
39
33
37
63
60
71
86
130
117
75
54
so2
5.4
5.9
4.5
2.2
5.1
6.4
6.2
6.2
6.6
6.2
6.8
7.3
7.4
7.1
11
19
20
18
14
15
* Pollution data source:
https://openaq.org
(ChinaAQIData)
The data is licensed under CC-By 4.0
PM10 179 (Very bad Hazardous)
PM2,5 35 (Unhealthy for Sensitive Groups)
O3 0 (Good)
NO2 0 (Good)
SO2 0 (Good)
Data on air pollution from recent days in Eryangou
| index | 2022-05-27 |
|---|---|
| pm10 | 56 Unhealthy for Sensitive Groups |
| pm25 | 56 Unhealthy |
| o3 | 0 Good |
| no2 | 0 Good |
| so2 | 0 Good |

| index | 2020-05 | 2020-04 | 2020-03 | 2020-02 | 2020-01 | 2019-12 | 2019-11 | 2019-10 | 2019-09 | 2019-08 | 2019-07 | 2019-06 | 2019-05 | 2019-04 | 2019-03 | 2019-02 | 2019-01 | 2018-12 | 2018-11 | 2018-10 |
|---|---|---|---|---|---|---|---|---|---|---|---|---|---|---|---|---|---|---|---|---|
| pm25 | 26 (Moderate) | 34 (Moderate) | 29 (Moderate) | 36 (Unhealthy for Sensitive Groups) | 51 (Unhealthy for Sensitive Groups) | 56 (Unhealthy) | 47 (Unhealthy for Sensitive Groups) | 26 (Moderate) | 28 (Moderate) | 24 (Moderate) | 21 (Moderate) | 24 (Moderate) | 30 (Moderate) | 34 (Moderate) | 38 (Unhealthy for Sensitive Groups) | 63 (Unhealthy) | 95 (Very Unhealthy) | 67 (Unhealthy) | 44 (Unhealthy for Sensitive Groups) | 31 (Moderate) |
| co | 725 (Good) | 747 (Good) | 1 (Good) | 1 (Good) | 1 (Good) | 819 (Good) | 867 (Good) | 800 (Good) | 794 (Good) | 828 (Good) | 759 (Good) | 903 (Good) | 788 (Good) | 918 (Good) | 794 (Good) | 1 (Good) | 1 (Good) | 1 (Good) | 923 (Good) | 817 (Good) |
| no2 | 12 (Good) | 18 (Good) | 10 (Good) | 7.8 (Good) | 22 (Good) | 31 (Good) | 32 (Good) | 19 (Good) | 17 (Good) | 13 (Good) | 13 (Good) | 15 (Good) | 16 (Good) | 22 (Good) | 24 (Good) | 26 (Good) | 43 (Moderate) | 33 (Good) | 28 (Good) | 23 (Good) |
| o3 | 127 (Unhealthy for Sensitive Groups) | 113 (Moderate) | 100 (Moderate) | 81 (Moderate) | 64 (Good) | 60 (Good) | 74 (Moderate) | 85 (Moderate) | 125 (Unhealthy for Sensitive Groups) | 132 (Unhealthy for Sensitive Groups) | 142 (Unhealthy for Sensitive Groups) | 139 (Unhealthy for Sensitive Groups) | 132 (Unhealthy for Sensitive Groups) | 125 (Unhealthy for Sensitive Groups) | 109 (Moderate) | 77 (Moderate) | 54 (Good) | 48 (Good) | 65 (Good) | 85 (Moderate) |
| pm10 | 40 (Moderate) | 53 (Unhealthy for Sensitive Groups) | 56 (Unhealthy for Sensitive Groups) | 52 (Unhealthy for Sensitive Groups) | 73 (Unhealthy for Sensitive Groups) | 79 (Unhealthy for Sensitive Groups) | 74 (Unhealthy for Sensitive Groups) | 42 (Moderate) | 44 (Moderate) | 39 (Moderate) | 33 (Moderate) | 37 (Moderate) | 63 (Unhealthy for Sensitive Groups) | 60 (Unhealthy for Sensitive Groups) | 71 (Unhealthy for Sensitive Groups) | 86 (Unhealthy) | 130 (Very Unhealthy) | 117 (Very Unhealthy) | 75 (Unhealthy for Sensitive Groups) | 54 (Unhealthy for Sensitive Groups) |
| so2 | 5.4 (Good) | 5.9 (Good) | 4.5 (Good) | 2.2 (Good) | 5.1 (Good) | 6.4 (Good) | 6.2 (Good) | 6.2 (Good) | 6.6 (Good) | 6.2 (Good) | 6.8 (Good) | 7.3 (Good) | 7.4 (Good) | 7.1 (Good) | 11 (Good) | 19 (Good) | 20 (Good) | 18 (Good) | 14 (Good) | 15 (Good) |
PM10 179 (Very bad Hazardous)
particulate matter (PM10) suspended dustPM2,5 35 (Unhealthy for Sensitive Groups)
particulate matter (PM2.5) dustO3 0.04 (Good)
ozone (O3)NO2 0 (Good)
nitrogen dioxide (NO2)SO2 0 (Good)
sulfur dioxide (SO2)刘家沟
| index | 2022-05-27 |
|---|---|
| pm10 | 56 |
| pm25 | 56 |
| o3 | 0.03 |
| no2 | 0 |
| so2 | 0 |
刘家沟
| index | 2020-05 | 2020-04 | 2020-03 | 2020-02 | 2020-01 | 2019-12 | 2019-11 | 2019-10 | 2019-09 | 2019-08 | 2019-07 | 2019-06 | 2019-05 | 2019-04 | 2019-03 | 2019-02 | 2019-01 | 2018-12 | 2018-11 | 2018-10 |
|---|---|---|---|---|---|---|---|---|---|---|---|---|---|---|---|---|---|---|---|---|
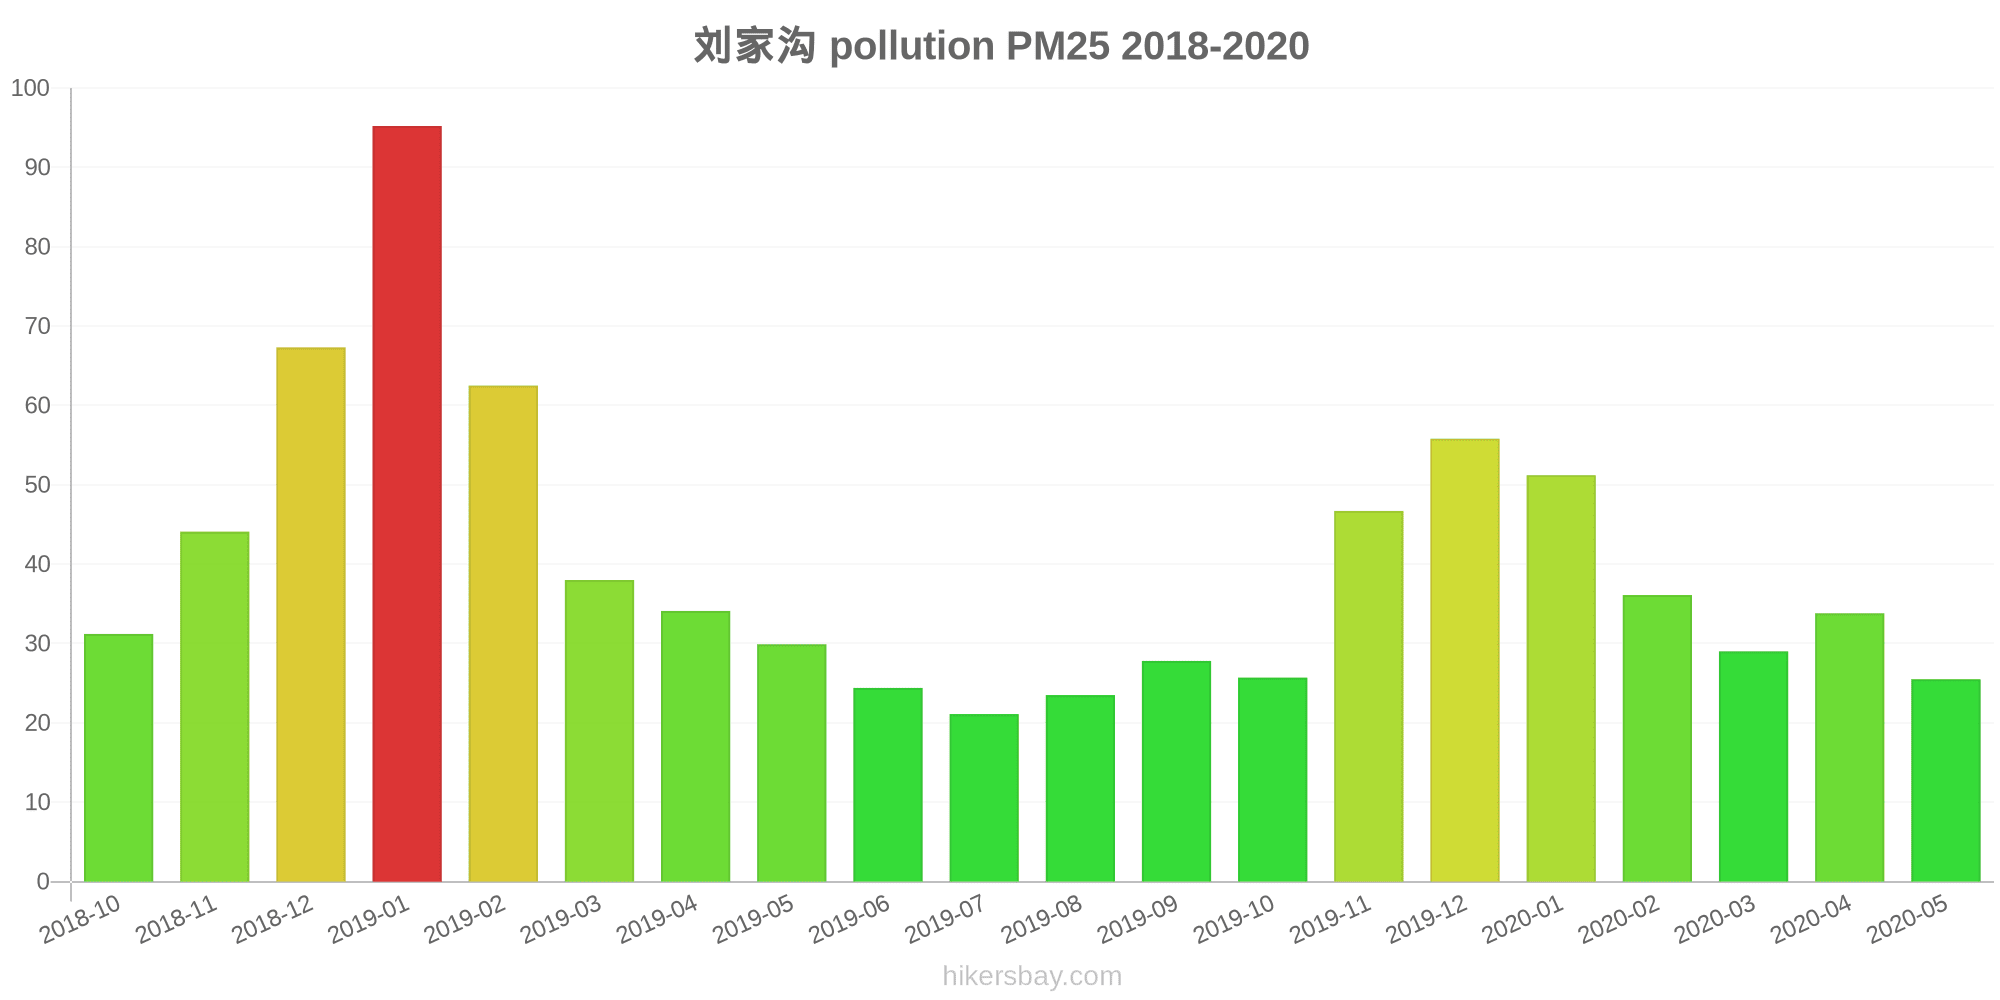
| pm25 | 26 | 34 | 29 | 36 | 51 | 56 | 47 | 26 | 28 | 24 | 21 | 24 | 30 | 34 | 38 | 63 | 95 | 67 | 44 | 31 |
| co | 725 | 747 | 1 | 1 | 1 | 819 | 867 | 800 | 794 | 828 | 759 | 903 | 788 | 918 | 794 | 1 | 1 | 1 | 923 | 817 |
| no2 | 12 | 18 | 10 | 7.8 | 22 | 31 | 32 | 19 | 17 | 13 | 13 | 15 | 16 | 22 | 24 | 26 | 43 | 33 | 28 | 23 |
| o3 | 127 | 113 | 100 | 81 | 64 | 60 | 74 | 85 | 125 | 132 | 142 | 139 | 132 | 125 | 109 | 77 | 54 | 48 | 65 | 85 |
| pm10 | 40 | 53 | 56 | 52 | 73 | 79 | 74 | 42 | 44 | 39 | 33 | 37 | 63 | 60 | 71 | 86 | 130 | 117 | 75 | 54 |
| so2 | 5.4 | 5.9 | 4.5 | 2.2 | 5.1 | 6.4 | 6.2 | 6.2 | 6.6 | 6.2 | 6.8 | 7.3 | 7.4 | 7.1 | 11 | 19 | 20 | 18 | 14 | 15 |