Air Pollution in Baoding: Real-time Air Quality Index and smog alert.
Pollution and air quality forecast for Baoding. Today is Tuesday, June 2, 2026. The following air pollution values have been recorded for Baoding:- particulate matter (PM10) suspended dust - 179 (Very bad Hazardous)
- particulate matter (PM2.5) dust - 35 (Unhealthy for Sensitive Groups)
- ozone (O3) - 0 (Good)
- nitrogen dioxide (NO2) - 0 (Good)
- sulfur dioxide (SO2) - 0 (Good)

What is the air quality in Baoding today? Is the air polluted in Baoding?. Is there smog?
What is the level of PM10 today in Baoding? (particulate matter (PM10) suspended dust)
The current level of particulate matter PM10 in Baoding is:
179 (Very bad Hazardous)
The highest PM10 values usually occur in month: 186 (January 2019).
The lowest value of particulate matter PM10 pollution in Baoding is usually recorded in: August (38).
What is the current level of PM2.5 in Baoding? (particulate matter (PM2.5) dust)
Today's PM2.5 level is:
35 (Unhealthy for Sensitive Groups)
For comparison, the highest level of PM2.5 in Baoding in the last 7 days was: 56 (Friday, May 27, 2022) and the lowest: 56 (Friday, May 27, 2022).
The highest PM2.5 values were recorded: 132 (January 2020).
The lowest level of particulate matter PM2.5 pollution occurs in month: August (24).
How is the O3 level today in Baoding? (ozone (O3))
0 (Good)
How high is the level of NO2? (nitrogen dioxide (NO2))
0 (Good)
What is the level of SO2 pollution? (sulfur dioxide (SO2))
0 (Good)
Current data Friday, May 27, 2022, 12:00 PM
PM10 179 (Very bad Hazardous)
PM2,5 35 (Unhealthy for Sensitive Groups)
O3 0 (Good)
NO2 0 (Good)
SO2 0 (Good)
Data on air pollution from recent days in Baoding
index
2022-05-27
pm10
56
Unhealthy for Sensitive Groups
pm25
56
Unhealthy
o3
0
Good
no2
0
Good
so2
0
Good
data source »
Air pollution in Baoding from October 2018 to May 2020
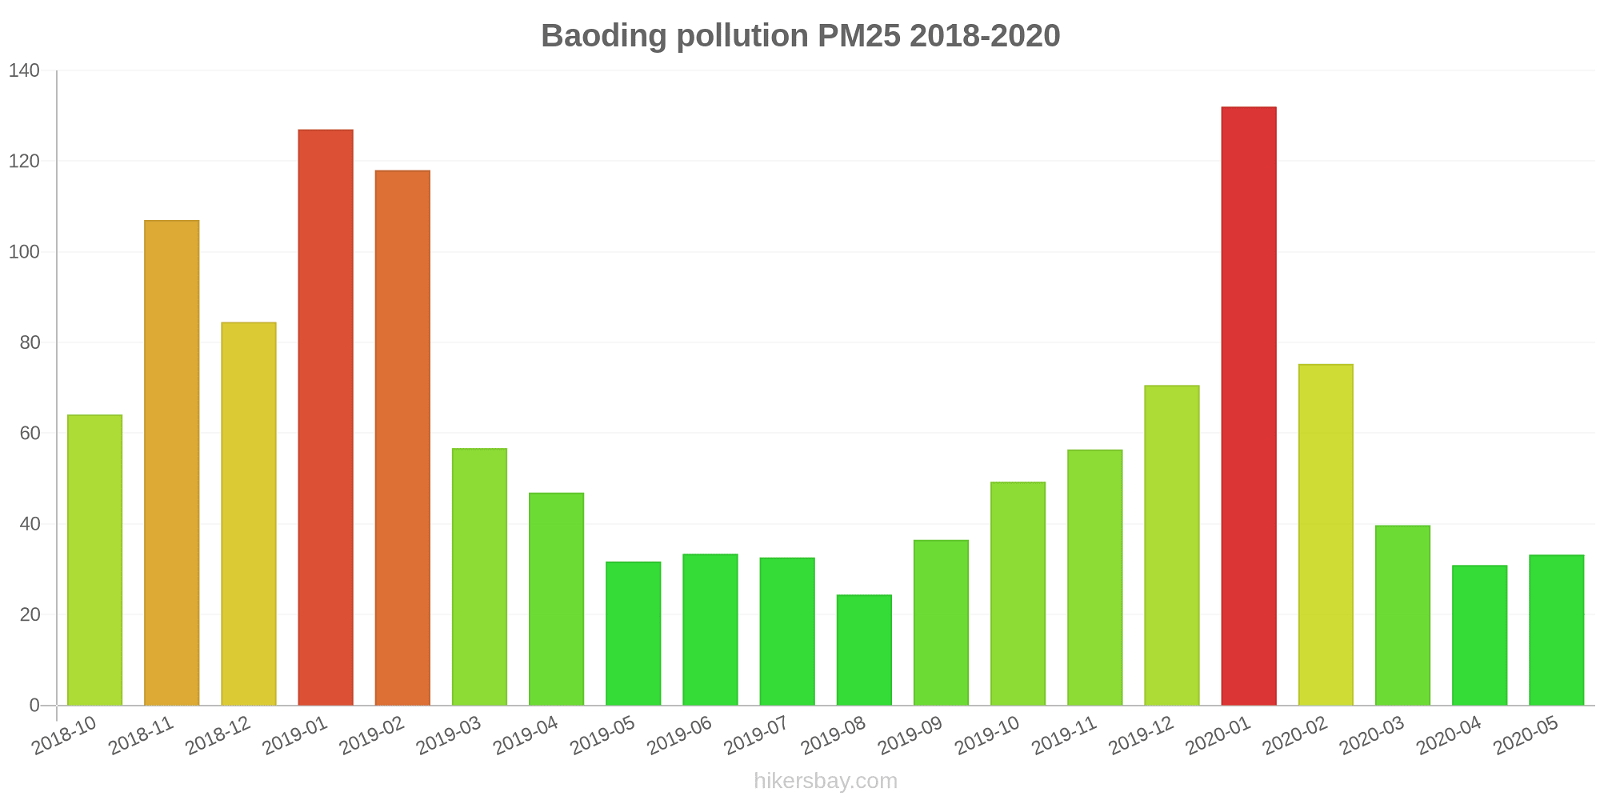
index
2020-05
2020-04
2020-03
2020-02
2020-01
2019-12
2019-11
2019-10
2019-09
2019-08
2019-07
2019-06
2019-05
2019-04
2019-03
2019-02
2019-01
2018-12
2018-11
2018-10
pm25
33 (Moderate)
31 (Moderate)
40 (Unhealthy for Sensitive Groups)
75 (Very Unhealthy)
132 (Very bad Hazardous)
71 (Unhealthy)
56 (Unhealthy)
49 (Unhealthy for Sensitive Groups)
37 (Unhealthy for Sensitive Groups)
24 (Moderate)
33 (Moderate)
33 (Moderate)
32 (Moderate)
47 (Unhealthy for Sensitive Groups)
57 (Unhealthy)
118 (Very bad Hazardous)
127 (Very bad Hazardous)
85 (Very Unhealthy)
107 (Very Unhealthy)
64 (Unhealthy)
co
657 (Good)
484 (Good)
488 (Good)
992 (Good)
1 (Good)
1 (Good)
921 (Good)
711 (Good)
645 (Good)
456 (Good)
574 (Good)
556 (Good)
418 (Good)
474 (Good)
623 (Good)
1 (Good)
2 (Good)
1 (Good)
1 (Good)
748 (Good)
no2
24 (Good)
22 (Good)
29 (Good)
26 (Good)
65 (Moderate)
59 (Moderate)
55 (Moderate)
48 (Moderate)
37 (Good)
22 (Good)
21 (Good)
27 (Good)
24 (Good)
32 (Good)
38 (Good)
50 (Moderate)
77 (Moderate)
62 (Moderate)
72 (Moderate)
63 (Moderate)
o3
139 (Unhealthy for Sensitive Groups)
134 (Unhealthy for Sensitive Groups)
100 (Moderate)
86 (Moderate)
60 (Good)
43 (Good)
53 (Good)
95 (Moderate)
187 (Very Unhealthy)
149 (Unhealthy for Sensitive Groups)
206 (Very Unhealthy)
218 (Very Unhealthy)
185 (Very Unhealthy)
132 (Unhealthy for Sensitive Groups)
117 (Moderate)
86 (Moderate)
49 (Good)
49 (Good)
60 (Good)
96 (Moderate)
pm10
63 (Unhealthy for Sensitive Groups)
62 (Unhealthy for Sensitive Groups)
68 (Unhealthy for Sensitive Groups)
96 (Unhealthy)
171 (Very bad Hazardous)
103 (Unhealthy)
98 (Unhealthy)
86 (Unhealthy)
66 (Unhealthy for Sensitive Groups)
38 (Moderate)
48 (Moderate)
59 (Unhealthy for Sensitive Groups)
71 (Unhealthy for Sensitive Groups)
90 (Unhealthy)
95 (Unhealthy)
163 (Very bad Hazardous)
186 (Very bad Hazardous)
138 (Very Unhealthy)
172 (Very bad Hazardous)
109 (Unhealthy)
so2
8.5 (Good)
11 (Good)
11 (Good)
8.6 (Good)
17 (Good)
14 (Good)
11 (Good)
8.6 (Good)
10 (Good)
10 (Good)
12 (Good)
15 (Good)
16 (Good)
13 (Good)
12 (Good)
15 (Good)
34 (Good)
27 (Good)
23 (Good)
17 (Good)
data source »
游泳馆
Friday, May 27, 2022, 12:00 PM
PM10 179 (Very bad Hazardous)
particulate matter (PM10) suspended dust
PM2,5 35 (Unhealthy for Sensitive Groups)
particulate matter (PM2.5) dust
O3 0.04 (Good)
ozone (O3)
NO2 0 (Good)
nitrogen dioxide (NO2)
SO2 0 (Good)
sulfur dioxide (SO2)
游泳馆
index
2022-05-27
pm10
56
pm25
56
o3
0.03
no2
0
so2
0
游泳馆
2018-10 2020-05

index
2020-05
2020-04
2020-03
2020-02
2020-01
2019-12
2019-11
2019-10
2019-09
2019-08
2019-07
2019-06
2019-05
2019-04
2019-03
2019-02
2019-01
2018-12
2018-11
2018-10
pm25
33
31
40
75
132
71
56
49
37
24
33
33
32
47
57
118
127
85
107
64
co
657
484
488
992
1
1
921
711
645
456
574
556
418
474
623
1
2
1
1
748
no2
24
22
29
26
65
59
55
48
37
22
21
27
24
32
38
50
77
62
72
63
o3
139
134
100
86
60
43
53
95
187
149
206
218
185
132
117
86
49
49
60
96
pm10
63
62
68
96
171
103
98
86
66
38
48
59
71
90
95
163
186
138
172
109
so2
8.5
11
11
8.6
17
14
11
8.6
10
10
12
15
16
13
12
15
34
27
23
17
* Pollution data source:
https://openaq.org
(ChinaAQIData)
The data is licensed under CC-By 4.0
PM10 179 (Very bad Hazardous)
PM2,5 35 (Unhealthy for Sensitive Groups)
O3 0 (Good)
NO2 0 (Good)
SO2 0 (Good)
Data on air pollution from recent days in Baoding
| index | 2022-05-27 |
|---|---|
| pm10 | 56 Unhealthy for Sensitive Groups |
| pm25 | 56 Unhealthy |
| o3 | 0 Good |
| no2 | 0 Good |
| so2 | 0 Good |

| index | 2020-05 | 2020-04 | 2020-03 | 2020-02 | 2020-01 | 2019-12 | 2019-11 | 2019-10 | 2019-09 | 2019-08 | 2019-07 | 2019-06 | 2019-05 | 2019-04 | 2019-03 | 2019-02 | 2019-01 | 2018-12 | 2018-11 | 2018-10 |
|---|---|---|---|---|---|---|---|---|---|---|---|---|---|---|---|---|---|---|---|---|
| pm25 | 33 (Moderate) | 31 (Moderate) | 40 (Unhealthy for Sensitive Groups) | 75 (Very Unhealthy) | 132 (Very bad Hazardous) | 71 (Unhealthy) | 56 (Unhealthy) | 49 (Unhealthy for Sensitive Groups) | 37 (Unhealthy for Sensitive Groups) | 24 (Moderate) | 33 (Moderate) | 33 (Moderate) | 32 (Moderate) | 47 (Unhealthy for Sensitive Groups) | 57 (Unhealthy) | 118 (Very bad Hazardous) | 127 (Very bad Hazardous) | 85 (Very Unhealthy) | 107 (Very Unhealthy) | 64 (Unhealthy) |
| co | 657 (Good) | 484 (Good) | 488 (Good) | 992 (Good) | 1 (Good) | 1 (Good) | 921 (Good) | 711 (Good) | 645 (Good) | 456 (Good) | 574 (Good) | 556 (Good) | 418 (Good) | 474 (Good) | 623 (Good) | 1 (Good) | 2 (Good) | 1 (Good) | 1 (Good) | 748 (Good) |
| no2 | 24 (Good) | 22 (Good) | 29 (Good) | 26 (Good) | 65 (Moderate) | 59 (Moderate) | 55 (Moderate) | 48 (Moderate) | 37 (Good) | 22 (Good) | 21 (Good) | 27 (Good) | 24 (Good) | 32 (Good) | 38 (Good) | 50 (Moderate) | 77 (Moderate) | 62 (Moderate) | 72 (Moderate) | 63 (Moderate) |
| o3 | 139 (Unhealthy for Sensitive Groups) | 134 (Unhealthy for Sensitive Groups) | 100 (Moderate) | 86 (Moderate) | 60 (Good) | 43 (Good) | 53 (Good) | 95 (Moderate) | 187 (Very Unhealthy) | 149 (Unhealthy for Sensitive Groups) | 206 (Very Unhealthy) | 218 (Very Unhealthy) | 185 (Very Unhealthy) | 132 (Unhealthy for Sensitive Groups) | 117 (Moderate) | 86 (Moderate) | 49 (Good) | 49 (Good) | 60 (Good) | 96 (Moderate) |
| pm10 | 63 (Unhealthy for Sensitive Groups) | 62 (Unhealthy for Sensitive Groups) | 68 (Unhealthy for Sensitive Groups) | 96 (Unhealthy) | 171 (Very bad Hazardous) | 103 (Unhealthy) | 98 (Unhealthy) | 86 (Unhealthy) | 66 (Unhealthy for Sensitive Groups) | 38 (Moderate) | 48 (Moderate) | 59 (Unhealthy for Sensitive Groups) | 71 (Unhealthy for Sensitive Groups) | 90 (Unhealthy) | 95 (Unhealthy) | 163 (Very bad Hazardous) | 186 (Very bad Hazardous) | 138 (Very Unhealthy) | 172 (Very bad Hazardous) | 109 (Unhealthy) |
| so2 | 8.5 (Good) | 11 (Good) | 11 (Good) | 8.6 (Good) | 17 (Good) | 14 (Good) | 11 (Good) | 8.6 (Good) | 10 (Good) | 10 (Good) | 12 (Good) | 15 (Good) | 16 (Good) | 13 (Good) | 12 (Good) | 15 (Good) | 34 (Good) | 27 (Good) | 23 (Good) | 17 (Good) |
PM10 179 (Very bad Hazardous)
particulate matter (PM10) suspended dustPM2,5 35 (Unhealthy for Sensitive Groups)
particulate matter (PM2.5) dustO3 0.04 (Good)
ozone (O3)NO2 0 (Good)
nitrogen dioxide (NO2)SO2 0 (Good)
sulfur dioxide (SO2)游泳馆
| index | 2022-05-27 |
|---|---|
| pm10 | 56 |
| pm25 | 56 |
| o3 | 0.03 |
| no2 | 0 |
| so2 | 0 |
游泳馆

| index | 2020-05 | 2020-04 | 2020-03 | 2020-02 | 2020-01 | 2019-12 | 2019-11 | 2019-10 | 2019-09 | 2019-08 | 2019-07 | 2019-06 | 2019-05 | 2019-04 | 2019-03 | 2019-02 | 2019-01 | 2018-12 | 2018-11 | 2018-10 |
|---|---|---|---|---|---|---|---|---|---|---|---|---|---|---|---|---|---|---|---|---|
| pm25 | 33 | 31 | 40 | 75 | 132 | 71 | 56 | 49 | 37 | 24 | 33 | 33 | 32 | 47 | 57 | 118 | 127 | 85 | 107 | 64 |
| co | 657 | 484 | 488 | 992 | 1 | 1 | 921 | 711 | 645 | 456 | 574 | 556 | 418 | 474 | 623 | 1 | 2 | 1 | 1 | 748 |
| no2 | 24 | 22 | 29 | 26 | 65 | 59 | 55 | 48 | 37 | 22 | 21 | 27 | 24 | 32 | 38 | 50 | 77 | 62 | 72 | 63 |
| o3 | 139 | 134 | 100 | 86 | 60 | 43 | 53 | 95 | 187 | 149 | 206 | 218 | 185 | 132 | 117 | 86 | 49 | 49 | 60 | 96 |
| pm10 | 63 | 62 | 68 | 96 | 171 | 103 | 98 | 86 | 66 | 38 | 48 | 59 | 71 | 90 | 95 | 163 | 186 | 138 | 172 | 109 |
| so2 | 8.5 | 11 | 11 | 8.6 | 17 | 14 | 11 | 8.6 | 10 | 10 | 12 | 15 | 16 | 13 | 12 | 15 | 34 | 27 | 23 | 17 |