Air Pollution in Beizhu: Real-time Air Quality Index and smog alert.
Pollution and air quality forecast for Beizhu. Today is Tuesday, June 2, 2026. The following air pollution values have been recorded for Beizhu:- particulate matter (PM10) suspended dust - 179 (Very bad Hazardous)
- particulate matter (PM2.5) dust - 35 (Unhealthy for Sensitive Groups)
- ozone (O3) - 0 (Good)
- nitrogen dioxide (NO2) - 0 (Good)
- sulfur dioxide (SO2) - 0 (Good)

What is the air quality in Beizhu today? Is the air polluted in Beizhu?. Is there smog?
What is the level of PM10 today in Beizhu? (particulate matter (PM10) suspended dust)
The current level of particulate matter PM10 in Beizhu is:
179 (Very bad Hazardous)
The highest PM10 values usually occur in month: 117 (January 2019).
The lowest value of particulate matter PM10 pollution in Beizhu is usually recorded in: February (41).
What is the current level of PM2.5 in Beizhu? (particulate matter (PM2.5) dust)
Today's PM2.5 level is:
35 (Unhealthy for Sensitive Groups)
For comparison, the highest level of PM2.5 in Beizhu in the last 7 days was: 56 (Friday, May 27, 2022) and the lowest: 56 (Friday, May 27, 2022).
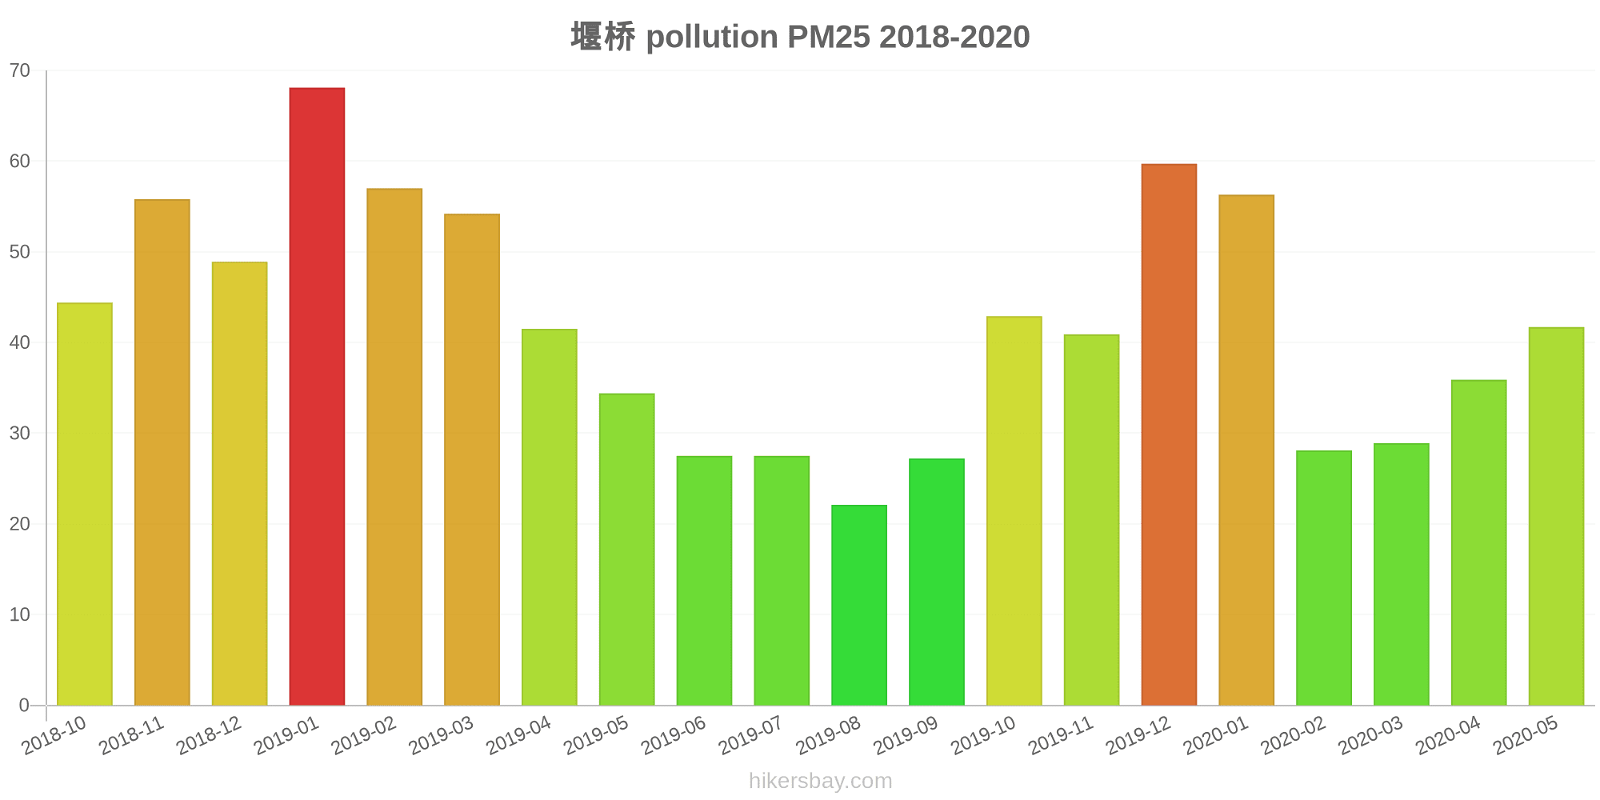
The highest PM2.5 values were recorded: 68 (January 2019).
The lowest level of particulate matter PM2.5 pollution occurs in month: August (22).
How is the O3 level today in Beizhu? (ozone (O3))
0 (Good)
How high is the level of NO2? (nitrogen dioxide (NO2))
0 (Good)
What is the level of SO2 pollution? (sulfur dioxide (SO2))
0 (Good)
Current data Friday, May 27, 2022, 12:00 PM
PM10 179 (Very bad Hazardous)
PM2,5 35 (Unhealthy for Sensitive Groups)
O3 0 (Good)
NO2 0 (Good)
SO2 0 (Good)
Data on air pollution from recent days in Beizhu
index
2022-05-27
pm10
56
Unhealthy for Sensitive Groups
pm25
56
Unhealthy
o3
0
Good
no2
0
Good
so2
0
Good
data source »
Air pollution in Beizhu from October 2018 to May 2020

index
2020-05
2020-04
2020-03
2020-02
2020-01
2019-12
2019-11
2019-10
2019-09
2019-08
2019-07
2019-06
2019-05
2019-04
2019-03
2019-02
2019-01
2018-12
2018-11
2018-10
pm25
42 (Unhealthy for Sensitive Groups)
36 (Unhealthy for Sensitive Groups)
29 (Moderate)
28 (Moderate)
56 (Unhealthy)
60 (Unhealthy)
41 (Unhealthy for Sensitive Groups)
43 (Unhealthy for Sensitive Groups)
27 (Moderate)
22 (Moderate)
28 (Moderate)
28 (Moderate)
34 (Moderate)
42 (Unhealthy for Sensitive Groups)
54 (Unhealthy for Sensitive Groups)
57 (Unhealthy)
68 (Unhealthy)
49 (Unhealthy for Sensitive Groups)
56 (Unhealthy)
44 (Unhealthy for Sensitive Groups)
co
884 (Good)
861 (Good)
749 (Good)
667 (Good)
855 (Good)
1 (Good)
946 (Good)
1 (Good)
914 (Good)
848 (Good)
780 (Good)
803 (Good)
736 (Good)
804 (Good)
884 (Good)
902 (Good)
1 (Good)
1 (Good)
1 (Good)
980 (Good)
no2
27 (Good)
44 (Moderate)
36 (Good)
22 (Good)
35 (Good)
59 (Moderate)
53 (Moderate)
44 (Moderate)
29 (Good)
26 (Good)
32 (Good)
27 (Good)
46 (Moderate)
49 (Moderate)
53 (Moderate)
32 (Good)
54 (Moderate)
49 (Moderate)
52 (Moderate)
46 (Moderate)
o3
158 (Unhealthy)
152 (Unhealthy)
110 (Moderate)
95 (Moderate)
66 (Good)
71 (Moderate)
95 (Moderate)
119 (Moderate)
146 (Unhealthy for Sensitive Groups)
165 (Unhealthy)
166 (Unhealthy)
187 (Very Unhealthy)
164 (Unhealthy)
140 (Unhealthy for Sensitive Groups)
112 (Moderate)
83 (Moderate)
65 (Good)
54 (Good)
91 (Moderate)
121 (Unhealthy for Sensitive Groups)
pm10
70 (Unhealthy for Sensitive Groups)
72 (Unhealthy for Sensitive Groups)
53 (Unhealthy for Sensitive Groups)
41 (Moderate)
74 (Unhealthy for Sensitive Groups)
95 (Unhealthy)
94 (Unhealthy)
90 (Unhealthy)
53 (Unhealthy for Sensitive Groups)
47 (Moderate)
53 (Unhealthy for Sensitive Groups)
51 (Unhealthy for Sensitive Groups)
78 (Unhealthy for Sensitive Groups)
77 (Unhealthy for Sensitive Groups)
104 (Unhealthy)
82 (Unhealthy)
117 (Very Unhealthy)
93 (Unhealthy)
105 (Unhealthy)
92 (Unhealthy)
so2
5.9 (Good)
8.5 (Good)
6.5 (Good)
6 (Good)
6.8 (Good)
8.6 (Good)
7.6 (Good)
7.4 (Good)
6 (Good)
5 (Good)
5.4 (Good)
7.4 (Good)
10 (Good)
9.7 (Good)
11 (Good)
8 (Good)
12 (Good)
13 (Good)
12 (Good)
14 (Good)
data source »
堰桥
Friday, May 27, 2022, 12:00 PM
PM10 179 (Very bad Hazardous)
particulate matter (PM10) suspended dust
PM2,5 35 (Unhealthy for Sensitive Groups)
particulate matter (PM2.5) dust
O3 0.04 (Good)
ozone (O3)
NO2 0 (Good)
nitrogen dioxide (NO2)
SO2 0 (Good)
sulfur dioxide (SO2)
堰桥
index
2022-05-27
pm10
56
pm25
56
o3
0.03
no2
0
so2
0
堰桥
2018-10 2020-05
index
2020-05
2020-04
2020-03
2020-02
2020-01
2019-12
2019-11
2019-10
2019-09
2019-08
2019-07
2019-06
2019-05
2019-04
2019-03
2019-02
2019-01
2018-12
2018-11
2018-10
pm25
42
36
29
28
56
60
41
43
27
22
28
28
34
42
54
57
68
49
56
44
co
884
861
749
667
855
1
946
1
914
848
780
803
736
804
884
902
1
1
1
980
no2
27
44
36
22
35
59
53
44
29
26
32
27
46
49
53
32
54
49
52
46
o3
158
152
110
95
66
71
95
119
146
165
166
187
164
140
112
83
65
54
91
121
pm10
70
72
53
41
74
95
94
90
53
47
53
51
78
77
104
82
117
93
105
92
so2
5.9
8.5
6.5
6
6.8
8.6
7.6
7.4
6
5
5.4
7.4
10
9.7
11
8
12
13
12
14
* Pollution data source:
https://openaq.org
(ChinaAQIData)
The data is licensed under CC-By 4.0
PM10 179 (Very bad Hazardous)
PM2,5 35 (Unhealthy for Sensitive Groups)
O3 0 (Good)
NO2 0 (Good)
SO2 0 (Good)
Data on air pollution from recent days in Beizhu
| index | 2022-05-27 |
|---|---|
| pm10 | 56 Unhealthy for Sensitive Groups |
| pm25 | 56 Unhealthy |
| o3 | 0 Good |
| no2 | 0 Good |
| so2 | 0 Good |

| index | 2020-05 | 2020-04 | 2020-03 | 2020-02 | 2020-01 | 2019-12 | 2019-11 | 2019-10 | 2019-09 | 2019-08 | 2019-07 | 2019-06 | 2019-05 | 2019-04 | 2019-03 | 2019-02 | 2019-01 | 2018-12 | 2018-11 | 2018-10 |
|---|---|---|---|---|---|---|---|---|---|---|---|---|---|---|---|---|---|---|---|---|
| pm25 | 42 (Unhealthy for Sensitive Groups) | 36 (Unhealthy for Sensitive Groups) | 29 (Moderate) | 28 (Moderate) | 56 (Unhealthy) | 60 (Unhealthy) | 41 (Unhealthy for Sensitive Groups) | 43 (Unhealthy for Sensitive Groups) | 27 (Moderate) | 22 (Moderate) | 28 (Moderate) | 28 (Moderate) | 34 (Moderate) | 42 (Unhealthy for Sensitive Groups) | 54 (Unhealthy for Sensitive Groups) | 57 (Unhealthy) | 68 (Unhealthy) | 49 (Unhealthy for Sensitive Groups) | 56 (Unhealthy) | 44 (Unhealthy for Sensitive Groups) |
| co | 884 (Good) | 861 (Good) | 749 (Good) | 667 (Good) | 855 (Good) | 1 (Good) | 946 (Good) | 1 (Good) | 914 (Good) | 848 (Good) | 780 (Good) | 803 (Good) | 736 (Good) | 804 (Good) | 884 (Good) | 902 (Good) | 1 (Good) | 1 (Good) | 1 (Good) | 980 (Good) |
| no2 | 27 (Good) | 44 (Moderate) | 36 (Good) | 22 (Good) | 35 (Good) | 59 (Moderate) | 53 (Moderate) | 44 (Moderate) | 29 (Good) | 26 (Good) | 32 (Good) | 27 (Good) | 46 (Moderate) | 49 (Moderate) | 53 (Moderate) | 32 (Good) | 54 (Moderate) | 49 (Moderate) | 52 (Moderate) | 46 (Moderate) |
| o3 | 158 (Unhealthy) | 152 (Unhealthy) | 110 (Moderate) | 95 (Moderate) | 66 (Good) | 71 (Moderate) | 95 (Moderate) | 119 (Moderate) | 146 (Unhealthy for Sensitive Groups) | 165 (Unhealthy) | 166 (Unhealthy) | 187 (Very Unhealthy) | 164 (Unhealthy) | 140 (Unhealthy for Sensitive Groups) | 112 (Moderate) | 83 (Moderate) | 65 (Good) | 54 (Good) | 91 (Moderate) | 121 (Unhealthy for Sensitive Groups) |
| pm10 | 70 (Unhealthy for Sensitive Groups) | 72 (Unhealthy for Sensitive Groups) | 53 (Unhealthy for Sensitive Groups) | 41 (Moderate) | 74 (Unhealthy for Sensitive Groups) | 95 (Unhealthy) | 94 (Unhealthy) | 90 (Unhealthy) | 53 (Unhealthy for Sensitive Groups) | 47 (Moderate) | 53 (Unhealthy for Sensitive Groups) | 51 (Unhealthy for Sensitive Groups) | 78 (Unhealthy for Sensitive Groups) | 77 (Unhealthy for Sensitive Groups) | 104 (Unhealthy) | 82 (Unhealthy) | 117 (Very Unhealthy) | 93 (Unhealthy) | 105 (Unhealthy) | 92 (Unhealthy) |
| so2 | 5.9 (Good) | 8.5 (Good) | 6.5 (Good) | 6 (Good) | 6.8 (Good) | 8.6 (Good) | 7.6 (Good) | 7.4 (Good) | 6 (Good) | 5 (Good) | 5.4 (Good) | 7.4 (Good) | 10 (Good) | 9.7 (Good) | 11 (Good) | 8 (Good) | 12 (Good) | 13 (Good) | 12 (Good) | 14 (Good) |
PM10 179 (Very bad Hazardous)
particulate matter (PM10) suspended dustPM2,5 35 (Unhealthy for Sensitive Groups)
particulate matter (PM2.5) dustO3 0.04 (Good)
ozone (O3)NO2 0 (Good)
nitrogen dioxide (NO2)SO2 0 (Good)
sulfur dioxide (SO2)堰桥
| index | 2022-05-27 |
|---|---|
| pm10 | 56 |
| pm25 | 56 |
| o3 | 0.03 |
| no2 | 0 |
| so2 | 0 |
堰桥

| index | 2020-05 | 2020-04 | 2020-03 | 2020-02 | 2020-01 | 2019-12 | 2019-11 | 2019-10 | 2019-09 | 2019-08 | 2019-07 | 2019-06 | 2019-05 | 2019-04 | 2019-03 | 2019-02 | 2019-01 | 2018-12 | 2018-11 | 2018-10 |
|---|---|---|---|---|---|---|---|---|---|---|---|---|---|---|---|---|---|---|---|---|
| pm25 | 42 | 36 | 29 | 28 | 56 | 60 | 41 | 43 | 27 | 22 | 28 | 28 | 34 | 42 | 54 | 57 | 68 | 49 | 56 | 44 |
| co | 884 | 861 | 749 | 667 | 855 | 1 | 946 | 1 | 914 | 848 | 780 | 803 | 736 | 804 | 884 | 902 | 1 | 1 | 1 | 980 |
| no2 | 27 | 44 | 36 | 22 | 35 | 59 | 53 | 44 | 29 | 26 | 32 | 27 | 46 | 49 | 53 | 32 | 54 | 49 | 52 | 46 |
| o3 | 158 | 152 | 110 | 95 | 66 | 71 | 95 | 119 | 146 | 165 | 166 | 187 | 164 | 140 | 112 | 83 | 65 | 54 | 91 | 121 |
| pm10 | 70 | 72 | 53 | 41 | 74 | 95 | 94 | 90 | 53 | 47 | 53 | 51 | 78 | 77 | 104 | 82 | 117 | 93 | 105 | 92 |
| so2 | 5.9 | 8.5 | 6.5 | 6 | 6.8 | 8.6 | 7.6 | 7.4 | 6 | 5 | 5.4 | 7.4 | 10 | 9.7 | 11 | 8 | 12 | 13 | 12 | 14 |