Air Pollution in Beiziyuan: Real-time Air Quality Index and smog alert.
Pollution and air quality forecast for Beiziyuan. Today is Tuesday, June 2, 2026. The following air pollution values have been recorded for Beiziyuan:- particulate matter (PM10) suspended dust - 179 (Very bad Hazardous)
- particulate matter (PM2.5) dust - 35 (Unhealthy for Sensitive Groups)
- ozone (O3) - 0 (Good)
- nitrogen dioxide (NO2) - 0 (Good)
- sulfur dioxide (SO2) - 0 (Good)

What is the air quality in Beiziyuan today? Is the air polluted in Beiziyuan?. Is there smog?
What is the level of PM10 today in Beiziyuan? (particulate matter (PM10) suspended dust)
The current level of particulate matter PM10 in Beiziyuan is:
179 (Very bad Hazardous)
The highest PM10 values usually occur in month: 156 (November 2018).
The lowest value of particulate matter PM10 pollution in Beiziyuan is usually recorded in: August (50).
What is the current level of PM2.5 in Beiziyuan? (particulate matter (PM2.5) dust)
Today's PM2.5 level is:
35 (Unhealthy for Sensitive Groups)
For comparison, the highest level of PM2.5 in Beiziyuan in the last 7 days was: 56 (Friday, May 27, 2022) and the lowest: 56 (Friday, May 27, 2022).
The highest PM2.5 values were recorded: 94 (January 2020).
The lowest level of particulate matter PM2.5 pollution occurs in month: August (26).
How is the O3 level today in Beiziyuan? (ozone (O3))
0 (Good)
How high is the level of NO2? (nitrogen dioxide (NO2))
0 (Good)
What is the level of SO2 pollution? (sulfur dioxide (SO2))
0 (Good)
Current data Friday, May 27, 2022, 12:00 PM
PM10 179 (Very bad Hazardous)
PM2,5 35 (Unhealthy for Sensitive Groups)
O3 0 (Good)
NO2 0 (Good)
SO2 0 (Good)
Data on air pollution from recent days in Beiziyuan
index
2022-05-27
pm10
56
Unhealthy for Sensitive Groups
pm25
56
Unhealthy
o3
0
Good
no2
0
Good
so2
0
Good
data source »
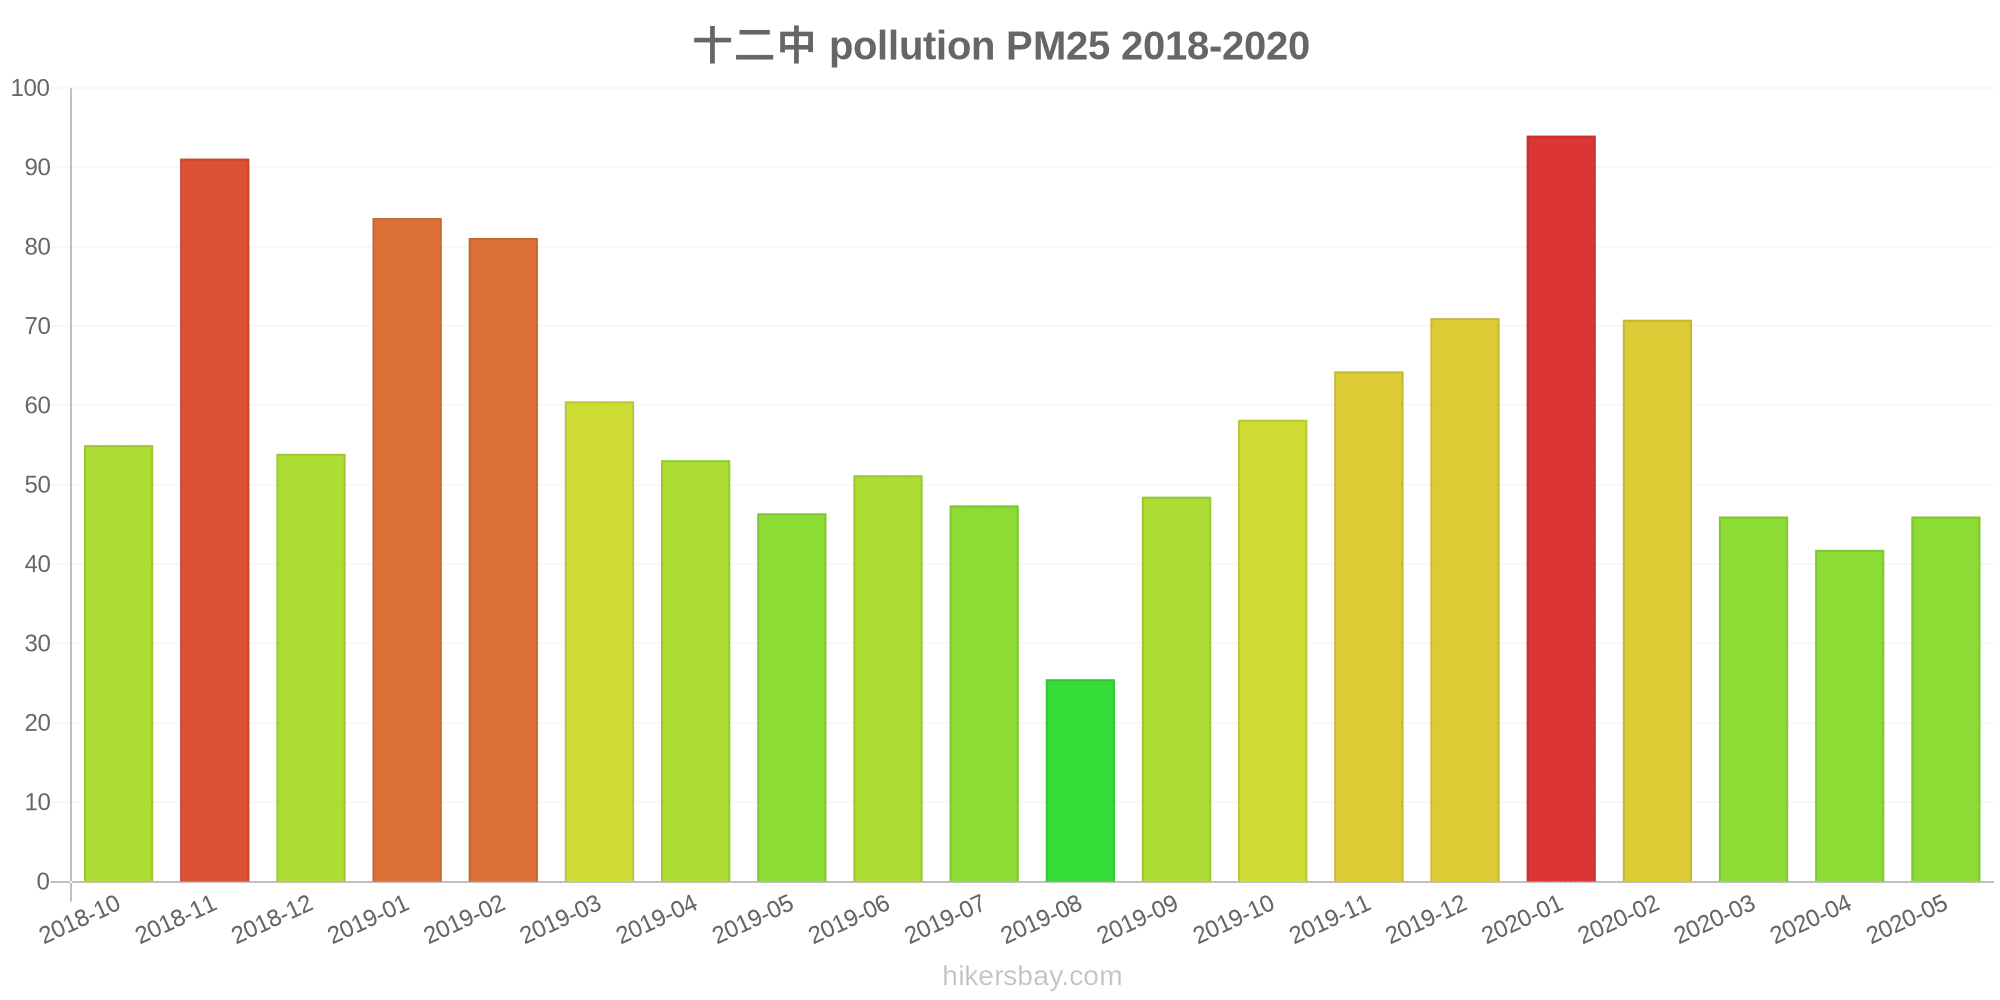
Air pollution in Beiziyuan from October 2018 to May 2020

index
2020-05
2020-04
2020-03
2020-02
2020-01
2019-12
2019-11
2019-10
2019-09
2019-08
2019-07
2019-06
2019-05
2019-04
2019-03
2019-02
2019-01
2018-12
2018-11
2018-10
pm25
46 (Unhealthy for Sensitive Groups)
42 (Unhealthy for Sensitive Groups)
46 (Unhealthy for Sensitive Groups)
71 (Unhealthy)
94 (Very Unhealthy)
71 (Unhealthy)
64 (Unhealthy)
58 (Unhealthy)
49 (Unhealthy for Sensitive Groups)
26 (Moderate)
47 (Unhealthy for Sensitive Groups)
51 (Unhealthy for Sensitive Groups)
46 (Unhealthy for Sensitive Groups)
53 (Unhealthy for Sensitive Groups)
61 (Unhealthy)
81 (Very Unhealthy)
84 (Very Unhealthy)
54 (Unhealthy for Sensitive Groups)
91 (Very Unhealthy)
55 (Unhealthy)
co
1 (Good)
1 (Good)
1 (Good)
1 (Good)
2 (Good)
1 (Good)
1 (Good)
1 (Good)
1 (Good)
1 (Good)
1 (Good)
2 (Good)
1 (Good)
1 (Good)
1 (Good)
1 (Good)
1 (Good)
1 (Good)
1 (Good)
1 (Good)
no2
42 (Moderate)
45 (Moderate)
43 (Moderate)
39 (Good)
64 (Moderate)
56 (Moderate)
58 (Moderate)
59 (Moderate)
47 (Moderate)
33 (Good)
39 (Good)
50 (Moderate)
45 (Moderate)
43 (Moderate)
54 (Moderate)
51 (Moderate)
63 (Moderate)
51 (Moderate)
64 (Moderate)
56 (Moderate)
o3
138 (Unhealthy for Sensitive Groups)
132 (Unhealthy for Sensitive Groups)
93 (Moderate)
71 (Moderate)
56 (Good)
44 (Good)
48 (Good)
97 (Moderate)
194 (Very Unhealthy)
141 (Unhealthy for Sensitive Groups)
188 (Very Unhealthy)
204 (Very Unhealthy)
179 (Unhealthy)
132 (Unhealthy for Sensitive Groups)
107 (Moderate)
79 (Moderate)
54 (Good)
52 (Good)
59 (Good)
82 (Moderate)
pm10
81 (Unhealthy)
86 (Unhealthy)
84 (Unhealthy)
102 (Unhealthy)
140 (Very Unhealthy)
108 (Unhealthy)
112 (Very Unhealthy)
106 (Unhealthy)
90 (Unhealthy)
50 (Moderate)
70 (Unhealthy for Sensitive Groups)
88 (Unhealthy)
97 (Unhealthy)
105 (Unhealthy)
115 (Very Unhealthy)
130 (Very Unhealthy)
135 (Very Unhealthy)
103 (Unhealthy)
156 (Very bad Hazardous)
120 (Very Unhealthy)
so2
14 (Good)
17 (Good)
14 (Good)
22 (Good)
33 (Good)
24 (Good)
29 (Good)
17 (Good)
19 (Good)
14 (Good)
19 (Good)
41 (Good)
28 (Good)
27 (Good)
26 (Good)
35 (Good)
33 (Good)
27 (Good)
43 (Good)
33 (Good)
data source »
十二中
Friday, May 27, 2022, 12:00 PM
PM10 179 (Very bad Hazardous)
particulate matter (PM10) suspended dust
PM2,5 35 (Unhealthy for Sensitive Groups)
particulate matter (PM2.5) dust
O3 0.04 (Good)
ozone (O3)
NO2 0 (Good)
nitrogen dioxide (NO2)
SO2 0 (Good)
sulfur dioxide (SO2)
十二中
index
2022-05-27
pm10
56
pm25
56
o3
0.03
no2
0
so2
0
十二中
2018-10 2020-05

index
2020-05
2020-04
2020-03
2020-02
2020-01
2019-12
2019-11
2019-10
2019-09
2019-08
2019-07
2019-06
2019-05
2019-04
2019-03
2019-02
2019-01
2018-12
2018-11
2018-10
pm25
46
42
46
71
94
71
64
58
49
26
47
51
46
53
61
81
84
54
91
55
co
1
1
1
1
2
1
1
1
1
1
1
2
1
1
1
1
1
1
1
1
no2
42
45
43
39
64
56
58
59
47
33
39
50
45
43
54
51
63
51
64
56
o3
138
132
93
71
56
44
48
97
194
141
188
204
179
132
107
79
54
52
59
82
pm10
81
86
84
102
140
108
112
106
90
50
70
88
97
105
115
130
135
103
156
120
so2
14
17
14
22
33
24
29
17
19
14
19
41
28
27
26
35
33
27
43
33
* Pollution data source:
https://openaq.org
(ChinaAQIData)
The data is licensed under CC-By 4.0
PM10 179 (Very bad Hazardous)
PM2,5 35 (Unhealthy for Sensitive Groups)
O3 0 (Good)
NO2 0 (Good)
SO2 0 (Good)
Data on air pollution from recent days in Beiziyuan
| index | 2022-05-27 |
|---|---|
| pm10 | 56 Unhealthy for Sensitive Groups |
| pm25 | 56 Unhealthy |
| o3 | 0 Good |
| no2 | 0 Good |
| so2 | 0 Good |

| index | 2020-05 | 2020-04 | 2020-03 | 2020-02 | 2020-01 | 2019-12 | 2019-11 | 2019-10 | 2019-09 | 2019-08 | 2019-07 | 2019-06 | 2019-05 | 2019-04 | 2019-03 | 2019-02 | 2019-01 | 2018-12 | 2018-11 | 2018-10 |
|---|---|---|---|---|---|---|---|---|---|---|---|---|---|---|---|---|---|---|---|---|
| pm25 | 46 (Unhealthy for Sensitive Groups) | 42 (Unhealthy for Sensitive Groups) | 46 (Unhealthy for Sensitive Groups) | 71 (Unhealthy) | 94 (Very Unhealthy) | 71 (Unhealthy) | 64 (Unhealthy) | 58 (Unhealthy) | 49 (Unhealthy for Sensitive Groups) | 26 (Moderate) | 47 (Unhealthy for Sensitive Groups) | 51 (Unhealthy for Sensitive Groups) | 46 (Unhealthy for Sensitive Groups) | 53 (Unhealthy for Sensitive Groups) | 61 (Unhealthy) | 81 (Very Unhealthy) | 84 (Very Unhealthy) | 54 (Unhealthy for Sensitive Groups) | 91 (Very Unhealthy) | 55 (Unhealthy) |
| co | 1 (Good) | 1 (Good) | 1 (Good) | 1 (Good) | 2 (Good) | 1 (Good) | 1 (Good) | 1 (Good) | 1 (Good) | 1 (Good) | 1 (Good) | 2 (Good) | 1 (Good) | 1 (Good) | 1 (Good) | 1 (Good) | 1 (Good) | 1 (Good) | 1 (Good) | 1 (Good) |
| no2 | 42 (Moderate) | 45 (Moderate) | 43 (Moderate) | 39 (Good) | 64 (Moderate) | 56 (Moderate) | 58 (Moderate) | 59 (Moderate) | 47 (Moderate) | 33 (Good) | 39 (Good) | 50 (Moderate) | 45 (Moderate) | 43 (Moderate) | 54 (Moderate) | 51 (Moderate) | 63 (Moderate) | 51 (Moderate) | 64 (Moderate) | 56 (Moderate) |
| o3 | 138 (Unhealthy for Sensitive Groups) | 132 (Unhealthy for Sensitive Groups) | 93 (Moderate) | 71 (Moderate) | 56 (Good) | 44 (Good) | 48 (Good) | 97 (Moderate) | 194 (Very Unhealthy) | 141 (Unhealthy for Sensitive Groups) | 188 (Very Unhealthy) | 204 (Very Unhealthy) | 179 (Unhealthy) | 132 (Unhealthy for Sensitive Groups) | 107 (Moderate) | 79 (Moderate) | 54 (Good) | 52 (Good) | 59 (Good) | 82 (Moderate) |
| pm10 | 81 (Unhealthy) | 86 (Unhealthy) | 84 (Unhealthy) | 102 (Unhealthy) | 140 (Very Unhealthy) | 108 (Unhealthy) | 112 (Very Unhealthy) | 106 (Unhealthy) | 90 (Unhealthy) | 50 (Moderate) | 70 (Unhealthy for Sensitive Groups) | 88 (Unhealthy) | 97 (Unhealthy) | 105 (Unhealthy) | 115 (Very Unhealthy) | 130 (Very Unhealthy) | 135 (Very Unhealthy) | 103 (Unhealthy) | 156 (Very bad Hazardous) | 120 (Very Unhealthy) |
| so2 | 14 (Good) | 17 (Good) | 14 (Good) | 22 (Good) | 33 (Good) | 24 (Good) | 29 (Good) | 17 (Good) | 19 (Good) | 14 (Good) | 19 (Good) | 41 (Good) | 28 (Good) | 27 (Good) | 26 (Good) | 35 (Good) | 33 (Good) | 27 (Good) | 43 (Good) | 33 (Good) |
PM10 179 (Very bad Hazardous)
particulate matter (PM10) suspended dustPM2,5 35 (Unhealthy for Sensitive Groups)
particulate matter (PM2.5) dustO3 0.04 (Good)
ozone (O3)NO2 0 (Good)
nitrogen dioxide (NO2)SO2 0 (Good)
sulfur dioxide (SO2)十二中
| index | 2022-05-27 |
|---|---|
| pm10 | 56 |
| pm25 | 56 |
| o3 | 0.03 |
| no2 | 0 |
| so2 | 0 |
十二中
| index | 2020-05 | 2020-04 | 2020-03 | 2020-02 | 2020-01 | 2019-12 | 2019-11 | 2019-10 | 2019-09 | 2019-08 | 2019-07 | 2019-06 | 2019-05 | 2019-04 | 2019-03 | 2019-02 | 2019-01 | 2018-12 | 2018-11 | 2018-10 |
|---|---|---|---|---|---|---|---|---|---|---|---|---|---|---|---|---|---|---|---|---|
| pm25 | 46 | 42 | 46 | 71 | 94 | 71 | 64 | 58 | 49 | 26 | 47 | 51 | 46 | 53 | 61 | 81 | 84 | 54 | 91 | 55 |
| co | 1 | 1 | 1 | 1 | 2 | 1 | 1 | 1 | 1 | 1 | 1 | 2 | 1 | 1 | 1 | 1 | 1 | 1 | 1 | 1 |
| no2 | 42 | 45 | 43 | 39 | 64 | 56 | 58 | 59 | 47 | 33 | 39 | 50 | 45 | 43 | 54 | 51 | 63 | 51 | 64 | 56 |
| o3 | 138 | 132 | 93 | 71 | 56 | 44 | 48 | 97 | 194 | 141 | 188 | 204 | 179 | 132 | 107 | 79 | 54 | 52 | 59 | 82 |
| pm10 | 81 | 86 | 84 | 102 | 140 | 108 | 112 | 106 | 90 | 50 | 70 | 88 | 97 | 105 | 115 | 130 | 135 | 103 | 156 | 120 |
| so2 | 14 | 17 | 14 | 22 | 33 | 24 | 29 | 17 | 19 | 14 | 19 | 41 | 28 | 27 | 26 | 35 | 33 | 27 | 43 | 33 |