Air Pollution in Boli: Real-time Air Quality Index and smog alert.
Pollution and air quality forecast for Boli. Today is Tuesday, June 16, 2026. The following air pollution values have been recorded for Boli:- particulate matter (PM2.5) dust - 61 (Unhealthy)
- nitrogen dioxide (NO2) - 22 (Good)
- particulate matter (PM10) suspended dust - 69 (Unhealthy for Sensitive Groups)
- carbon monoxide (CO) - 219 (Good)
- ozone (O3) - 0 (Good)
- sulfur dioxide (SO2) - 8 (Good)

What is the air quality in Boli today? Is the air polluted in Boli?. Is there smog?
What is the current level of PM2.5 in Boli? (particulate matter (PM2.5) dust)
Today's PM2.5 level is:
61 (Unhealthy)
For comparison, the highest level of PM2.5 in Boli in the last 7 days was: 28 (Friday, May 27, 2022) and the lowest: 28 (Friday, May 27, 2022).
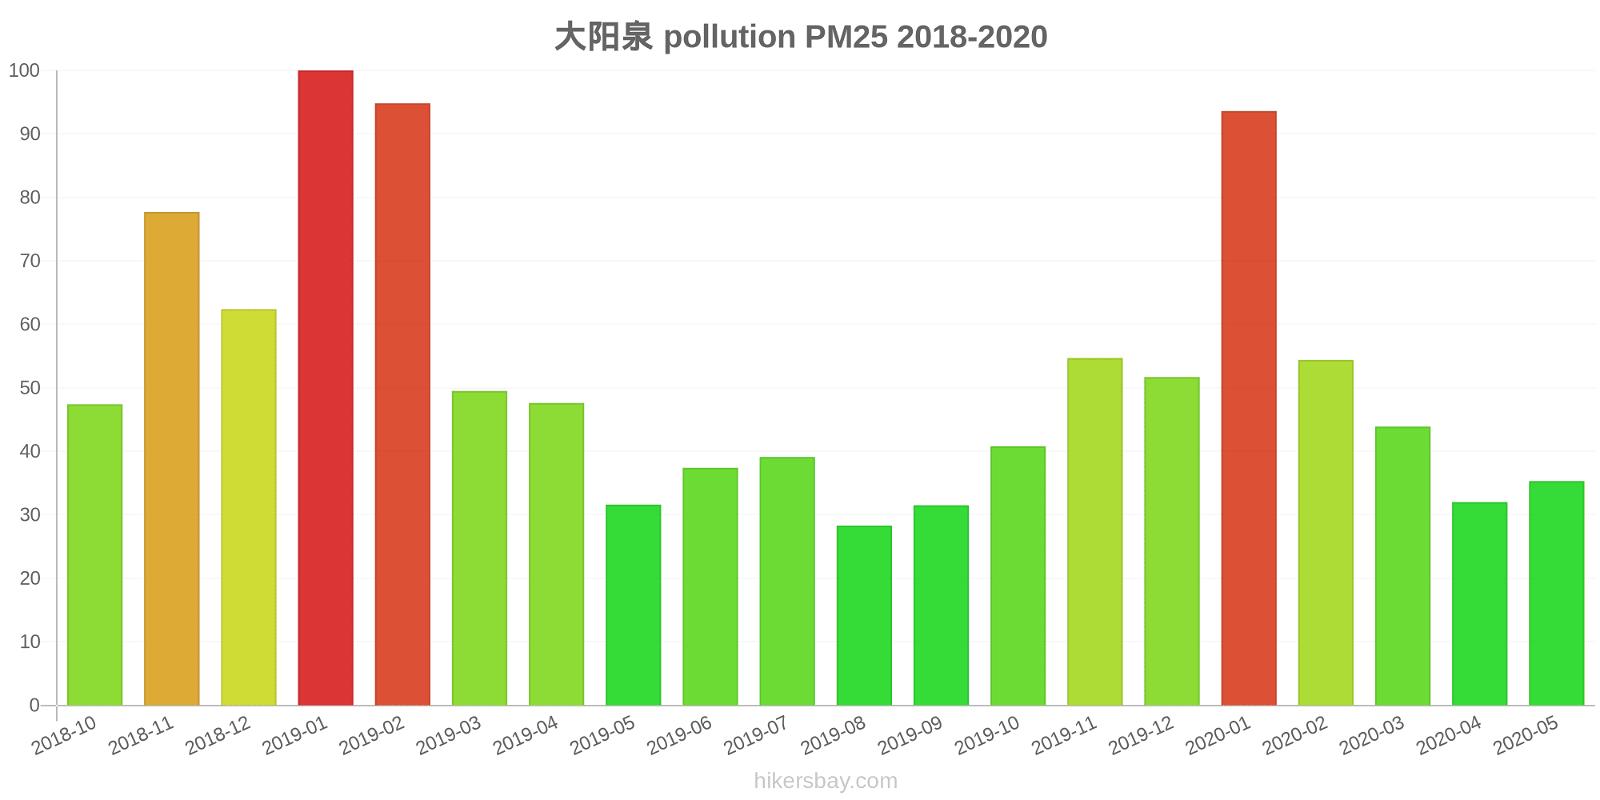
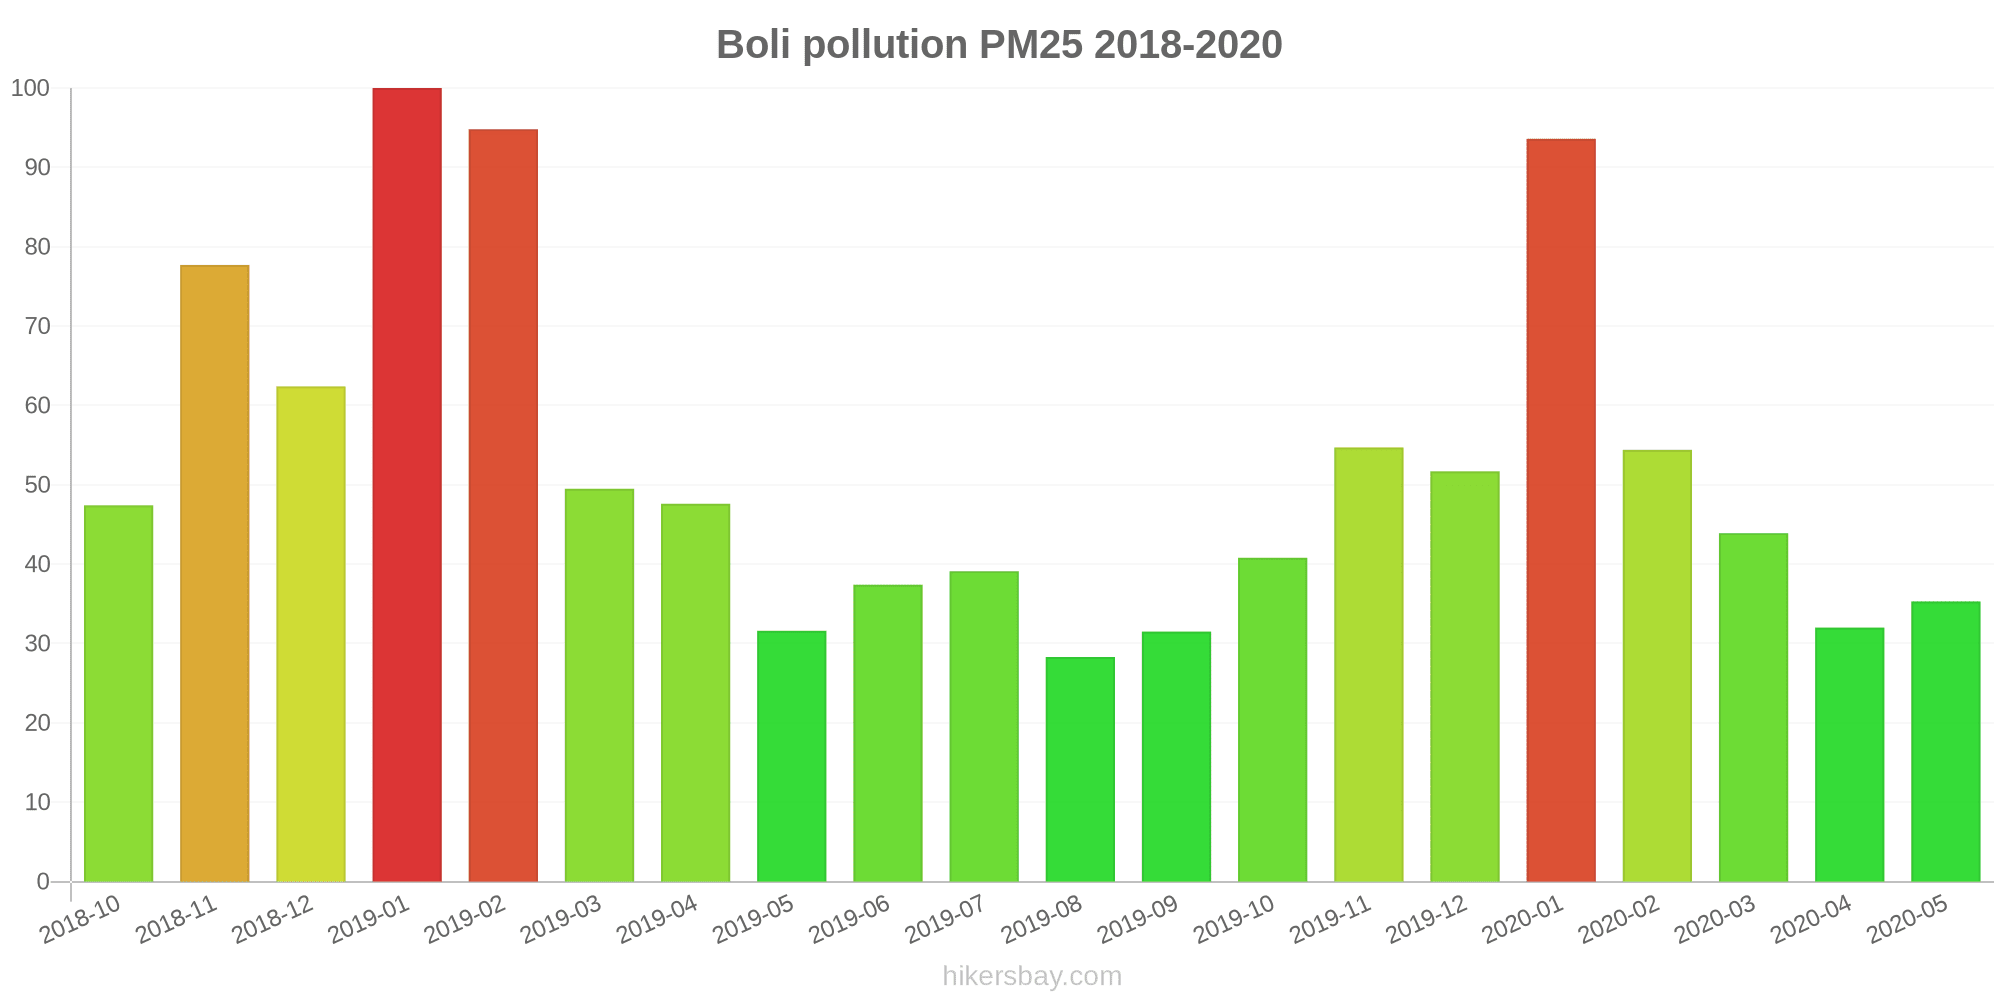
The highest PM2.5 values were recorded: 100 (January 2019).
The lowest level of particulate matter PM2.5 pollution occurs in month: August (28).
How high is the level of NO2? (nitrogen dioxide (NO2))
22 (Good)
What is the level of PM10 today in Boli? (particulate matter (PM10) suspended dust)
The current level of particulate matter PM10 in Boli is:
69 (Unhealthy for Sensitive Groups)
The highest PM10 values usually occur in month: 123 (January 2020).
The lowest value of particulate matter PM10 pollution in Boli is usually recorded in: August (38).
How high is the CO level? (carbon monoxide (CO))
219 (Good)
How is the O3 level today in Boli? (ozone (O3))
0 (Good)
What is the level of SO2 pollution? (sulfur dioxide (SO2))
8 (Good)
Current data Friday, May 27, 2022, 3:00 PM
PM2,5 61 (Unhealthy)
NO2 22 (Good)
PM10 69 (Unhealthy for Sensitive Groups)
CO 219 (Good)
O3 0 (Good)
SO2 8 (Good)
Data on air pollution from recent days in Boli
index
2022-05-27
pm25
28
Moderate
no2
22
Good
pm10
35
Moderate
co
579
Good
o3
22
Good
so2
5
Good
data source »
Air pollution in Boli from October 2018 to May 2020

index
2020-05
2020-04
2020-03
2020-02
2020-01
2019-12
2019-11
2019-10
2019-09
2019-08
2019-07
2019-06
2019-05
2019-04
2019-03
2019-02
2019-01
2018-12
2018-11
2018-10
pm25
35 (Unhealthy for Sensitive Groups)
32 (Moderate)
44 (Unhealthy for Sensitive Groups)
54 (Unhealthy for Sensitive Groups)
94 (Very Unhealthy)
52 (Unhealthy for Sensitive Groups)
55 (Unhealthy for Sensitive Groups)
41 (Unhealthy for Sensitive Groups)
32 (Moderate)
28 (Moderate)
39 (Unhealthy for Sensitive Groups)
37 (Unhealthy for Sensitive Groups)
32 (Moderate)
48 (Unhealthy for Sensitive Groups)
50 (Unhealthy for Sensitive Groups)
95 (Very Unhealthy)
100 (Very Unhealthy)
62 (Unhealthy)
78 (Very Unhealthy)
47 (Unhealthy for Sensitive Groups)
co
787 (Good)
623 (Good)
816 (Good)
1 (Good)
1 (Good)
958 (Good)
1 (Good)
847 (Good)
673 (Good)
749 (Good)
800 (Good)
719 (Good)
597 (Good)
774 (Good)
712 (Good)
1 (Good)
1 (Good)
975 (Good)
929 (Good)
710 (Good)
no2
24 (Good)
26 (Good)
28 (Good)
23 (Good)
43 (Moderate)
42 (Moderate)
42 (Moderate)
28 (Good)
23 (Good)
21 (Good)
18 (Good)
15 (Good)
18 (Good)
19 (Good)
21 (Good)
27 (Good)
53 (Moderate)
46 (Moderate)
44 (Moderate)
25 (Good)
o3
157 (Unhealthy)
139 (Unhealthy for Sensitive Groups)
108 (Moderate)
93 (Moderate)
83 (Moderate)
68 (Good)
68 (Good)
99 (Moderate)
161 (Unhealthy)
153 (Unhealthy)
192 (Very Unhealthy)
203 (Very Unhealthy)
166 (Unhealthy)
131 (Unhealthy for Sensitive Groups)
116 (Moderate)
89 (Moderate)
72 (Moderate)
56 (Good)
81 (Moderate)
104 (Moderate)
pm10
78 (Unhealthy for Sensitive Groups)
69 (Unhealthy for Sensitive Groups)
84 (Unhealthy)
81 (Unhealthy)
123 (Very Unhealthy)
80 (Unhealthy)
70 (Unhealthy for Sensitive Groups)
62 (Unhealthy for Sensitive Groups)
46 (Moderate)
38 (Moderate)
42 (Moderate)
40 (Moderate)
50 (Moderate)
67 (Unhealthy for Sensitive Groups)
66 (Unhealthy for Sensitive Groups)
100 (Unhealthy)
115 (Very Unhealthy)
87 (Unhealthy)
105 (Unhealthy)
57 (Unhealthy for Sensitive Groups)
so2
11 (Good)
11 (Good)
14 (Good)
19 (Good)
36 (Good)
26 (Good)
17 (Good)
9.8 (Good)
9.8 (Good)
7.1 (Good)
11 (Good)
14 (Good)
13 (Good)
13 (Good)
20 (Good)
31 (Good)
62 (Moderate)
37 (Good)
30 (Good)
15 (Good)
data source »
大阳泉
Friday, May 27, 2022, 3:00 PM
PM2,5 61 (Unhealthy)
particulate matter (PM2.5) dust
NO2 22 (Good)
nitrogen dioxide (NO2)
PM10 69 (Unhealthy for Sensitive Groups)
particulate matter (PM10) suspended dust
CO 219 (Good)
carbon monoxide (CO)
O3 0.05 (Good)
ozone (O3)
SO2 7.7 (Good)
sulfur dioxide (SO2)
大阳泉
index
2022-05-27
pm25
28
no2
22
pm10
35
co
579
o3
22
so2
4.6
大阳泉
2018-10 2020-05
index
2020-05
2020-04
2020-03
2020-02
2020-01
2019-12
2019-11
2019-10
2019-09
2019-08
2019-07
2019-06
2019-05
2019-04
2019-03
2019-02
2019-01
2018-12
2018-11
2018-10
pm25
35
32
44
54
94
52
55
41
32
28
39
37
32
48
50
95
100
62
78
47
co
787
623
816
1
1
958
1
847
673
749
800
719
597
774
712
1
1
975
929
710
no2
24
26
28
23
43
42
42
28
23
21
18
15
18
19
21
27
53
46
44
25
o3
157
139
108
93
83
68
68
99
161
153
192
203
166
131
116
89
72
56
81
104
pm10
78
69
84
81
123
80
70
62
46
38
42
40
50
67
66
100
115
87
105
57
so2
11
11
14
19
36
26
17
9.8
9.8
7.1
11
14
13
13
20
31
62
37
30
15
* Pollution data source:
https://openaq.org
(ChinaAQIData)
The data is licensed under CC-By 4.0
PM2,5 61 (Unhealthy)
NO2 22 (Good)
PM10 69 (Unhealthy for Sensitive Groups)
CO 219 (Good)
O3 0 (Good)
SO2 8 (Good)
Data on air pollution from recent days in Boli
| index | 2022-05-27 |
|---|---|
| pm25 | 28 Moderate |
| no2 | 22 Good |
| pm10 | 35 Moderate |
| co | 579 Good |
| o3 | 22 Good |
| so2 | 5 Good |
| index | 2020-05 | 2020-04 | 2020-03 | 2020-02 | 2020-01 | 2019-12 | 2019-11 | 2019-10 | 2019-09 | 2019-08 | 2019-07 | 2019-06 | 2019-05 | 2019-04 | 2019-03 | 2019-02 | 2019-01 | 2018-12 | 2018-11 | 2018-10 |
|---|---|---|---|---|---|---|---|---|---|---|---|---|---|---|---|---|---|---|---|---|
| pm25 | 35 (Unhealthy for Sensitive Groups) | 32 (Moderate) | 44 (Unhealthy for Sensitive Groups) | 54 (Unhealthy for Sensitive Groups) | 94 (Very Unhealthy) | 52 (Unhealthy for Sensitive Groups) | 55 (Unhealthy for Sensitive Groups) | 41 (Unhealthy for Sensitive Groups) | 32 (Moderate) | 28 (Moderate) | 39 (Unhealthy for Sensitive Groups) | 37 (Unhealthy for Sensitive Groups) | 32 (Moderate) | 48 (Unhealthy for Sensitive Groups) | 50 (Unhealthy for Sensitive Groups) | 95 (Very Unhealthy) | 100 (Very Unhealthy) | 62 (Unhealthy) | 78 (Very Unhealthy) | 47 (Unhealthy for Sensitive Groups) |
| co | 787 (Good) | 623 (Good) | 816 (Good) | 1 (Good) | 1 (Good) | 958 (Good) | 1 (Good) | 847 (Good) | 673 (Good) | 749 (Good) | 800 (Good) | 719 (Good) | 597 (Good) | 774 (Good) | 712 (Good) | 1 (Good) | 1 (Good) | 975 (Good) | 929 (Good) | 710 (Good) |
| no2 | 24 (Good) | 26 (Good) | 28 (Good) | 23 (Good) | 43 (Moderate) | 42 (Moderate) | 42 (Moderate) | 28 (Good) | 23 (Good) | 21 (Good) | 18 (Good) | 15 (Good) | 18 (Good) | 19 (Good) | 21 (Good) | 27 (Good) | 53 (Moderate) | 46 (Moderate) | 44 (Moderate) | 25 (Good) |
| o3 | 157 (Unhealthy) | 139 (Unhealthy for Sensitive Groups) | 108 (Moderate) | 93 (Moderate) | 83 (Moderate) | 68 (Good) | 68 (Good) | 99 (Moderate) | 161 (Unhealthy) | 153 (Unhealthy) | 192 (Very Unhealthy) | 203 (Very Unhealthy) | 166 (Unhealthy) | 131 (Unhealthy for Sensitive Groups) | 116 (Moderate) | 89 (Moderate) | 72 (Moderate) | 56 (Good) | 81 (Moderate) | 104 (Moderate) |
| pm10 | 78 (Unhealthy for Sensitive Groups) | 69 (Unhealthy for Sensitive Groups) | 84 (Unhealthy) | 81 (Unhealthy) | 123 (Very Unhealthy) | 80 (Unhealthy) | 70 (Unhealthy for Sensitive Groups) | 62 (Unhealthy for Sensitive Groups) | 46 (Moderate) | 38 (Moderate) | 42 (Moderate) | 40 (Moderate) | 50 (Moderate) | 67 (Unhealthy for Sensitive Groups) | 66 (Unhealthy for Sensitive Groups) | 100 (Unhealthy) | 115 (Very Unhealthy) | 87 (Unhealthy) | 105 (Unhealthy) | 57 (Unhealthy for Sensitive Groups) |
| so2 | 11 (Good) | 11 (Good) | 14 (Good) | 19 (Good) | 36 (Good) | 26 (Good) | 17 (Good) | 9.8 (Good) | 9.8 (Good) | 7.1 (Good) | 11 (Good) | 14 (Good) | 13 (Good) | 13 (Good) | 20 (Good) | 31 (Good) | 62 (Moderate) | 37 (Good) | 30 (Good) | 15 (Good) |
PM2,5 61 (Unhealthy)
particulate matter (PM2.5) dustNO2 22 (Good)
nitrogen dioxide (NO2)PM10 69 (Unhealthy for Sensitive Groups)
particulate matter (PM10) suspended dustCO 219 (Good)
carbon monoxide (CO)O3 0.05 (Good)
ozone (O3)SO2 7.7 (Good)
sulfur dioxide (SO2)大阳泉
| index | 2022-05-27 |
|---|---|
| pm25 | 28 |
| no2 | 22 |
| pm10 | 35 |
| co | 579 |
| o3 | 22 |
| so2 | 4.6 |
大阳泉

| index | 2020-05 | 2020-04 | 2020-03 | 2020-02 | 2020-01 | 2019-12 | 2019-11 | 2019-10 | 2019-09 | 2019-08 | 2019-07 | 2019-06 | 2019-05 | 2019-04 | 2019-03 | 2019-02 | 2019-01 | 2018-12 | 2018-11 | 2018-10 |
|---|---|---|---|---|---|---|---|---|---|---|---|---|---|---|---|---|---|---|---|---|
| pm25 | 35 | 32 | 44 | 54 | 94 | 52 | 55 | 41 | 32 | 28 | 39 | 37 | 32 | 48 | 50 | 95 | 100 | 62 | 78 | 47 |
| co | 787 | 623 | 816 | 1 | 1 | 958 | 1 | 847 | 673 | 749 | 800 | 719 | 597 | 774 | 712 | 1 | 1 | 975 | 929 | 710 |
| no2 | 24 | 26 | 28 | 23 | 43 | 42 | 42 | 28 | 23 | 21 | 18 | 15 | 18 | 19 | 21 | 27 | 53 | 46 | 44 | 25 |
| o3 | 157 | 139 | 108 | 93 | 83 | 68 | 68 | 99 | 161 | 153 | 192 | 203 | 166 | 131 | 116 | 89 | 72 | 56 | 81 | 104 |
| pm10 | 78 | 69 | 84 | 81 | 123 | 80 | 70 | 62 | 46 | 38 | 42 | 40 | 50 | 67 | 66 | 100 | 115 | 87 | 105 | 57 |
| so2 | 11 | 11 | 14 | 19 | 36 | 26 | 17 | 9.8 | 9.8 | 7.1 | 11 | 14 | 13 | 13 | 20 | 31 | 62 | 37 | 30 | 15 |