Air Pollution in Caijiagang: Real-time Air Quality Index and smog alert.
Pollution and air quality forecast for Caijiagang. Today is Tuesday, June 16, 2026. The following air pollution values have been recorded for Caijiagang:- particulate matter (PM10) suspended dust - 7 (Good)
- particulate matter (PM2.5) dust - 2 (Good)
- carbon monoxide (CO) - 100 (Good)
- nitrogen dioxide (NO2) - 8 (Good)
- ozone (O3) - 0 (Good)
- sulfur dioxide (SO2) - 9 (Good)

What is the air quality in Caijiagang today? Is the air polluted in Caijiagang?. Is there smog?
What is the level of PM10 today in Caijiagang? (particulate matter (PM10) suspended dust)
The current level of particulate matter PM10 in Caijiagang is:
7 (Good)
The highest PM10 values usually occur in month: 139 (January 2019).
The lowest value of particulate matter PM10 pollution in Caijiagang is usually recorded in: August (41).
What is the current level of PM2.5 in Caijiagang? (particulate matter (PM2.5) dust)
Today's PM2.5 level is:
2 (Good)
For comparison, the highest level of PM2.5 in Caijiagang in the last 7 days was: 24 (Friday, May 27, 2022) and the lowest: 24 (Friday, May 27, 2022).
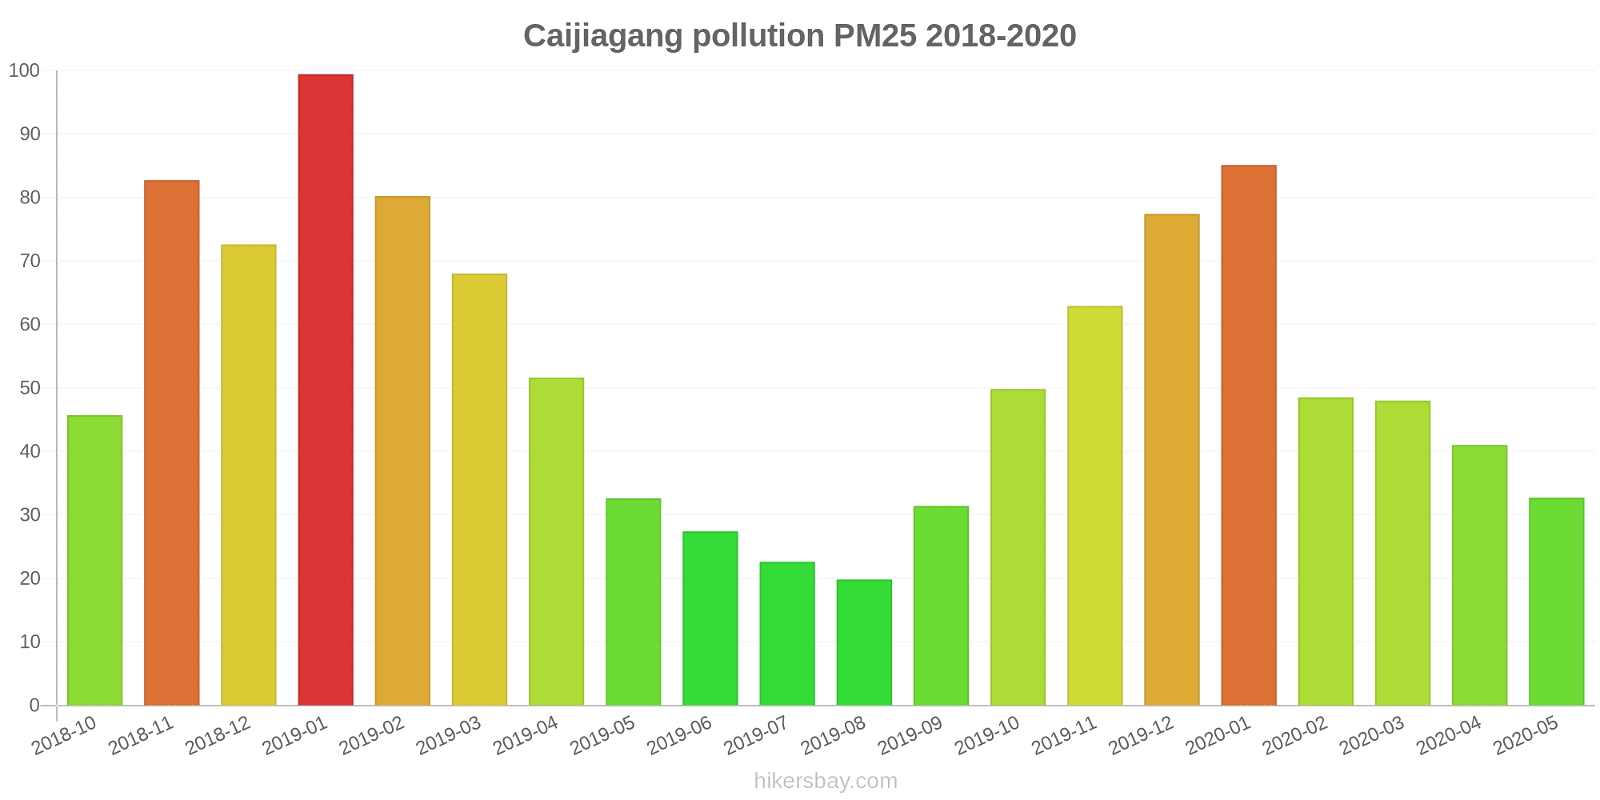
The highest PM2.5 values were recorded: 99 (January 2019).
The lowest level of particulate matter PM2.5 pollution occurs in month: August (20).
How high is the CO level? (carbon monoxide (CO))
100 (Good)
How high is the level of NO2? (nitrogen dioxide (NO2))
8 (Good)
How is the O3 level today in Caijiagang? (ozone (O3))
0 (Good)
What is the level of SO2 pollution? (sulfur dioxide (SO2))
9 (Good)
Current data Friday, May 27, 2022, 12:00 PM
PM10 7 (Good)
PM2,5 2 (Good)
CO 100 (Good)
NO2 8 (Good)
O3 0 (Good)
SO2 9 (Good)
Data on air pollution from recent days in Caijiagang
index
2022-05-27
pm10
32
Moderate
pm25
24
Moderate
co
468
Good
no2
21
Good
o3
32
Good
so2
5
Good
data source »
Air pollution in Caijiagang from October 2018 to May 2020
index
2020-05
2020-04
2020-03
2020-02
2020-01
2019-12
2019-11
2019-10
2019-09
2019-08
2019-07
2019-06
2019-05
2019-04
2019-03
2019-02
2019-01
2018-12
2018-11
2018-10
pm25
33 (Moderate)
41 (Unhealthy for Sensitive Groups)
48 (Unhealthy for Sensitive Groups)
49 (Unhealthy for Sensitive Groups)
85 (Very Unhealthy)
77 (Very Unhealthy)
63 (Unhealthy)
50 (Unhealthy for Sensitive Groups)
31 (Moderate)
20 (Moderate)
23 (Moderate)
27 (Moderate)
33 (Moderate)
52 (Unhealthy for Sensitive Groups)
68 (Unhealthy)
80 (Very Unhealthy)
99 (Very Unhealthy)
73 (Unhealthy)
83 (Very Unhealthy)
46 (Unhealthy for Sensitive Groups)
co
524 (Good)
494 (Good)
554 (Good)
563 (Good)
930 (Good)
765 (Good)
611 (Good)
618 (Good)
677 (Good)
613 (Good)
513 (Good)
535 (Good)
486 (Good)
627 (Good)
578 (Good)
723 (Good)
882 (Good)
744 (Good)
784 (Good)
469 (Good)
no2
20 (Good)
30 (Good)
30 (Good)
17 (Good)
33 (Good)
52 (Moderate)
40 (Good)
31 (Good)
21 (Good)
15 (Good)
14 (Good)
15 (Good)
18 (Good)
23 (Good)
34 (Good)
28 (Good)
46 (Moderate)
43 (Moderate)
39 (Good)
31 (Good)
o3
134 (Unhealthy for Sensitive Groups)
140 (Unhealthy for Sensitive Groups)
111 (Moderate)
90 (Moderate)
70 (Good)
68 (Good)
99 (Moderate)
117 (Moderate)
144 (Unhealthy for Sensitive Groups)
152 (Unhealthy)
154 (Unhealthy)
182 (Very Unhealthy)
163 (Unhealthy)
131 (Unhealthy for Sensitive Groups)
120 (Unhealthy for Sensitive Groups)
85 (Moderate)
70 (Good)
60 (Good)
96 (Moderate)
121 (Unhealthy for Sensitive Groups)
pm10
65 (Unhealthy for Sensitive Groups)
81 (Unhealthy)
82 (Unhealthy)
66 (Unhealthy for Sensitive Groups)
106 (Unhealthy)
109 (Unhealthy)
114 (Very Unhealthy)
103 (Unhealthy)
64 (Unhealthy for Sensitive Groups)
41 (Moderate)
46 (Moderate)
58 (Unhealthy for Sensitive Groups)
78 (Unhealthy for Sensitive Groups)
92 (Unhealthy)
117 (Very Unhealthy)
102 (Unhealthy)
139 (Very Unhealthy)
107 (Unhealthy)
120 (Very Unhealthy)
85 (Unhealthy)
so2
11 (Good)
15 (Good)
12 (Good)
8 (Good)
9.8 (Good)
15 (Good)
19 (Good)
17 (Good)
18 (Good)
11 (Good)
9.7 (Good)
8.5 (Good)
15 (Good)
12 (Good)
15 (Good)
8.2 (Good)
15 (Good)
14 (Good)
17 (Good)
9.7 (Good)
data source »
Huainan Xie Jia Ji Qu Zheng Fu
Friday, May 27, 2022, 12:00 PM
PM10 6.7 (Good)
particulate matter (PM10) suspended dust
PM2,5 1.7 (Good)
particulate matter (PM2.5) dust
CO 100 (Good)
carbon monoxide (CO)
NO2 7.6 (Good)
nitrogen dioxide (NO2)
O3 0.02 (Good)
ozone (O3)
SO2 8.6 (Good)
sulfur dioxide (SO2)
Huainan Xie Jia Ji Qu Zheng Fu
index
2022-05-27
pm10
32
pm25
24
co
468
no2
21
o3
32
so2
4.6
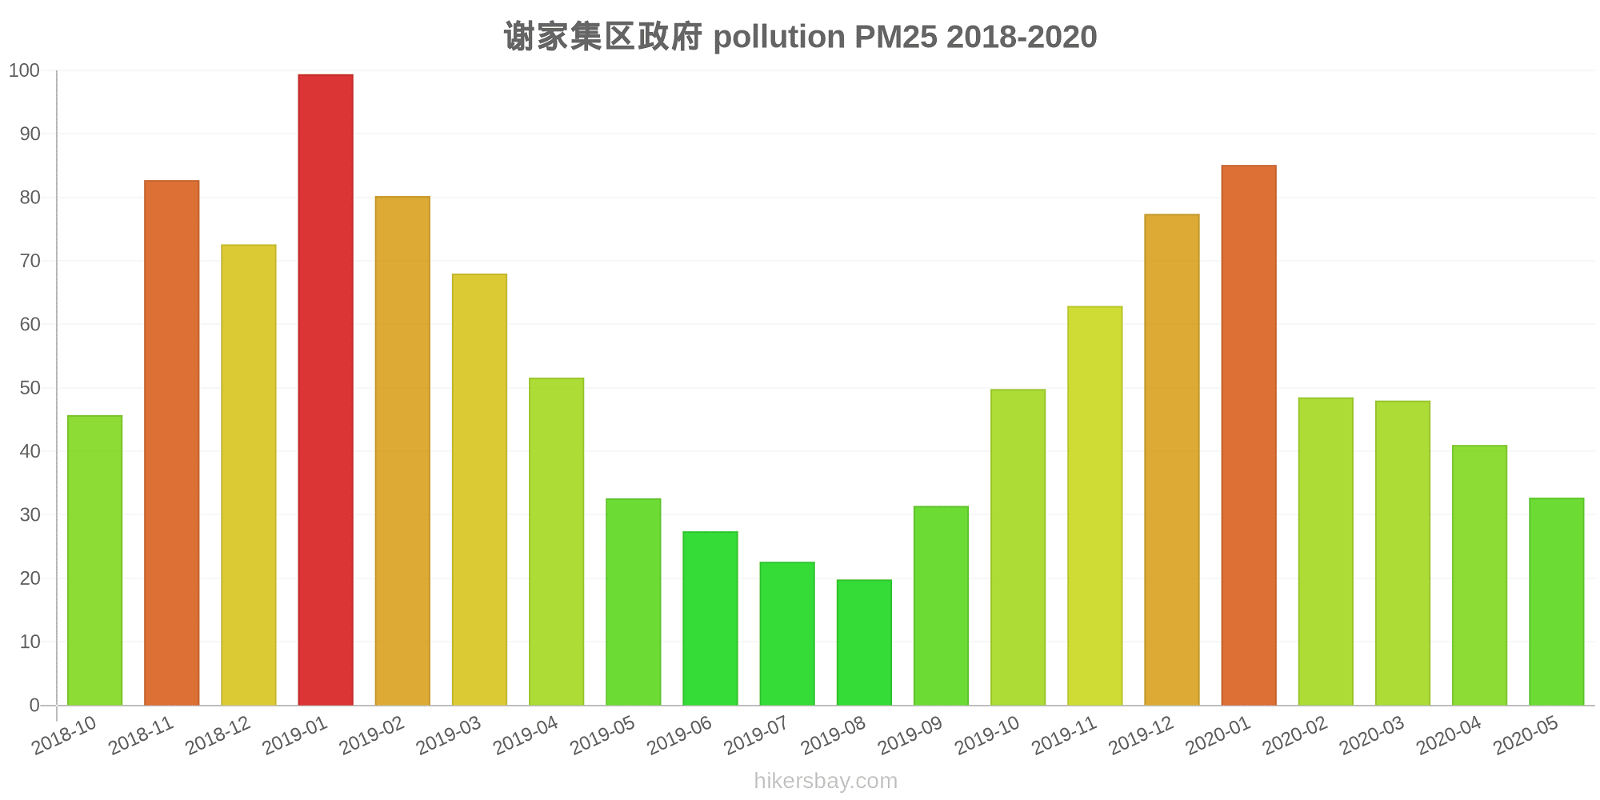
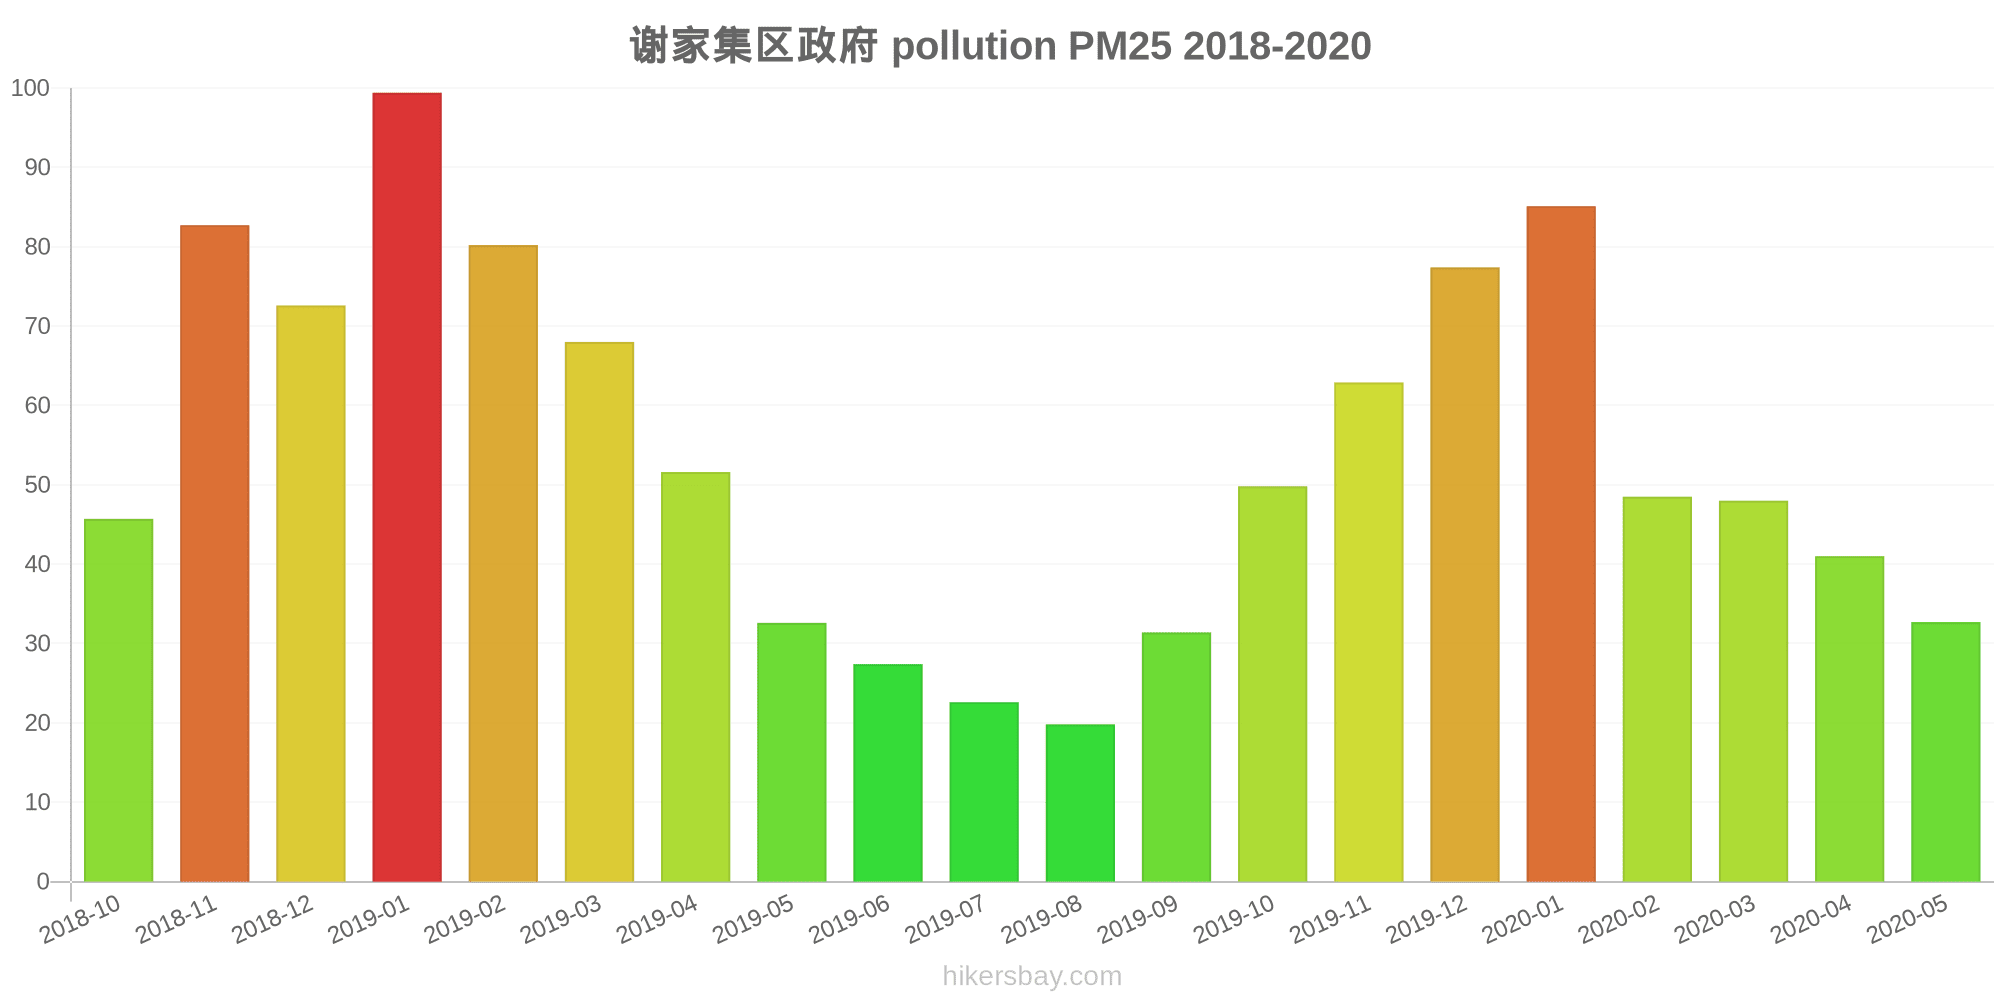
谢家集区政府
2018-10 2020-05
index
2020-05
2020-04
2020-03
2020-02
2020-01
2019-12
2019-11
2019-10
2019-09
2019-08
2019-07
2019-06
2019-05
2019-04
2019-03
2019-02
2019-01
2018-12
2018-11
2018-10
pm25
33
41
48
49
85
77
63
50
31
20
23
27
33
52
68
80
99
73
83
46
co
524
494
554
563
930
765
611
618
677
613
513
535
486
627
578
723
882
744
784
469
no2
20
30
30
17
33
52
40
31
21
15
14
15
18
23
34
28
46
43
39
31
o3
134
140
111
90
70
68
99
117
144
152
154
182
163
131
120
85
70
60
96
121
pm10
65
81
82
66
106
109
114
103
64
41
46
58
78
92
117
102
139
107
120
85
so2
11
15
12
8
9.8
15
19
17
18
11
9.7
8.5
15
12
15
8.2
15
14
17
9.7
* Pollution data source:
https://openaq.org
(ChinaAQIData)
The data is licensed under CC-By 4.0
PM10 7 (Good)
PM2,5 2 (Good)
CO 100 (Good)
NO2 8 (Good)
O3 0 (Good)
SO2 9 (Good)
Data on air pollution from recent days in Caijiagang
| index | 2022-05-27 |
|---|---|
| pm10 | 32 Moderate |
| pm25 | 24 Moderate |
| co | 468 Good |
| no2 | 21 Good |
| o3 | 32 Good |
| so2 | 5 Good |

| index | 2020-05 | 2020-04 | 2020-03 | 2020-02 | 2020-01 | 2019-12 | 2019-11 | 2019-10 | 2019-09 | 2019-08 | 2019-07 | 2019-06 | 2019-05 | 2019-04 | 2019-03 | 2019-02 | 2019-01 | 2018-12 | 2018-11 | 2018-10 |
|---|---|---|---|---|---|---|---|---|---|---|---|---|---|---|---|---|---|---|---|---|
| pm25 | 33 (Moderate) | 41 (Unhealthy for Sensitive Groups) | 48 (Unhealthy for Sensitive Groups) | 49 (Unhealthy for Sensitive Groups) | 85 (Very Unhealthy) | 77 (Very Unhealthy) | 63 (Unhealthy) | 50 (Unhealthy for Sensitive Groups) | 31 (Moderate) | 20 (Moderate) | 23 (Moderate) | 27 (Moderate) | 33 (Moderate) | 52 (Unhealthy for Sensitive Groups) | 68 (Unhealthy) | 80 (Very Unhealthy) | 99 (Very Unhealthy) | 73 (Unhealthy) | 83 (Very Unhealthy) | 46 (Unhealthy for Sensitive Groups) |
| co | 524 (Good) | 494 (Good) | 554 (Good) | 563 (Good) | 930 (Good) | 765 (Good) | 611 (Good) | 618 (Good) | 677 (Good) | 613 (Good) | 513 (Good) | 535 (Good) | 486 (Good) | 627 (Good) | 578 (Good) | 723 (Good) | 882 (Good) | 744 (Good) | 784 (Good) | 469 (Good) |
| no2 | 20 (Good) | 30 (Good) | 30 (Good) | 17 (Good) | 33 (Good) | 52 (Moderate) | 40 (Good) | 31 (Good) | 21 (Good) | 15 (Good) | 14 (Good) | 15 (Good) | 18 (Good) | 23 (Good) | 34 (Good) | 28 (Good) | 46 (Moderate) | 43 (Moderate) | 39 (Good) | 31 (Good) |
| o3 | 134 (Unhealthy for Sensitive Groups) | 140 (Unhealthy for Sensitive Groups) | 111 (Moderate) | 90 (Moderate) | 70 (Good) | 68 (Good) | 99 (Moderate) | 117 (Moderate) | 144 (Unhealthy for Sensitive Groups) | 152 (Unhealthy) | 154 (Unhealthy) | 182 (Very Unhealthy) | 163 (Unhealthy) | 131 (Unhealthy for Sensitive Groups) | 120 (Unhealthy for Sensitive Groups) | 85 (Moderate) | 70 (Good) | 60 (Good) | 96 (Moderate) | 121 (Unhealthy for Sensitive Groups) |
| pm10 | 65 (Unhealthy for Sensitive Groups) | 81 (Unhealthy) | 82 (Unhealthy) | 66 (Unhealthy for Sensitive Groups) | 106 (Unhealthy) | 109 (Unhealthy) | 114 (Very Unhealthy) | 103 (Unhealthy) | 64 (Unhealthy for Sensitive Groups) | 41 (Moderate) | 46 (Moderate) | 58 (Unhealthy for Sensitive Groups) | 78 (Unhealthy for Sensitive Groups) | 92 (Unhealthy) | 117 (Very Unhealthy) | 102 (Unhealthy) | 139 (Very Unhealthy) | 107 (Unhealthy) | 120 (Very Unhealthy) | 85 (Unhealthy) |
| so2 | 11 (Good) | 15 (Good) | 12 (Good) | 8 (Good) | 9.8 (Good) | 15 (Good) | 19 (Good) | 17 (Good) | 18 (Good) | 11 (Good) | 9.7 (Good) | 8.5 (Good) | 15 (Good) | 12 (Good) | 15 (Good) | 8.2 (Good) | 15 (Good) | 14 (Good) | 17 (Good) | 9.7 (Good) |
PM10 6.7 (Good)
particulate matter (PM10) suspended dustPM2,5 1.7 (Good)
particulate matter (PM2.5) dustCO 100 (Good)
carbon monoxide (CO)NO2 7.6 (Good)
nitrogen dioxide (NO2)O3 0.02 (Good)
ozone (O3)SO2 8.6 (Good)
sulfur dioxide (SO2)Huainan Xie Jia Ji Qu Zheng Fu
| index | 2022-05-27 |
|---|---|
| pm10 | 32 |
| pm25 | 24 |
| co | 468 |
| no2 | 21 |
| o3 | 32 |
| so2 | 4.6 |
谢家集区政府
| index | 2020-05 | 2020-04 | 2020-03 | 2020-02 | 2020-01 | 2019-12 | 2019-11 | 2019-10 | 2019-09 | 2019-08 | 2019-07 | 2019-06 | 2019-05 | 2019-04 | 2019-03 | 2019-02 | 2019-01 | 2018-12 | 2018-11 | 2018-10 |
|---|---|---|---|---|---|---|---|---|---|---|---|---|---|---|---|---|---|---|---|---|
| pm25 | 33 | 41 | 48 | 49 | 85 | 77 | 63 | 50 | 31 | 20 | 23 | 27 | 33 | 52 | 68 | 80 | 99 | 73 | 83 | 46 |
| co | 524 | 494 | 554 | 563 | 930 | 765 | 611 | 618 | 677 | 613 | 513 | 535 | 486 | 627 | 578 | 723 | 882 | 744 | 784 | 469 |
| no2 | 20 | 30 | 30 | 17 | 33 | 52 | 40 | 31 | 21 | 15 | 14 | 15 | 18 | 23 | 34 | 28 | 46 | 43 | 39 | 31 |
| o3 | 134 | 140 | 111 | 90 | 70 | 68 | 99 | 117 | 144 | 152 | 154 | 182 | 163 | 131 | 120 | 85 | 70 | 60 | 96 | 121 |
| pm10 | 65 | 81 | 82 | 66 | 106 | 109 | 114 | 103 | 64 | 41 | 46 | 58 | 78 | 92 | 117 | 102 | 139 | 107 | 120 | 85 |
| so2 | 11 | 15 | 12 | 8 | 9.8 | 15 | 19 | 17 | 18 | 11 | 9.7 | 8.5 | 15 | 12 | 15 | 8.2 | 15 | 14 | 17 | 9.7 |