Air Pollution in Chengdu: Real-time Air Quality Index and smog alert.
Pollution and air quality forecast for Chengdu. Today is Tuesday, June 16, 2026. The following air pollution values have been recorded for Chengdu:- particulate matter (PM2.5) dust - 61 (Unhealthy)
- nitrogen dioxide (NO2) - 22 (Good)
- particulate matter (PM10) suspended dust - 69 (Unhealthy for Sensitive Groups)
- carbon monoxide (CO) - 219 (Good)
- ozone (O3) - 0 (Good)
- sulfur dioxide (SO2) - 8 (Good)

What is the air quality in Chengdu today? Is the air polluted in Chengdu?. Is there smog?
What is the current level of PM2.5 in Chengdu? (particulate matter (PM2.5) dust)
Today's PM2.5 level is:
61 (Unhealthy)
For comparison, the highest level of PM2.5 in Chengdu in the last 7 days was: 28 (Friday, May 27, 2022) and the lowest: 28 (Friday, May 27, 2022).
The highest PM2.5 values were recorded: 84 (January 2019).
The lowest level of particulate matter PM2.5 pollution occurs in month: July (24).
How high is the level of NO2? (nitrogen dioxide (NO2))
22 (Good)
What is the level of PM10 today in Chengdu? (particulate matter (PM10) suspended dust)
The current level of particulate matter PM10 in Chengdu is:
69 (Unhealthy for Sensitive Groups)
The highest PM10 values usually occur in month: 115 (January 2019).
The lowest value of particulate matter PM10 pollution in Chengdu is usually recorded in: June (44).
How high is the CO level? (carbon monoxide (CO))
219 (Good)
How is the O3 level today in Chengdu? (ozone (O3))
0 (Good)
What is the level of SO2 pollution? (sulfur dioxide (SO2))
8 (Good)
Current data Friday, May 27, 2022, 3:00 PM
PM2,5 61 (Unhealthy)
NO2 22 (Good)
PM10 69 (Unhealthy for Sensitive Groups)
CO 219 (Good)
O3 0 (Good)
SO2 8 (Good)
Data on air pollution from recent days in Chengdu
index
2022-05-27
pm25
28
Moderate
no2
22
Good
pm10
35
Moderate
co
579
Good
o3
22
Good
so2
5
Good
data source »
Air pollution in Chengdu from October 2018 to May 2020

index
2020-05
2020-04
2020-03
2020-02
2020-01
2019-12
2019-11
2019-10
2019-09
2019-08
2019-07
2019-06
2019-05
2019-04
2019-03
2019-02
2019-01
2018-12
2018-11
2018-10
pm25
44 (Unhealthy for Sensitive Groups)
44 (Unhealthy for Sensitive Groups)
45 (Unhealthy for Sensitive Groups)
56 (Unhealthy)
72 (Unhealthy)
84 (Very Unhealthy)
53 (Unhealthy for Sensitive Groups)
34 (Moderate)
32 (Moderate)
30 (Moderate)
24 (Moderate)
27 (Moderate)
41 (Unhealthy for Sensitive Groups)
46 (Unhealthy for Sensitive Groups)
47 (Unhealthy for Sensitive Groups)
59 (Unhealthy)
84 (Very Unhealthy)
65 (Unhealthy)
59 (Unhealthy)
56 (Unhealthy)
co
582 (Good)
677 (Good)
550 (Good)
654 (Good)
827 (Good)
847 (Good)
787 (Good)
569 (Good)
780 (Good)
638 (Good)
610 (Good)
568 (Good)
650 (Good)
700 (Good)
739 (Good)
892 (Good)
789 (Good)
797 (Good)
787 (Good)
906 (Good)
no2
38 (Good)
47 (Moderate)
41 (Moderate)
23 (Good)
44 (Moderate)
58 (Moderate)
44 (Moderate)
39 (Good)
37 (Good)
39 (Good)
38 (Good)
30 (Good)
40 (Good)
41 (Moderate)
53 (Moderate)
42 (Moderate)
45 (Moderate)
50 (Moderate)
52 (Moderate)
57 (Moderate)
o3
194 (Very Unhealthy)
131 (Unhealthy for Sensitive Groups)
105 (Moderate)
91 (Moderate)
61 (Good)
54 (Good)
53 (Good)
73 (Moderate)
93 (Moderate)
175 (Unhealthy)
130 (Unhealthy for Sensitive Groups)
145 (Unhealthy for Sensitive Groups)
134 (Unhealthy for Sensitive Groups)
131 (Unhealthy for Sensitive Groups)
86 (Moderate)
60 (Good)
53 (Good)
33 (Good)
56 (Good)
70 (Moderate)
pm10
78 (Unhealthy for Sensitive Groups)
71 (Unhealthy for Sensitive Groups)
75 (Unhealthy for Sensitive Groups)
71 (Unhealthy for Sensitive Groups)
85 (Unhealthy)
110 (Very Unhealthy)
80 (Unhealthy for Sensitive Groups)
55 (Unhealthy for Sensitive Groups)
60 (Unhealthy for Sensitive Groups)
67 (Unhealthy for Sensitive Groups)
46 (Moderate)
44 (Moderate)
59 (Unhealthy for Sensitive Groups)
72 (Unhealthy for Sensitive Groups)
74 (Unhealthy for Sensitive Groups)
76 (Unhealthy for Sensitive Groups)
115 (Very Unhealthy)
100 (Unhealthy)
88 (Unhealthy)
85 (Unhealthy)
so2
5.6 (Good)
4.9 (Good)
6.8 (Good)
5.9 (Good)
7.9 (Good)
10 (Good)
8.2 (Good)
7 (Good)
7.1 (Good)
5.4 (Good)
4.1 (Good)
3.4 (Good)
3.9 (Good)
4.7 (Good)
3.9 (Good)
3.6 (Good)
3.3 (Good)
5.2 (Good)
5.3 (Good)
6.3 (Good)
data source »
Quality of life in Chengdu
Green and Parks in the City
Chengdu
60%
Mongolia: 27%
Bhutan: 82%
Hong Kong: 52%
Myanmar: 33%
particulate matter PM2.5
Chengdu
63 (Unhealthy)
Pleasure of spending time in the city
Chengdu
40%
Mongolia: 22%
Bhutan: 61%
Hong Kong: 43%
Myanmar: 24%
particulate matter PM10
Chengdu
110 (Unhealthy)
Air Pollution
Chengdu
77%
Mongolia: 87%
Bhutan: 45%
Hong Kong: 67%
Myanmar: 83%
Garbage Disposal
Chengdu
48%
Mongolia: 27%
Bhutan: 47%
Hong Kong: 52%
Myanmar: 12%
Availability and quality of drinking water
Chengdu
51%
Mongolia: 46%
Bhutan: 64%
Hong Kong: 66%
Myanmar: 34%
Cleanliness and tidiness
Chengdu
59%
Mongolia: 29%
Bhutan: 57%
Hong Kong: 54%
Myanmar: 18%
Noise and Light pollution
Chengdu
50%
Mongolia: 48%
Bhutan: 55%
Hong Kong: 66%
Myanmar: 52%
Water Pollution
Chengdu
59%
Mongolia: 68%
Bhutan: 56%
Hong Kong: 53%
Myanmar: 74%
Source: Numbeo
君平街
Friday, May 27, 2022, 3:00 PM
PM2,5 61 (Unhealthy)
particulate matter (PM2.5) dust
NO2 22 (Good)
nitrogen dioxide (NO2)
PM10 69 (Unhealthy for Sensitive Groups)
particulate matter (PM10) suspended dust
CO 219 (Good)
carbon monoxide (CO)
O3 0.05 (Good)
ozone (O3)
SO2 7.7 (Good)
sulfur dioxide (SO2)
君平街
index
2022-05-27
pm25
28
no2
22
pm10
35
co
579
o3
22
so2
4.6
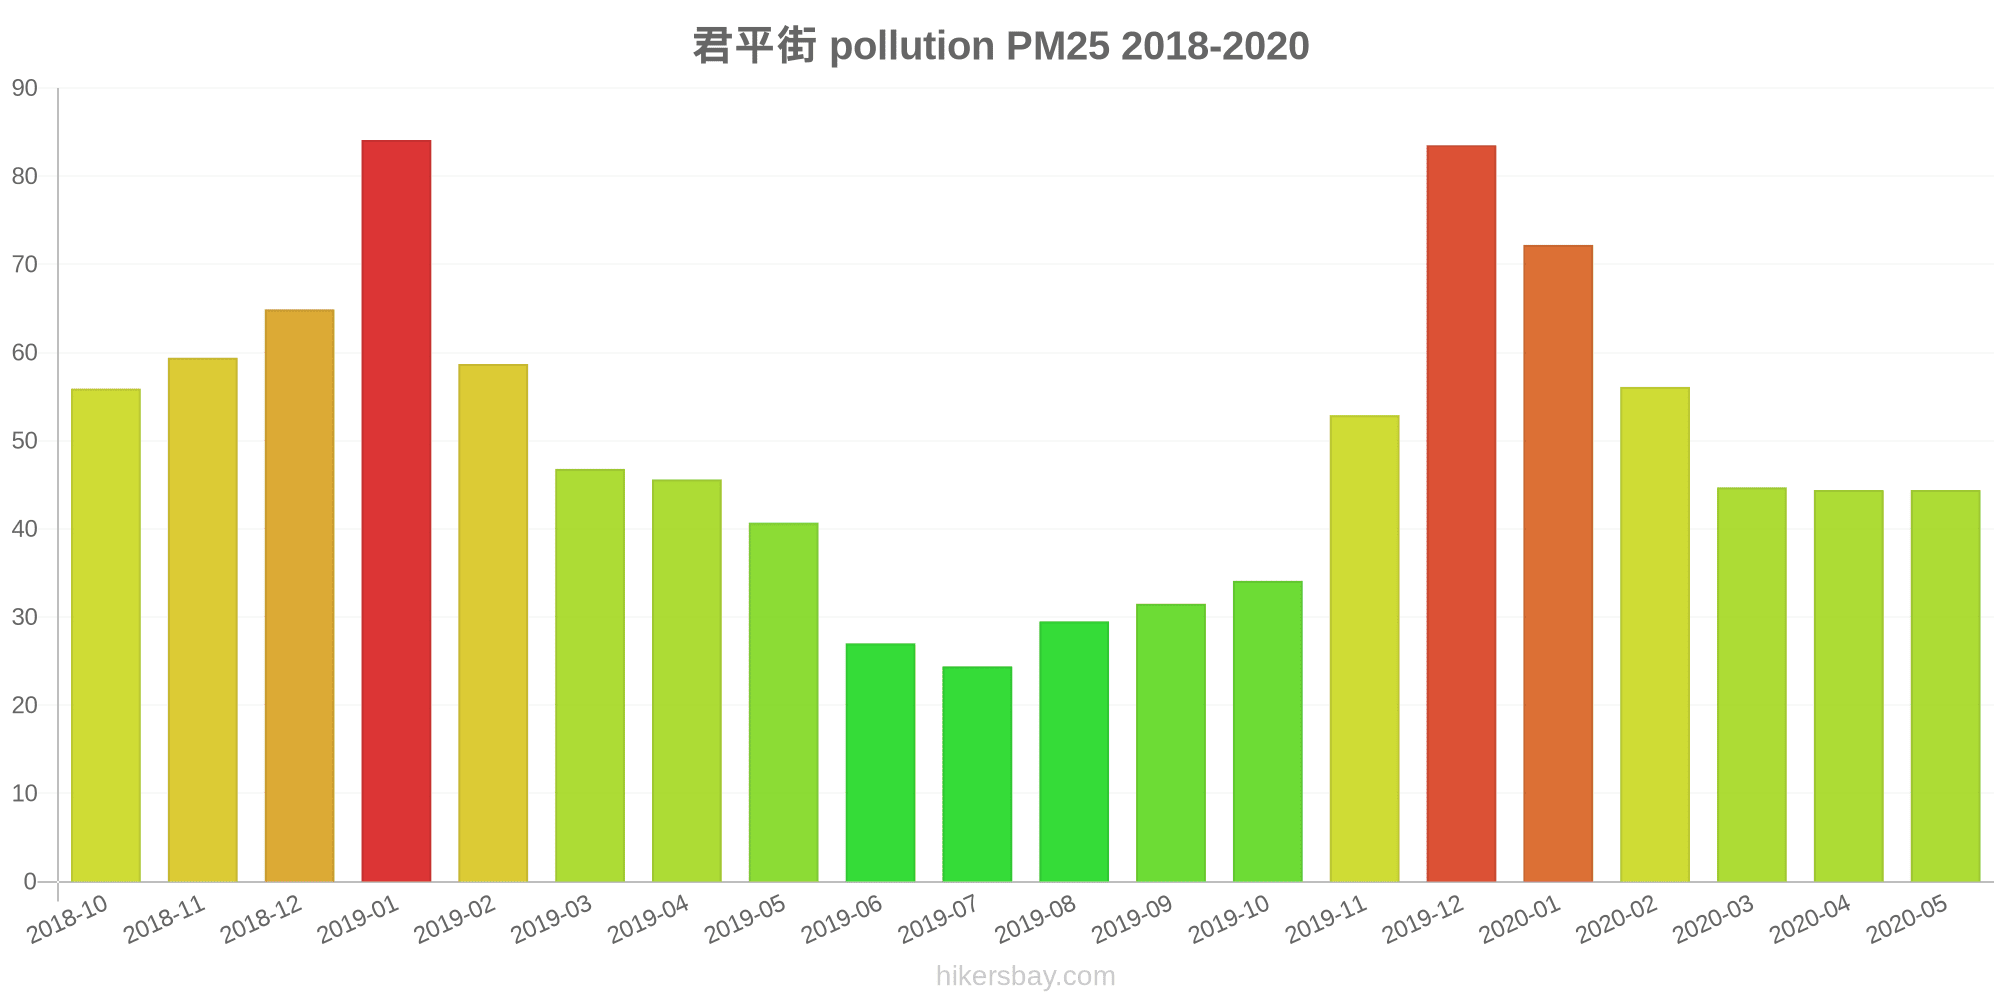
君平街
2018-10 2020-05

index
2020-05
2020-04
2020-03
2020-02
2020-01
2019-12
2019-11
2019-10
2019-09
2019-08
2019-07
2019-06
2019-05
2019-04
2019-03
2019-02
2019-01
2018-12
2018-11
2018-10
pm25
44
44
45
56
72
84
53
34
32
30
24
27
41
46
47
59
84
65
59
56
co
582
677
550
654
827
847
787
569
780
638
610
568
650
700
739
892
789
797
787
906
no2
38
47
41
23
44
58
44
39
37
39
38
30
40
41
53
42
45
50
52
57
o3
194
131
105
91
61
54
53
73
93
175
130
145
134
131
86
60
53
33
56
70
pm10
78
71
75
71
85
110
80
55
60
67
46
44
59
72
74
76
115
100
88
85
so2
5.6
4.9
6.8
5.9
7.9
10
8.2
7
7.1
5.4
4.1
3.4
3.9
4.7
3.9
3.6
3.3
5.2
5.3
6.3
* Pollution data source:
https://openaq.org
(ChinaAQIData)
The data is licensed under CC-By 4.0
PM2,5 61 (Unhealthy)
NO2 22 (Good)
PM10 69 (Unhealthy for Sensitive Groups)
CO 219 (Good)
O3 0 (Good)
SO2 8 (Good)
Data on air pollution from recent days in Chengdu
| index | 2022-05-27 |
|---|---|
| pm25 | 28 Moderate |
| no2 | 22 Good |
| pm10 | 35 Moderate |
| co | 579 Good |
| o3 | 22 Good |
| so2 | 5 Good |

| index | 2020-05 | 2020-04 | 2020-03 | 2020-02 | 2020-01 | 2019-12 | 2019-11 | 2019-10 | 2019-09 | 2019-08 | 2019-07 | 2019-06 | 2019-05 | 2019-04 | 2019-03 | 2019-02 | 2019-01 | 2018-12 | 2018-11 | 2018-10 |
|---|---|---|---|---|---|---|---|---|---|---|---|---|---|---|---|---|---|---|---|---|
| pm25 | 44 (Unhealthy for Sensitive Groups) | 44 (Unhealthy for Sensitive Groups) | 45 (Unhealthy for Sensitive Groups) | 56 (Unhealthy) | 72 (Unhealthy) | 84 (Very Unhealthy) | 53 (Unhealthy for Sensitive Groups) | 34 (Moderate) | 32 (Moderate) | 30 (Moderate) | 24 (Moderate) | 27 (Moderate) | 41 (Unhealthy for Sensitive Groups) | 46 (Unhealthy for Sensitive Groups) | 47 (Unhealthy for Sensitive Groups) | 59 (Unhealthy) | 84 (Very Unhealthy) | 65 (Unhealthy) | 59 (Unhealthy) | 56 (Unhealthy) |
| co | 582 (Good) | 677 (Good) | 550 (Good) | 654 (Good) | 827 (Good) | 847 (Good) | 787 (Good) | 569 (Good) | 780 (Good) | 638 (Good) | 610 (Good) | 568 (Good) | 650 (Good) | 700 (Good) | 739 (Good) | 892 (Good) | 789 (Good) | 797 (Good) | 787 (Good) | 906 (Good) |
| no2 | 38 (Good) | 47 (Moderate) | 41 (Moderate) | 23 (Good) | 44 (Moderate) | 58 (Moderate) | 44 (Moderate) | 39 (Good) | 37 (Good) | 39 (Good) | 38 (Good) | 30 (Good) | 40 (Good) | 41 (Moderate) | 53 (Moderate) | 42 (Moderate) | 45 (Moderate) | 50 (Moderate) | 52 (Moderate) | 57 (Moderate) |
| o3 | 194 (Very Unhealthy) | 131 (Unhealthy for Sensitive Groups) | 105 (Moderate) | 91 (Moderate) | 61 (Good) | 54 (Good) | 53 (Good) | 73 (Moderate) | 93 (Moderate) | 175 (Unhealthy) | 130 (Unhealthy for Sensitive Groups) | 145 (Unhealthy for Sensitive Groups) | 134 (Unhealthy for Sensitive Groups) | 131 (Unhealthy for Sensitive Groups) | 86 (Moderate) | 60 (Good) | 53 (Good) | 33 (Good) | 56 (Good) | 70 (Moderate) |
| pm10 | 78 (Unhealthy for Sensitive Groups) | 71 (Unhealthy for Sensitive Groups) | 75 (Unhealthy for Sensitive Groups) | 71 (Unhealthy for Sensitive Groups) | 85 (Unhealthy) | 110 (Very Unhealthy) | 80 (Unhealthy for Sensitive Groups) | 55 (Unhealthy for Sensitive Groups) | 60 (Unhealthy for Sensitive Groups) | 67 (Unhealthy for Sensitive Groups) | 46 (Moderate) | 44 (Moderate) | 59 (Unhealthy for Sensitive Groups) | 72 (Unhealthy for Sensitive Groups) | 74 (Unhealthy for Sensitive Groups) | 76 (Unhealthy for Sensitive Groups) | 115 (Very Unhealthy) | 100 (Unhealthy) | 88 (Unhealthy) | 85 (Unhealthy) |
| so2 | 5.6 (Good) | 4.9 (Good) | 6.8 (Good) | 5.9 (Good) | 7.9 (Good) | 10 (Good) | 8.2 (Good) | 7 (Good) | 7.1 (Good) | 5.4 (Good) | 4.1 (Good) | 3.4 (Good) | 3.9 (Good) | 4.7 (Good) | 3.9 (Good) | 3.6 (Good) | 3.3 (Good) | 5.2 (Good) | 5.3 (Good) | 6.3 (Good) |
Green and Parks in the City
Chengdu 60%
Mongolia: 27% Bhutan: 82% Hong Kong: 52% Myanmar: 33%particulate matter PM2.5
Chengdu 63 (Unhealthy)
Pleasure of spending time in the city
Chengdu 40%
Mongolia: 22% Bhutan: 61% Hong Kong: 43% Myanmar: 24%particulate matter PM10
Chengdu 110 (Unhealthy)
Air Pollution
Chengdu 77%
Mongolia: 87% Bhutan: 45% Hong Kong: 67% Myanmar: 83%Garbage Disposal
Chengdu 48%
Mongolia: 27% Bhutan: 47% Hong Kong: 52% Myanmar: 12%Availability and quality of drinking water
Chengdu 51%
Mongolia: 46% Bhutan: 64% Hong Kong: 66% Myanmar: 34%Cleanliness and tidiness
Chengdu 59%
Mongolia: 29% Bhutan: 57% Hong Kong: 54% Myanmar: 18%Noise and Light pollution
Chengdu 50%
Mongolia: 48% Bhutan: 55% Hong Kong: 66% Myanmar: 52%Water Pollution
Chengdu 59%
Mongolia: 68% Bhutan: 56% Hong Kong: 53% Myanmar: 74%PM2,5 61 (Unhealthy)
particulate matter (PM2.5) dustNO2 22 (Good)
nitrogen dioxide (NO2)PM10 69 (Unhealthy for Sensitive Groups)
particulate matter (PM10) suspended dustCO 219 (Good)
carbon monoxide (CO)O3 0.05 (Good)
ozone (O3)SO2 7.7 (Good)
sulfur dioxide (SO2)君平街
| index | 2022-05-27 |
|---|---|
| pm25 | 28 |
| no2 | 22 |
| pm10 | 35 |
| co | 579 |
| o3 | 22 |
| so2 | 4.6 |
君平街
| index | 2020-05 | 2020-04 | 2020-03 | 2020-02 | 2020-01 | 2019-12 | 2019-11 | 2019-10 | 2019-09 | 2019-08 | 2019-07 | 2019-06 | 2019-05 | 2019-04 | 2019-03 | 2019-02 | 2019-01 | 2018-12 | 2018-11 | 2018-10 |
|---|---|---|---|---|---|---|---|---|---|---|---|---|---|---|---|---|---|---|---|---|
| pm25 | 44 | 44 | 45 | 56 | 72 | 84 | 53 | 34 | 32 | 30 | 24 | 27 | 41 | 46 | 47 | 59 | 84 | 65 | 59 | 56 |
| co | 582 | 677 | 550 | 654 | 827 | 847 | 787 | 569 | 780 | 638 | 610 | 568 | 650 | 700 | 739 | 892 | 789 | 797 | 787 | 906 |
| no2 | 38 | 47 | 41 | 23 | 44 | 58 | 44 | 39 | 37 | 39 | 38 | 30 | 40 | 41 | 53 | 42 | 45 | 50 | 52 | 57 |
| o3 | 194 | 131 | 105 | 91 | 61 | 54 | 53 | 73 | 93 | 175 | 130 | 145 | 134 | 131 | 86 | 60 | 53 | 33 | 56 | 70 |
| pm10 | 78 | 71 | 75 | 71 | 85 | 110 | 80 | 55 | 60 | 67 | 46 | 44 | 59 | 72 | 74 | 76 | 115 | 100 | 88 | 85 |
| so2 | 5.6 | 4.9 | 6.8 | 5.9 | 7.9 | 10 | 8.2 | 7 | 7.1 | 5.4 | 4.1 | 3.4 | 3.9 | 4.7 | 3.9 | 3.6 | 3.3 | 5.2 | 5.3 | 6.3 |