Air Pollution in Lujiayuan: Real-time Air Quality Index and smog alert.
Pollution and air quality forecast for Lujiayuan. Today is Tuesday, June 2, 2026. The following air pollution values have been recorded for Lujiayuan:- particulate matter (PM10) suspended dust - 179 (Very bad Hazardous)
- particulate matter (PM2.5) dust - 35 (Unhealthy for Sensitive Groups)
- ozone (O3) - 0 (Good)
- nitrogen dioxide (NO2) - 0 (Good)
- sulfur dioxide (SO2) - 0 (Good)

What is the air quality in Lujiayuan today? Is the air polluted in Lujiayuan?. Is there smog?
What is the level of PM10 today in Lujiayuan? (particulate matter (PM10) suspended dust)
The current level of particulate matter PM10 in Lujiayuan is:
179 (Very bad Hazardous)
The highest PM10 values usually occur in month: 215 (January 2019).
The lowest value of particulate matter PM10 pollution in Lujiayuan is usually recorded in: August (63).
What is the current level of PM2.5 in Lujiayuan? (particulate matter (PM2.5) dust)
Today's PM2.5 level is:
35 (Unhealthy for Sensitive Groups)
For comparison, the highest level of PM2.5 in Lujiayuan in the last 7 days was: 56 (Friday, May 27, 2022) and the lowest: 56 (Friday, May 27, 2022).
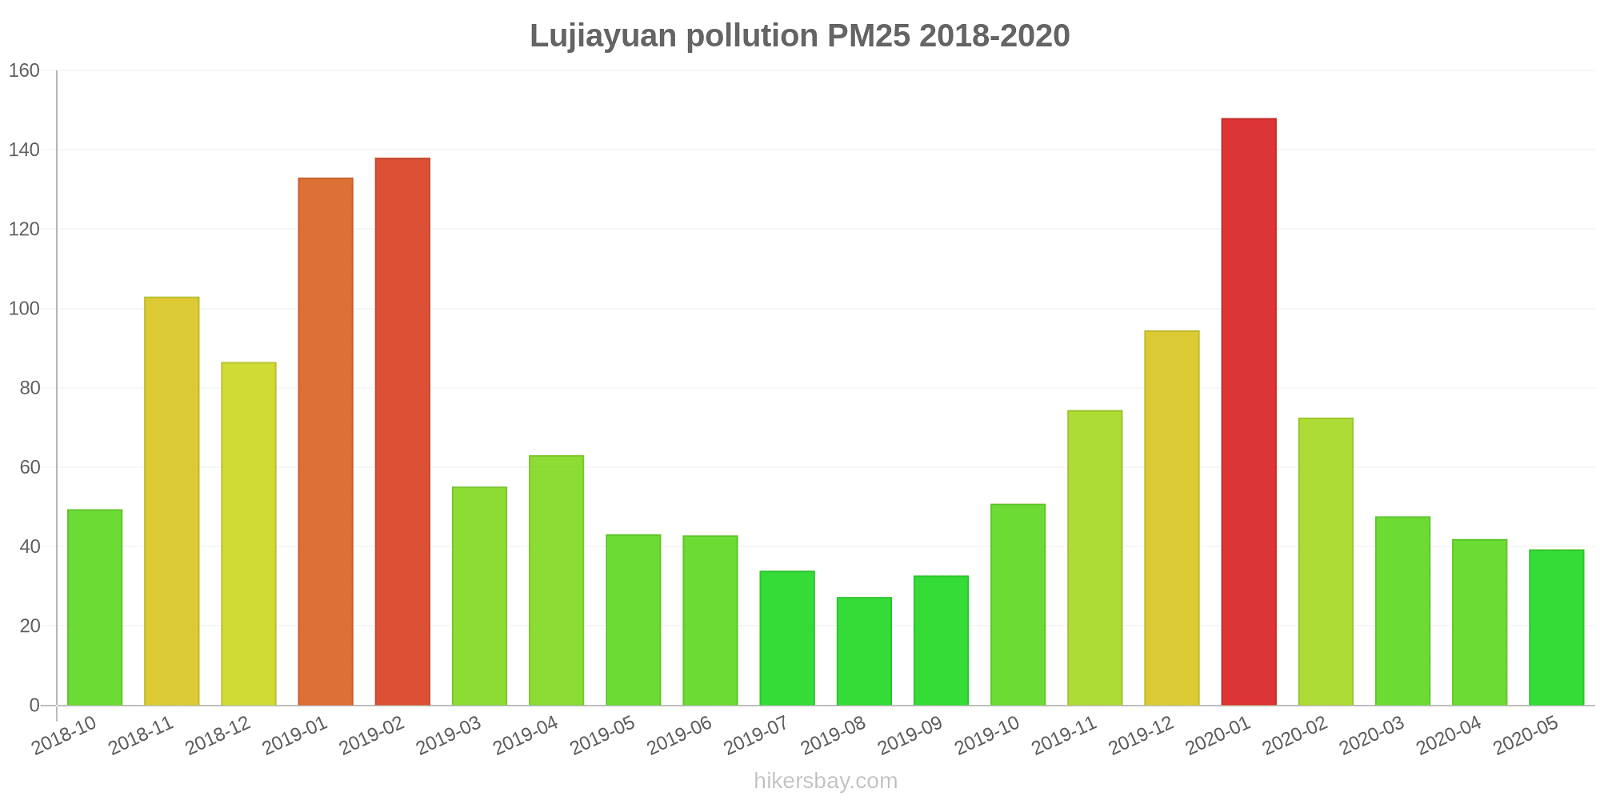
The highest PM2.5 values were recorded: 148 (January 2020).
The lowest level of particulate matter PM2.5 pollution occurs in month: August (27).
How is the O3 level today in Lujiayuan? (ozone (O3))
0 (Good)
How high is the level of NO2? (nitrogen dioxide (NO2))
0 (Good)
What is the level of SO2 pollution? (sulfur dioxide (SO2))
0 (Good)
Current data Friday, May 27, 2022, 12:00 PM
PM10 179 (Very bad Hazardous)
PM2,5 35 (Unhealthy for Sensitive Groups)
O3 0 (Good)
NO2 0 (Good)
SO2 0 (Good)
Data on air pollution from recent days in Lujiayuan
index
2022-05-27
pm10
56
Unhealthy for Sensitive Groups
pm25
56
Unhealthy
o3
0
Good
no2
0
Good
so2
0
Good
data source »
Air pollution in Lujiayuan from October 2018 to May 2020
index
2020-05
2020-04
2020-03
2020-02
2020-01
2019-12
2019-11
2019-10
2019-09
2019-08
2019-07
2019-06
2019-05
2019-04
2019-03
2019-02
2019-01
2018-12
2018-11
2018-10
pm25
39 (Unhealthy for Sensitive Groups)
42 (Unhealthy for Sensitive Groups)
48 (Unhealthy for Sensitive Groups)
73 (Unhealthy)
148 (Very bad Hazardous)
95 (Very Unhealthy)
74 (Unhealthy)
51 (Unhealthy for Sensitive Groups)
33 (Moderate)
27 (Moderate)
34 (Moderate)
43 (Unhealthy for Sensitive Groups)
43 (Unhealthy for Sensitive Groups)
63 (Unhealthy)
55 (Unhealthy)
138 (Very bad Hazardous)
133 (Very bad Hazardous)
87 (Very Unhealthy)
103 (Very Unhealthy)
49 (Unhealthy for Sensitive Groups)
co
784 (Good)
927 (Good)
1 (Good)
1 (Good)
2 (Good)
1 (Good)
1 (Good)
1 (Good)
1 (Good)
916 (Good)
888 (Good)
903 (Good)
997 (Good)
997 (Good)
987 (Good)
1 (Good)
2 (Good)
1 (Good)
1 (Good)
1 (Good)
no2
25 (Good)
38 (Good)
38 (Good)
25 (Good)
55 (Moderate)
56 (Moderate)
63 (Moderate)
50 (Moderate)
43 (Moderate)
34 (Good)
32 (Good)
38 (Good)
46 (Moderate)
48 (Moderate)
48 (Moderate)
54 (Moderate)
76 (Moderate)
60 (Moderate)
64 (Moderate)
63 (Moderate)
o3
144 (Unhealthy for Sensitive Groups)
134 (Unhealthy for Sensitive Groups)
106 (Moderate)
86 (Moderate)
60 (Good)
38 (Good)
55 (Good)
97 (Moderate)
164 (Unhealthy)
158 (Unhealthy)
210 (Very Unhealthy)
212 (Very Unhealthy)
174 (Unhealthy)
130 (Unhealthy for Sensitive Groups)
123 (Unhealthy for Sensitive Groups)
85 (Moderate)
46 (Good)
41 (Good)
67 (Good)
98 (Moderate)
pm10
71 (Unhealthy for Sensitive Groups)
97 (Unhealthy)
107 (Unhealthy)
105 (Unhealthy)
203 (Very bad Hazardous)
154 (Very bad Hazardous)
165 (Very bad Hazardous)
122 (Very Unhealthy)
84 (Unhealthy)
63 (Unhealthy for Sensitive Groups)
83 (Unhealthy)
91 (Unhealthy)
109 (Unhealthy)
134 (Very Unhealthy)
122 (Very Unhealthy)
196 (Very bad Hazardous)
215 (Very bad Hazardous)
173 (Very bad Hazardous)
198 (Very bad Hazardous)
134 (Very Unhealthy)
so2
17 (Good)
18 (Good)
15 (Good)
14 (Good)
20 (Good)
16 (Good)
17 (Good)
12 (Good)
14 (Good)
13 (Good)
16 (Good)
17 (Good)
26 (Good)
24 (Good)
19 (Good)
29 (Good)
40 (Good)
25 (Good)
23 (Good)
30 (Good)
data source »
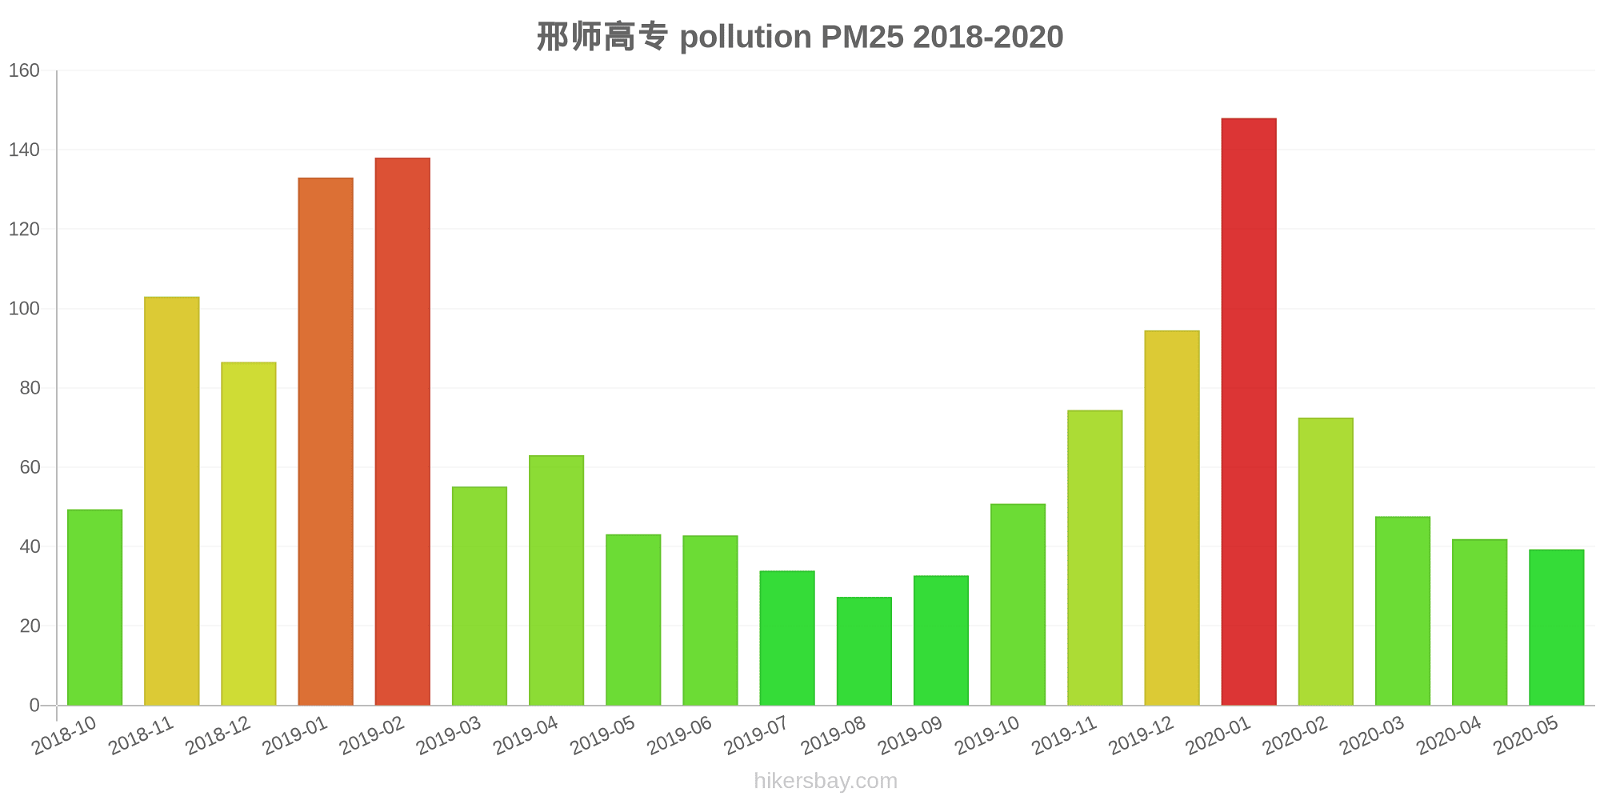
邢师高专
Friday, May 27, 2022, 12:00 PM
PM10 179 (Very bad Hazardous)
particulate matter (PM10) suspended dust
PM2,5 35 (Unhealthy for Sensitive Groups)
particulate matter (PM2.5) dust
O3 0.04 (Good)
ozone (O3)
NO2 0 (Good)
nitrogen dioxide (NO2)
SO2 0 (Good)
sulfur dioxide (SO2)
邢师高专
index
2022-05-27
pm10
56
pm25
56
o3
0.03
no2
0
so2
0
邢师高专
2018-10 2020-05
index
2020-05
2020-04
2020-03
2020-02
2020-01
2019-12
2019-11
2019-10
2019-09
2019-08
2019-07
2019-06
2019-05
2019-04
2019-03
2019-02
2019-01
2018-12
2018-11
2018-10
pm25
39
42
48
73
148
95
74
51
33
27
34
43
43
63
55
138
133
87
103
49
co
784
927
1
1
2
1
1
1
1
916
888
903
997
997
987
1
2
1
1
1
no2
25
38
38
25
55
56
63
50
43
34
32
38
46
48
48
54
76
60
64
63
o3
144
134
106
86
60
38
55
97
164
158
210
212
174
130
123
85
46
41
67
98
pm10
71
97
107
105
203
154
165
122
84
63
83
91
109
134
122
196
215
173
198
134
so2
17
18
15
14
20
16
17
12
14
13
16
17
26
24
19
29
40
25
23
30
* Pollution data source:
https://openaq.org
(ChinaAQIData)
The data is licensed under CC-By 4.0
PM10 179 (Very bad Hazardous)
PM2,5 35 (Unhealthy for Sensitive Groups)
O3 0 (Good)
NO2 0 (Good)
SO2 0 (Good)
Data on air pollution from recent days in Lujiayuan
| index | 2022-05-27 |
|---|---|
| pm10 | 56 Unhealthy for Sensitive Groups |
| pm25 | 56 Unhealthy |
| o3 | 0 Good |
| no2 | 0 Good |
| so2 | 0 Good |

| index | 2020-05 | 2020-04 | 2020-03 | 2020-02 | 2020-01 | 2019-12 | 2019-11 | 2019-10 | 2019-09 | 2019-08 | 2019-07 | 2019-06 | 2019-05 | 2019-04 | 2019-03 | 2019-02 | 2019-01 | 2018-12 | 2018-11 | 2018-10 |
|---|---|---|---|---|---|---|---|---|---|---|---|---|---|---|---|---|---|---|---|---|
| pm25 | 39 (Unhealthy for Sensitive Groups) | 42 (Unhealthy for Sensitive Groups) | 48 (Unhealthy for Sensitive Groups) | 73 (Unhealthy) | 148 (Very bad Hazardous) | 95 (Very Unhealthy) | 74 (Unhealthy) | 51 (Unhealthy for Sensitive Groups) | 33 (Moderate) | 27 (Moderate) | 34 (Moderate) | 43 (Unhealthy for Sensitive Groups) | 43 (Unhealthy for Sensitive Groups) | 63 (Unhealthy) | 55 (Unhealthy) | 138 (Very bad Hazardous) | 133 (Very bad Hazardous) | 87 (Very Unhealthy) | 103 (Very Unhealthy) | 49 (Unhealthy for Sensitive Groups) |
| co | 784 (Good) | 927 (Good) | 1 (Good) | 1 (Good) | 2 (Good) | 1 (Good) | 1 (Good) | 1 (Good) | 1 (Good) | 916 (Good) | 888 (Good) | 903 (Good) | 997 (Good) | 997 (Good) | 987 (Good) | 1 (Good) | 2 (Good) | 1 (Good) | 1 (Good) | 1 (Good) |
| no2 | 25 (Good) | 38 (Good) | 38 (Good) | 25 (Good) | 55 (Moderate) | 56 (Moderate) | 63 (Moderate) | 50 (Moderate) | 43 (Moderate) | 34 (Good) | 32 (Good) | 38 (Good) | 46 (Moderate) | 48 (Moderate) | 48 (Moderate) | 54 (Moderate) | 76 (Moderate) | 60 (Moderate) | 64 (Moderate) | 63 (Moderate) |
| o3 | 144 (Unhealthy for Sensitive Groups) | 134 (Unhealthy for Sensitive Groups) | 106 (Moderate) | 86 (Moderate) | 60 (Good) | 38 (Good) | 55 (Good) | 97 (Moderate) | 164 (Unhealthy) | 158 (Unhealthy) | 210 (Very Unhealthy) | 212 (Very Unhealthy) | 174 (Unhealthy) | 130 (Unhealthy for Sensitive Groups) | 123 (Unhealthy for Sensitive Groups) | 85 (Moderate) | 46 (Good) | 41 (Good) | 67 (Good) | 98 (Moderate) |
| pm10 | 71 (Unhealthy for Sensitive Groups) | 97 (Unhealthy) | 107 (Unhealthy) | 105 (Unhealthy) | 203 (Very bad Hazardous) | 154 (Very bad Hazardous) | 165 (Very bad Hazardous) | 122 (Very Unhealthy) | 84 (Unhealthy) | 63 (Unhealthy for Sensitive Groups) | 83 (Unhealthy) | 91 (Unhealthy) | 109 (Unhealthy) | 134 (Very Unhealthy) | 122 (Very Unhealthy) | 196 (Very bad Hazardous) | 215 (Very bad Hazardous) | 173 (Very bad Hazardous) | 198 (Very bad Hazardous) | 134 (Very Unhealthy) |
| so2 | 17 (Good) | 18 (Good) | 15 (Good) | 14 (Good) | 20 (Good) | 16 (Good) | 17 (Good) | 12 (Good) | 14 (Good) | 13 (Good) | 16 (Good) | 17 (Good) | 26 (Good) | 24 (Good) | 19 (Good) | 29 (Good) | 40 (Good) | 25 (Good) | 23 (Good) | 30 (Good) |
PM10 179 (Very bad Hazardous)
particulate matter (PM10) suspended dustPM2,5 35 (Unhealthy for Sensitive Groups)
particulate matter (PM2.5) dustO3 0.04 (Good)
ozone (O3)NO2 0 (Good)
nitrogen dioxide (NO2)SO2 0 (Good)
sulfur dioxide (SO2)邢师高专
| index | 2022-05-27 |
|---|---|
| pm10 | 56 |
| pm25 | 56 |
| o3 | 0.03 |
| no2 | 0 |
| so2 | 0 |
邢师高专

| index | 2020-05 | 2020-04 | 2020-03 | 2020-02 | 2020-01 | 2019-12 | 2019-11 | 2019-10 | 2019-09 | 2019-08 | 2019-07 | 2019-06 | 2019-05 | 2019-04 | 2019-03 | 2019-02 | 2019-01 | 2018-12 | 2018-11 | 2018-10 |
|---|---|---|---|---|---|---|---|---|---|---|---|---|---|---|---|---|---|---|---|---|
| pm25 | 39 | 42 | 48 | 73 | 148 | 95 | 74 | 51 | 33 | 27 | 34 | 43 | 43 | 63 | 55 | 138 | 133 | 87 | 103 | 49 |
| co | 784 | 927 | 1 | 1 | 2 | 1 | 1 | 1 | 1 | 916 | 888 | 903 | 997 | 997 | 987 | 1 | 2 | 1 | 1 | 1 |
| no2 | 25 | 38 | 38 | 25 | 55 | 56 | 63 | 50 | 43 | 34 | 32 | 38 | 46 | 48 | 48 | 54 | 76 | 60 | 64 | 63 |
| o3 | 144 | 134 | 106 | 86 | 60 | 38 | 55 | 97 | 164 | 158 | 210 | 212 | 174 | 130 | 123 | 85 | 46 | 41 | 67 | 98 |
| pm10 | 71 | 97 | 107 | 105 | 203 | 154 | 165 | 122 | 84 | 63 | 83 | 91 | 109 | 134 | 122 | 196 | 215 | 173 | 198 | 134 |
| so2 | 17 | 18 | 15 | 14 | 20 | 16 | 17 | 12 | 14 | 13 | 16 | 17 | 26 | 24 | 19 | 29 | 40 | 25 | 23 | 30 |