Air Pollution in Dawukou: Real-time Air Quality Index and smog alert.
Pollution and air quality forecast for Dawukou. Today is Tuesday, June 16, 2026. The following air pollution values have been recorded for Dawukou:- particulate matter (PM10) suspended dust - 179 (Very bad Hazardous)
- particulate matter (PM2.5) dust - 35 (Unhealthy for Sensitive Groups)
- ozone (O3) - 0 (Good)
- nitrogen dioxide (NO2) - 0 (Good)
- sulfur dioxide (SO2) - 0 (Good)

What is the air quality in Dawukou today? Is the air polluted in Dawukou?. Is there smog?
What is the level of PM10 today in Dawukou? (particulate matter (PM10) suspended dust)
The current level of particulate matter PM10 in Dawukou is:
179 (Very bad Hazardous)
The highest PM10 values usually occur in month: 163 (January 2020).
The lowest value of particulate matter PM10 pollution in Dawukou is usually recorded in: August (47).
What is the current level of PM2.5 in Dawukou? (particulate matter (PM2.5) dust)
Today's PM2.5 level is:
35 (Unhealthy for Sensitive Groups)
For comparison, the highest level of PM2.5 in Dawukou in the last 7 days was: 56 (Friday, May 27, 2022) and the lowest: 56 (Friday, May 27, 2022).
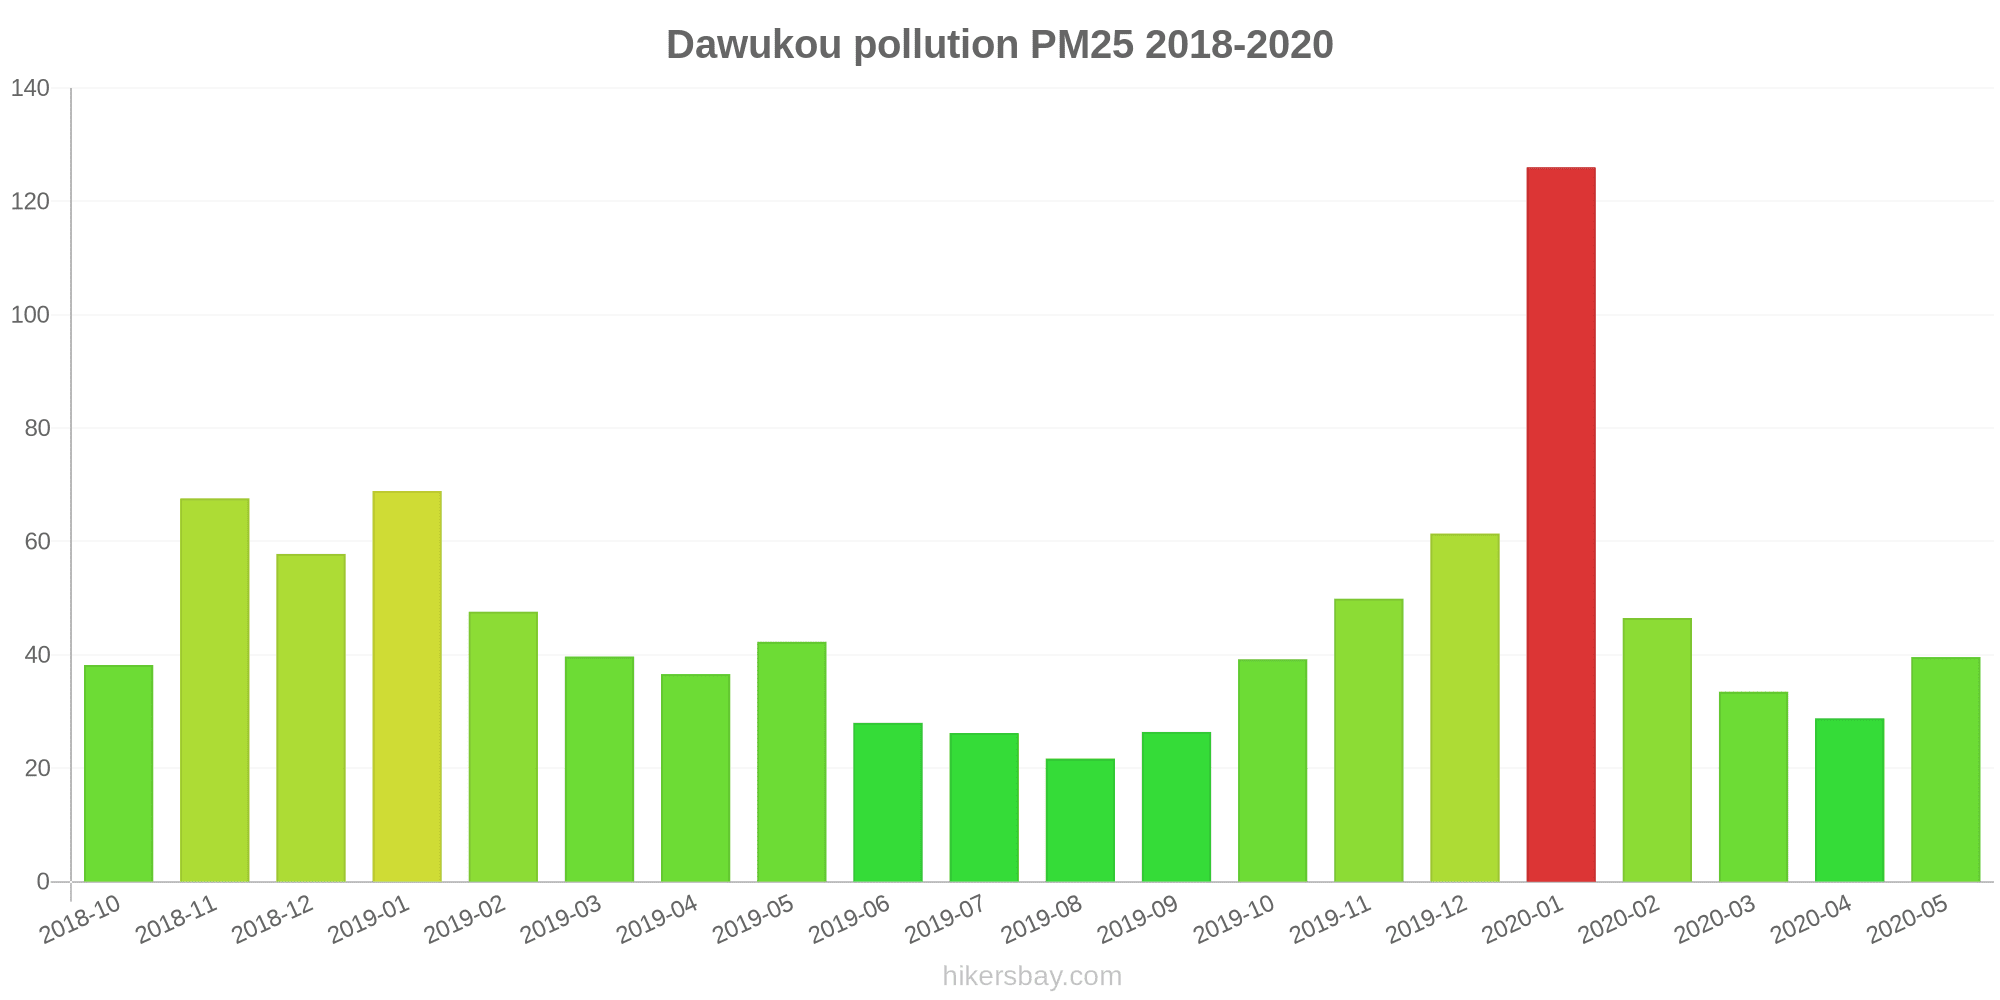
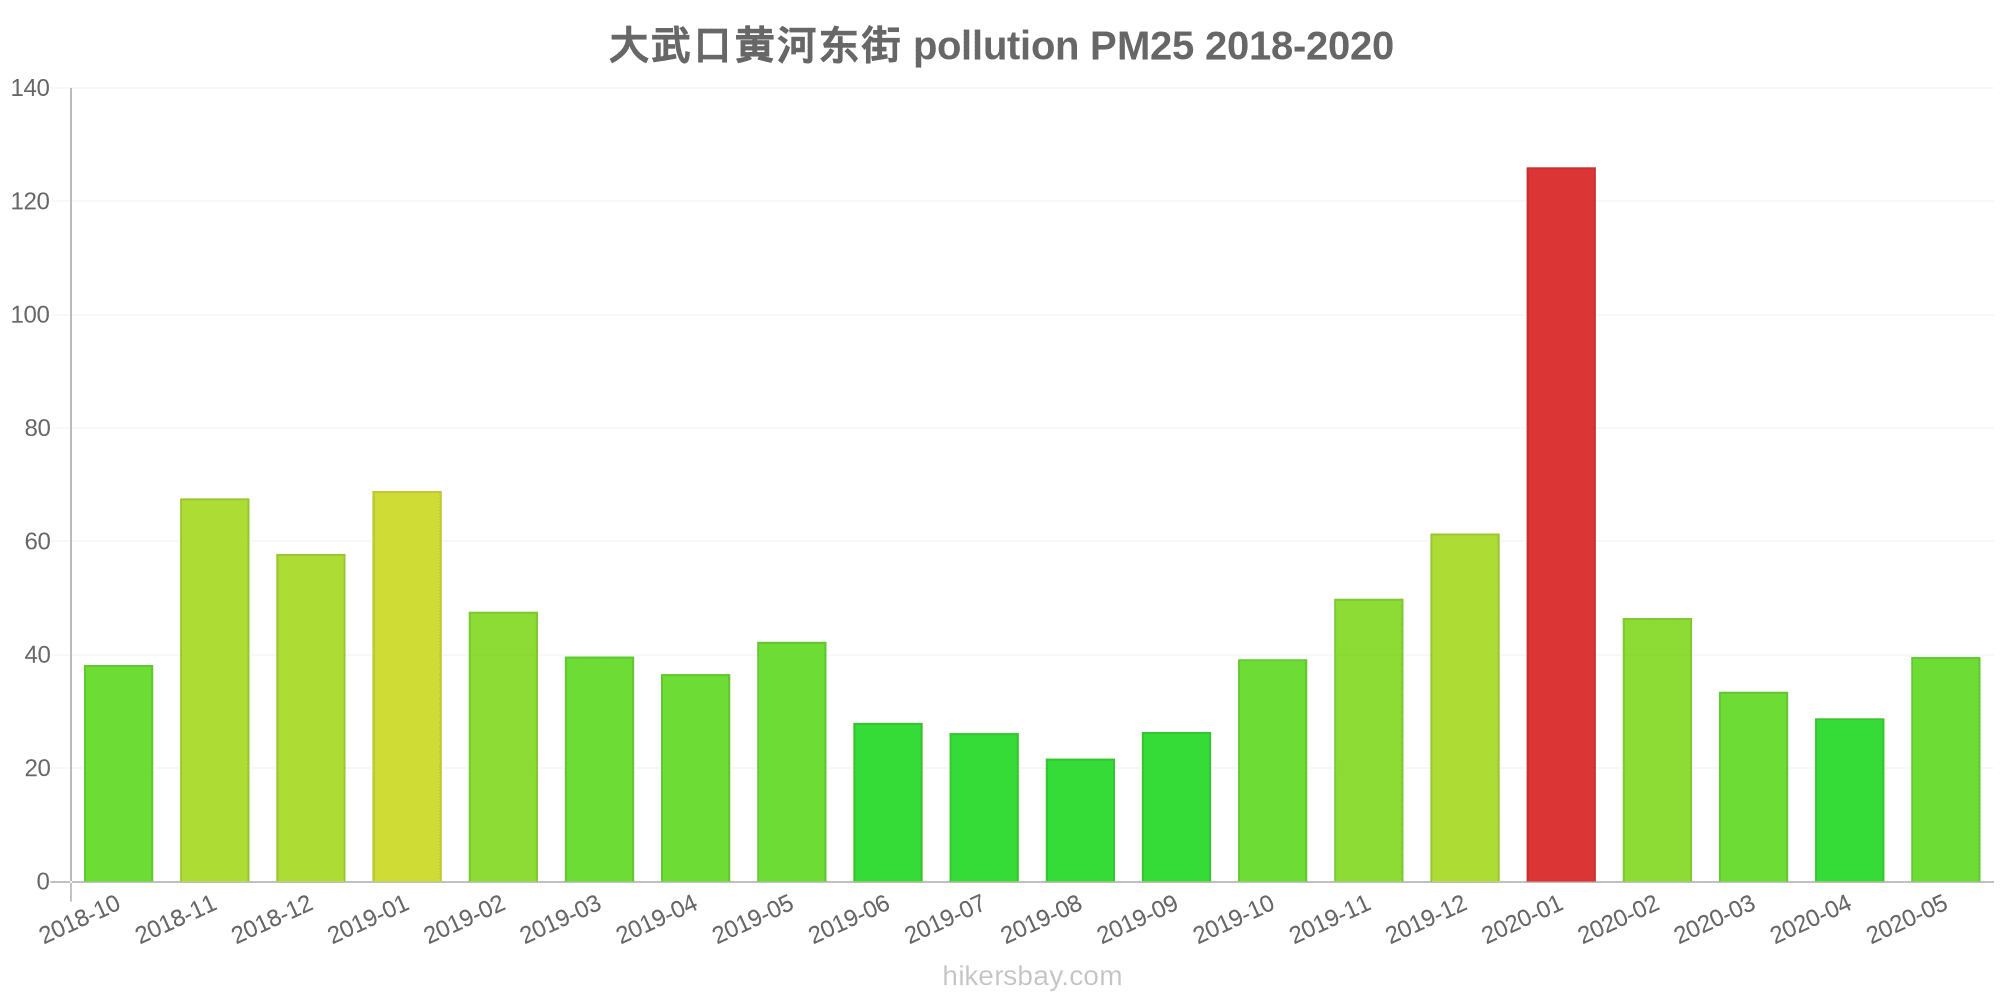
The highest PM2.5 values were recorded: 126 (January 2020).
The lowest level of particulate matter PM2.5 pollution occurs in month: August (22).
How is the O3 level today in Dawukou? (ozone (O3))
0 (Good)
How high is the level of NO2? (nitrogen dioxide (NO2))
0 (Good)
What is the level of SO2 pollution? (sulfur dioxide (SO2))
0 (Good)
Current data Friday, May 27, 2022, 12:00 PM
PM10 179 (Very bad Hazardous)
PM2,5 35 (Unhealthy for Sensitive Groups)
O3 0 (Good)
NO2 0 (Good)
SO2 0 (Good)
Data on air pollution from recent days in Dawukou
index
2022-05-27
pm10
56
Unhealthy for Sensitive Groups
pm25
56
Unhealthy
o3
0
Good
no2
0
Good
so2
0
Good
data source »
Air pollution in Dawukou from October 2018 to May 2020

index
2020-05
2020-04
2020-03
2020-02
2020-01
2019-12
2019-11
2019-10
2019-09
2019-08
2019-07
2019-06
2019-05
2019-04
2019-03
2019-02
2019-01
2018-12
2018-11
2018-10
pm25
40 (Unhealthy for Sensitive Groups)
29 (Moderate)
34 (Moderate)
47 (Unhealthy for Sensitive Groups)
126 (Very bad Hazardous)
61 (Unhealthy)
50 (Unhealthy for Sensitive Groups)
39 (Unhealthy for Sensitive Groups)
26 (Moderate)
22 (Moderate)
26 (Moderate)
28 (Moderate)
42 (Unhealthy for Sensitive Groups)
37 (Unhealthy for Sensitive Groups)
40 (Unhealthy for Sensitive Groups)
48 (Unhealthy for Sensitive Groups)
69 (Unhealthy)
58 (Unhealthy)
68 (Unhealthy)
38 (Unhealthy for Sensitive Groups)
co
624 (Good)
810 (Good)
814 (Good)
1 (Good)
2 (Good)
1 (Good)
1 (Good)
998 (Good)
912 (Good)
736 (Good)
1 (Good)
1 (Good)
906 (Good)
887 (Good)
1 (Good)
1 (Good)
1 (Good)
1 (Good)
1 (Good)
853 (Good)
no2
24 (Good)
28 (Good)
21 (Good)
25 (Good)
51 (Moderate)
46 (Moderate)
41 (Moderate)
36 (Good)
27 (Good)
18 (Good)
21 (Good)
20 (Good)
21 (Good)
26 (Good)
30 (Good)
35 (Good)
52 (Moderate)
43 (Moderate)
50 (Moderate)
34 (Good)
o3
143 (Unhealthy for Sensitive Groups)
133 (Unhealthy for Sensitive Groups)
111 (Moderate)
106 (Moderate)
73 (Moderate)
73 (Moderate)
81 (Moderate)
96 (Moderate)
147 (Unhealthy for Sensitive Groups)
163 (Unhealthy)
169 (Unhealthy)
133 (Unhealthy for Sensitive Groups)
127 (Unhealthy for Sensitive Groups)
117 (Moderate)
112 (Moderate)
92 (Moderate)
69 (Good)
63 (Good)
81 (Moderate)
92 (Moderate)
pm10
120 (Very Unhealthy)
75 (Unhealthy for Sensitive Groups)
92 (Unhealthy)
100 (Unhealthy)
163 (Very bad Hazardous)
104 (Unhealthy)
106 (Unhealthy)
82 (Unhealthy)
51 (Unhealthy for Sensitive Groups)
47 (Moderate)
59 (Unhealthy for Sensitive Groups)
53 (Unhealthy for Sensitive Groups)
132 (Very Unhealthy)
113 (Very Unhealthy)
87 (Unhealthy)
102 (Unhealthy)
122 (Very Unhealthy)
128 (Very Unhealthy)
149 (Very Unhealthy)
80 (Unhealthy for Sensitive Groups)
so2
15 (Good)
24 (Good)
19 (Good)
30 (Good)
43 (Good)
39 (Good)
34 (Good)
24 (Good)
19 (Good)
15 (Good)
20 (Good)
18 (Good)
21 (Good)
22 (Good)
32 (Good)
41 (Good)
67 (Moderate)
71 (Moderate)
59 (Moderate)
24 (Good)
data source »
大武口黄河东街
Friday, May 27, 2022, 12:00 PM
PM10 179 (Very bad Hazardous)
particulate matter (PM10) suspended dust
PM2,5 35 (Unhealthy for Sensitive Groups)
particulate matter (PM2.5) dust
O3 0.04 (Good)
ozone (O3)
NO2 0 (Good)
nitrogen dioxide (NO2)
SO2 0 (Good)
sulfur dioxide (SO2)
大武口黄河东街
index
2022-05-27
pm10
56
pm25
56
o3
0.03
no2
0
so2
0
大武口黄河东街
2018-10 2020-05

index
2020-05
2020-04
2020-03
2020-02
2020-01
2019-12
2019-11
2019-10
2019-09
2019-08
2019-07
2019-06
2019-05
2019-04
2019-03
2019-02
2019-01
2018-12
2018-11
2018-10
pm25
40
29
34
47
126
61
50
39
26
22
26
28
42
37
40
48
69
58
68
38
co
624
810
814
1
2
1
1
998
912
736
1
1
906
887
1
1
1
1
1
853
no2
24
28
21
25
51
46
41
36
27
18
21
20
21
26
30
35
52
43
50
34
o3
143
133
111
106
73
73
81
96
147
163
169
133
127
117
112
92
69
63
81
92
pm10
120
75
92
100
163
104
106
82
51
47
59
53
132
113
87
102
122
128
149
80
so2
15
24
19
30
43
39
34
24
19
15
20
18
21
22
32
41
67
71
59
24
* Pollution data source:
https://openaq.org
(ChinaAQIData)
The data is licensed under CC-By 4.0
PM10 179 (Very bad Hazardous)
PM2,5 35 (Unhealthy for Sensitive Groups)
O3 0 (Good)
NO2 0 (Good)
SO2 0 (Good)
Data on air pollution from recent days in Dawukou
| index | 2022-05-27 |
|---|---|
| pm10 | 56 Unhealthy for Sensitive Groups |
| pm25 | 56 Unhealthy |
| o3 | 0 Good |
| no2 | 0 Good |
| so2 | 0 Good |
| index | 2020-05 | 2020-04 | 2020-03 | 2020-02 | 2020-01 | 2019-12 | 2019-11 | 2019-10 | 2019-09 | 2019-08 | 2019-07 | 2019-06 | 2019-05 | 2019-04 | 2019-03 | 2019-02 | 2019-01 | 2018-12 | 2018-11 | 2018-10 |
|---|---|---|---|---|---|---|---|---|---|---|---|---|---|---|---|---|---|---|---|---|
| pm25 | 40 (Unhealthy for Sensitive Groups) | 29 (Moderate) | 34 (Moderate) | 47 (Unhealthy for Sensitive Groups) | 126 (Very bad Hazardous) | 61 (Unhealthy) | 50 (Unhealthy for Sensitive Groups) | 39 (Unhealthy for Sensitive Groups) | 26 (Moderate) | 22 (Moderate) | 26 (Moderate) | 28 (Moderate) | 42 (Unhealthy for Sensitive Groups) | 37 (Unhealthy for Sensitive Groups) | 40 (Unhealthy for Sensitive Groups) | 48 (Unhealthy for Sensitive Groups) | 69 (Unhealthy) | 58 (Unhealthy) | 68 (Unhealthy) | 38 (Unhealthy for Sensitive Groups) |
| co | 624 (Good) | 810 (Good) | 814 (Good) | 1 (Good) | 2 (Good) | 1 (Good) | 1 (Good) | 998 (Good) | 912 (Good) | 736 (Good) | 1 (Good) | 1 (Good) | 906 (Good) | 887 (Good) | 1 (Good) | 1 (Good) | 1 (Good) | 1 (Good) | 1 (Good) | 853 (Good) |
| no2 | 24 (Good) | 28 (Good) | 21 (Good) | 25 (Good) | 51 (Moderate) | 46 (Moderate) | 41 (Moderate) | 36 (Good) | 27 (Good) | 18 (Good) | 21 (Good) | 20 (Good) | 21 (Good) | 26 (Good) | 30 (Good) | 35 (Good) | 52 (Moderate) | 43 (Moderate) | 50 (Moderate) | 34 (Good) |
| o3 | 143 (Unhealthy for Sensitive Groups) | 133 (Unhealthy for Sensitive Groups) | 111 (Moderate) | 106 (Moderate) | 73 (Moderate) | 73 (Moderate) | 81 (Moderate) | 96 (Moderate) | 147 (Unhealthy for Sensitive Groups) | 163 (Unhealthy) | 169 (Unhealthy) | 133 (Unhealthy for Sensitive Groups) | 127 (Unhealthy for Sensitive Groups) | 117 (Moderate) | 112 (Moderate) | 92 (Moderate) | 69 (Good) | 63 (Good) | 81 (Moderate) | 92 (Moderate) |
| pm10 | 120 (Very Unhealthy) | 75 (Unhealthy for Sensitive Groups) | 92 (Unhealthy) | 100 (Unhealthy) | 163 (Very bad Hazardous) | 104 (Unhealthy) | 106 (Unhealthy) | 82 (Unhealthy) | 51 (Unhealthy for Sensitive Groups) | 47 (Moderate) | 59 (Unhealthy for Sensitive Groups) | 53 (Unhealthy for Sensitive Groups) | 132 (Very Unhealthy) | 113 (Very Unhealthy) | 87 (Unhealthy) | 102 (Unhealthy) | 122 (Very Unhealthy) | 128 (Very Unhealthy) | 149 (Very Unhealthy) | 80 (Unhealthy for Sensitive Groups) |
| so2 | 15 (Good) | 24 (Good) | 19 (Good) | 30 (Good) | 43 (Good) | 39 (Good) | 34 (Good) | 24 (Good) | 19 (Good) | 15 (Good) | 20 (Good) | 18 (Good) | 21 (Good) | 22 (Good) | 32 (Good) | 41 (Good) | 67 (Moderate) | 71 (Moderate) | 59 (Moderate) | 24 (Good) |
PM10 179 (Very bad Hazardous)
particulate matter (PM10) suspended dustPM2,5 35 (Unhealthy for Sensitive Groups)
particulate matter (PM2.5) dustO3 0.04 (Good)
ozone (O3)NO2 0 (Good)
nitrogen dioxide (NO2)SO2 0 (Good)
sulfur dioxide (SO2)大武口黄河东街
| index | 2022-05-27 |
|---|---|
| pm10 | 56 |
| pm25 | 56 |
| o3 | 0.03 |
| no2 | 0 |
| so2 | 0 |
大武口黄河东街
| index | 2020-05 | 2020-04 | 2020-03 | 2020-02 | 2020-01 | 2019-12 | 2019-11 | 2019-10 | 2019-09 | 2019-08 | 2019-07 | 2019-06 | 2019-05 | 2019-04 | 2019-03 | 2019-02 | 2019-01 | 2018-12 | 2018-11 | 2018-10 |
|---|---|---|---|---|---|---|---|---|---|---|---|---|---|---|---|---|---|---|---|---|
| pm25 | 40 | 29 | 34 | 47 | 126 | 61 | 50 | 39 | 26 | 22 | 26 | 28 | 42 | 37 | 40 | 48 | 69 | 58 | 68 | 38 |
| co | 624 | 810 | 814 | 1 | 2 | 1 | 1 | 998 | 912 | 736 | 1 | 1 | 906 | 887 | 1 | 1 | 1 | 1 | 1 | 853 |
| no2 | 24 | 28 | 21 | 25 | 51 | 46 | 41 | 36 | 27 | 18 | 21 | 20 | 21 | 26 | 30 | 35 | 52 | 43 | 50 | 34 |
| o3 | 143 | 133 | 111 | 106 | 73 | 73 | 81 | 96 | 147 | 163 | 169 | 133 | 127 | 117 | 112 | 92 | 69 | 63 | 81 | 92 |
| pm10 | 120 | 75 | 92 | 100 | 163 | 104 | 106 | 82 | 51 | 47 | 59 | 53 | 132 | 113 | 87 | 102 | 122 | 128 | 149 | 80 |
| so2 | 15 | 24 | 19 | 30 | 43 | 39 | 34 | 24 | 19 | 15 | 20 | 18 | 21 | 22 | 32 | 41 | 67 | 71 | 59 | 24 |