Air Pollution in Tongchuan Qu: Real-time Air Quality Index and smog alert.
Pollution and air quality forecast for Tongchuan Qu. Today is Tuesday, June 16, 2026. The following air pollution values have been recorded for Tongchuan Qu:- particulate matter (PM2.5) dust - 61 (Unhealthy)
- nitrogen dioxide (NO2) - 22 (Good)
- particulate matter (PM10) suspended dust - 69 (Unhealthy for Sensitive Groups)
- carbon monoxide (CO) - 219 (Good)
- ozone (O3) - 0 (Good)
- sulfur dioxide (SO2) - 8 (Good)

What is the air quality in Tongchuan Qu today? Is the air polluted in Tongchuan Qu?. Is there smog?
What is the current level of PM2.5 in Tongchuan Qu? (particulate matter (PM2.5) dust)
Today's PM2.5 level is:
61 (Unhealthy)
For comparison, the highest level of PM2.5 in Tongchuan Qu in the last 7 days was: 28 (Friday, May 27, 2022) and the lowest: 28 (Friday, May 27, 2022).
The highest PM2.5 values were recorded: 92 (January 2019).
The lowest level of particulate matter PM2.5 pollution occurs in month: July (20).
How high is the level of NO2? (nitrogen dioxide (NO2))
22 (Good)
What is the level of PM10 today in Tongchuan Qu? (particulate matter (PM10) suspended dust)
The current level of particulate matter PM10 in Tongchuan Qu is:
69 (Unhealthy for Sensitive Groups)
The highest PM10 values usually occur in month: 132 (January 2019).
The lowest value of particulate matter PM10 pollution in Tongchuan Qu is usually recorded in: October (30).
How high is the CO level? (carbon monoxide (CO))
219 (Good)
How is the O3 level today in Tongchuan Qu? (ozone (O3))
0 (Good)
What is the level of SO2 pollution? (sulfur dioxide (SO2))
8 (Good)
Current data Friday, May 27, 2022, 3:00 PM
PM2,5 61 (Unhealthy)
NO2 22 (Good)
PM10 69 (Unhealthy for Sensitive Groups)
CO 219 (Good)
O3 0 (Good)
SO2 8 (Good)
Data on air pollution from recent days in Tongchuan Qu
index
2022-05-27
pm25
28
Moderate
no2
22
Good
pm10
35
Moderate
co
579
Good
o3
22
Good
so2
5
Good
data source »
Air pollution in Tongchuan Qu from October 2018 to May 2020
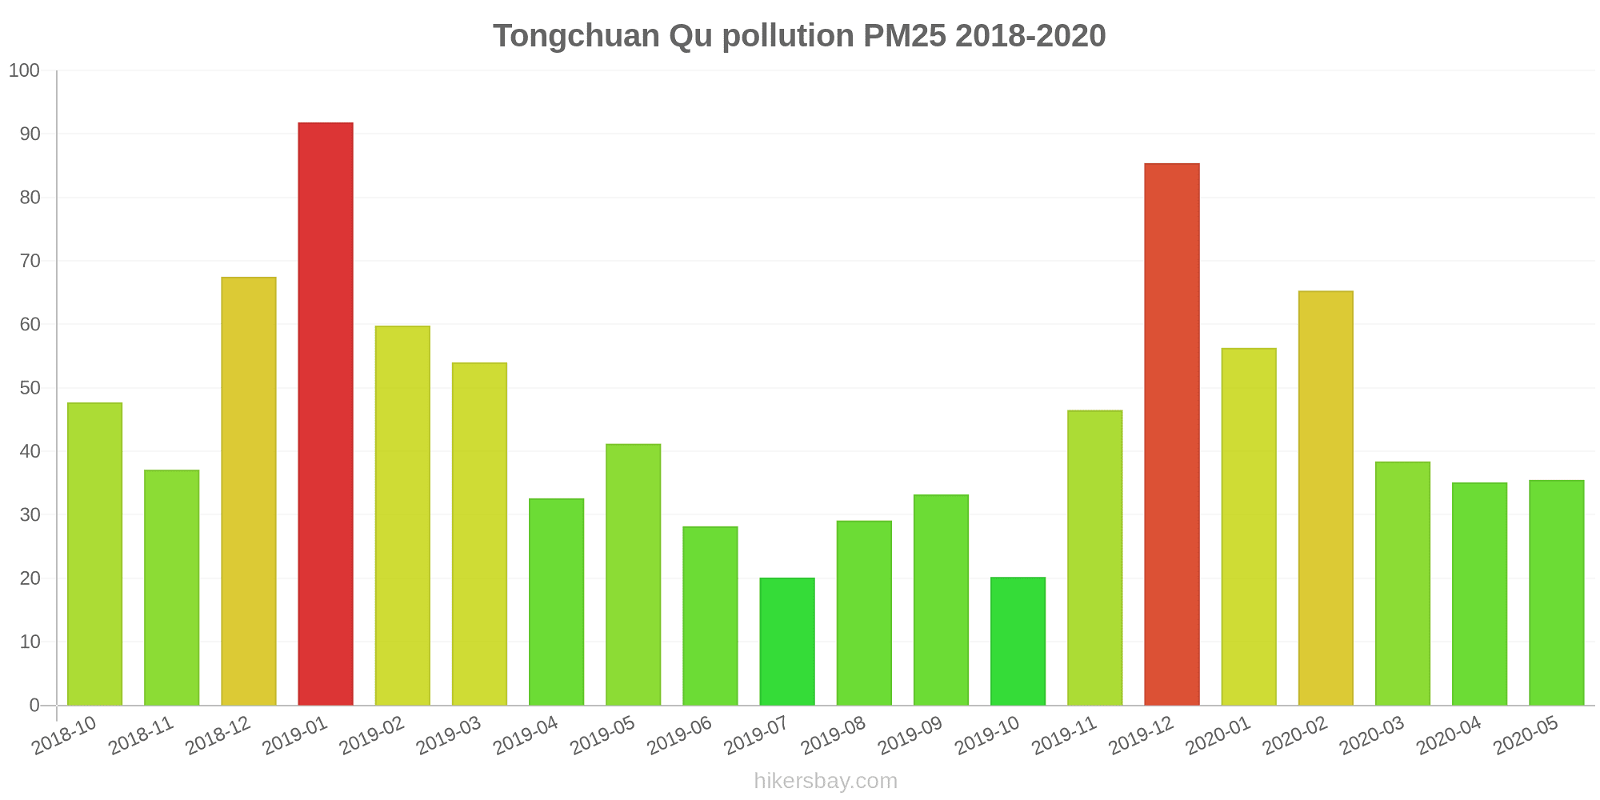
index
2020-05
2020-04
2020-03
2020-02
2020-01
2019-12
2019-11
2019-10
2019-09
2019-08
2019-07
2019-06
2019-05
2019-04
2019-03
2019-02
2019-01
2018-12
2018-11
2018-10
pm25
36 (Unhealthy for Sensitive Groups)
35 (Unhealthy for Sensitive Groups)
38 (Unhealthy for Sensitive Groups)
65 (Unhealthy)
56 (Unhealthy)
85 (Very Unhealthy)
47 (Unhealthy for Sensitive Groups)
20 (Moderate)
33 (Moderate)
29 (Moderate)
20 (Moderate)
28 (Moderate)
41 (Unhealthy for Sensitive Groups)
33 (Moderate)
54 (Unhealthy for Sensitive Groups)
60 (Unhealthy)
92 (Very Unhealthy)
68 (Unhealthy)
37 (Unhealthy for Sensitive Groups)
48 (Unhealthy for Sensitive Groups)
co
518 (Good)
615 (Good)
434 (Good)
721 (Good)
1 (Good)
1 (Good)
705 (Good)
516 (Good)
680 (Good)
729 (Good)
705 (Good)
926 (Good)
832 (Good)
755 (Good)
774 (Good)
894 (Good)
1 (Good)
1 (Good)
837 (Good)
797 (Good)
no2
32 (Good)
47 (Moderate)
48 (Moderate)
27 (Good)
41 (Moderate)
47 (Moderate)
42 (Moderate)
38 (Good)
39 (Good)
32 (Good)
33 (Good)
33 (Good)
34 (Good)
38 (Good)
50 (Moderate)
42 (Moderate)
51 (Moderate)
34 (Good)
34 (Good)
34 (Good)
o3
127 (Unhealthy for Sensitive Groups)
98 (Moderate)
91 (Moderate)
58 (Good)
54 (Good)
44 (Good)
36 (Good)
69 (Good)
110 (Moderate)
157 (Unhealthy)
133 (Unhealthy for Sensitive Groups)
114 (Moderate)
120 (Unhealthy for Sensitive Groups)
120 (Unhealthy for Sensitive Groups)
98 (Moderate)
65 (Good)
40 (Good)
39 (Good)
55 (Good)
81 (Moderate)
pm10
58 (Unhealthy for Sensitive Groups)
56 (Unhealthy for Sensitive Groups)
67 (Unhealthy for Sensitive Groups)
74 (Unhealthy for Sensitive Groups)
70 (Unhealthy for Sensitive Groups)
106 (Unhealthy)
66 (Unhealthy for Sensitive Groups)
30 (Moderate)
46 (Moderate)
48 (Moderate)
36 (Moderate)
42 (Moderate)
64 (Unhealthy for Sensitive Groups)
53 (Unhealthy for Sensitive Groups)
79 (Unhealthy for Sensitive Groups)
78 (Unhealthy for Sensitive Groups)
132 (Very Unhealthy)
103 (Unhealthy)
64 (Unhealthy for Sensitive Groups)
65 (Unhealthy for Sensitive Groups)
so2
10 (Good)
8 (Good)
7.6 (Good)
8 (Good)
8.8 (Good)
12 (Good)
13 (Good)
10 (Good)
9 (Good)
8.3 (Good)
6.8 (Good)
6.7 (Good)
7.6 (Good)
7.8 (Good)
11 (Good)
11 (Good)
10 (Good)
10 (Good)
8.6 (Good)
7.3 (Good)
data source »
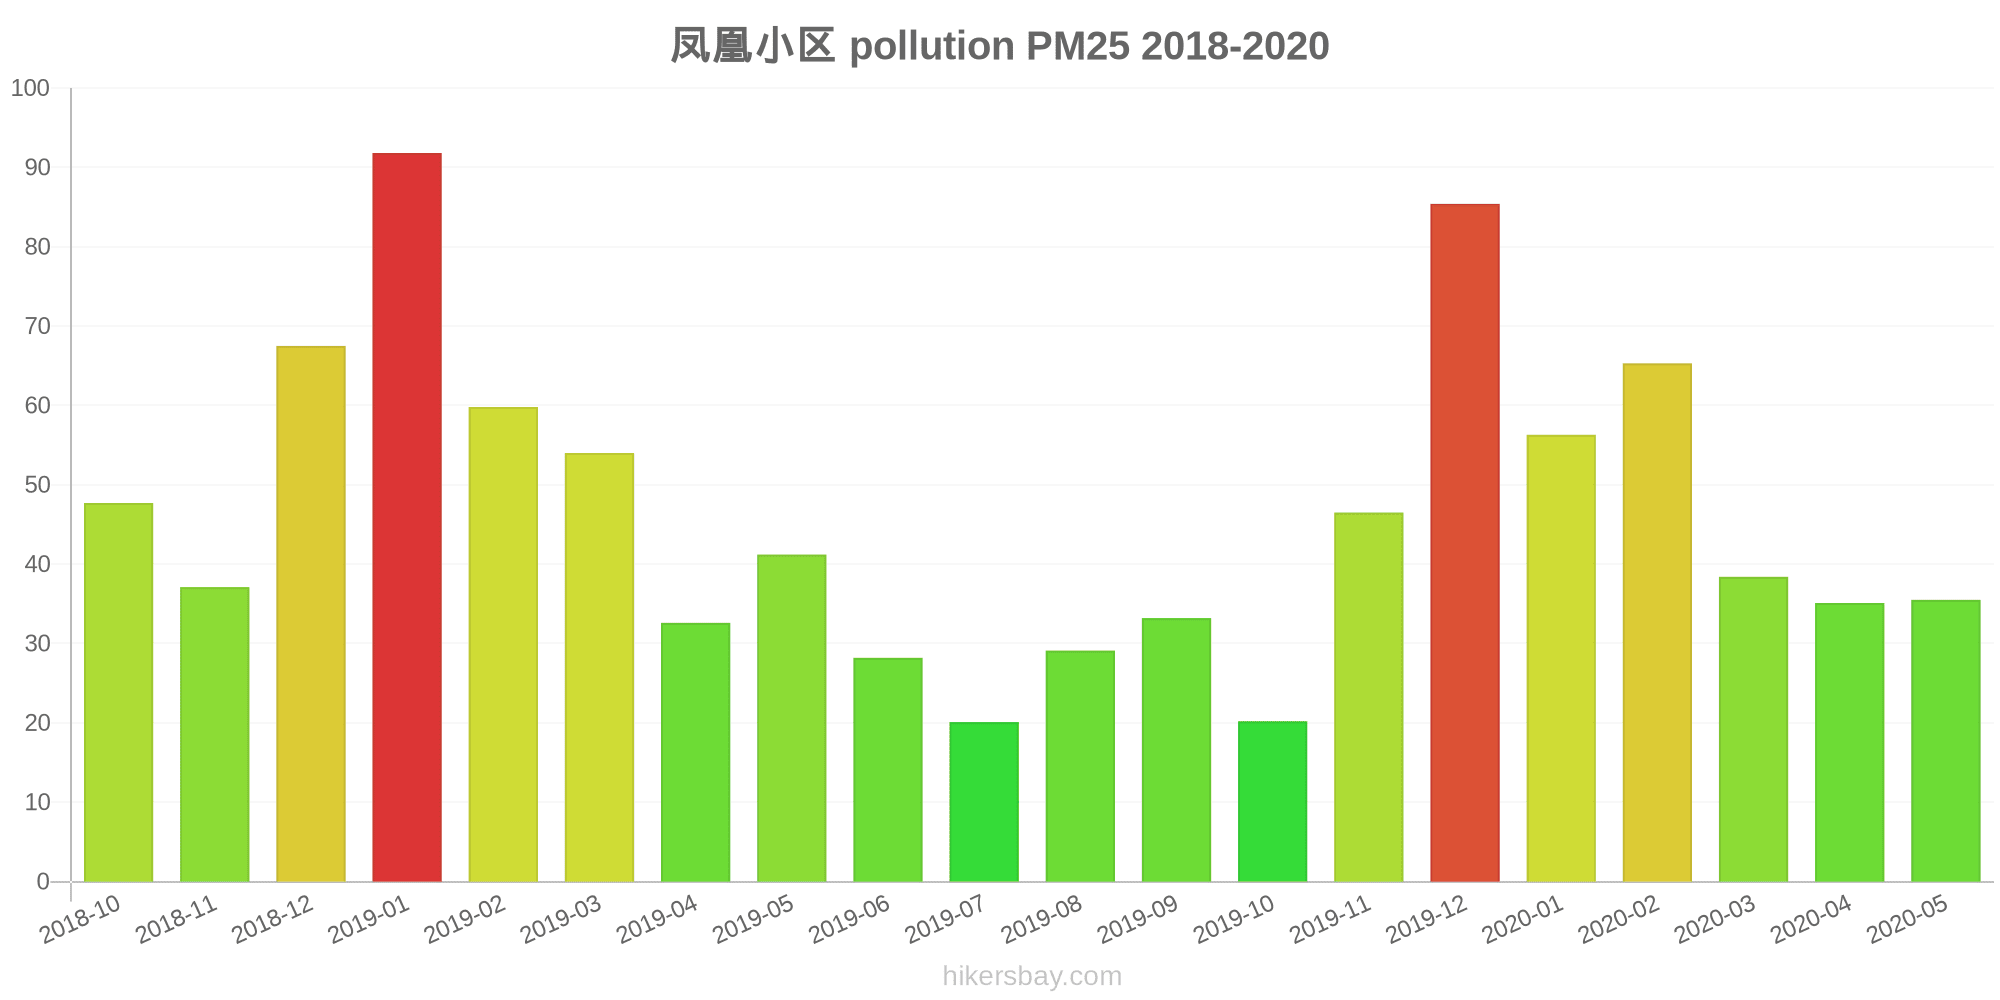
凤凰小区
Friday, May 27, 2022, 3:00 PM
PM2,5 61 (Unhealthy)
particulate matter (PM2.5) dust
NO2 22 (Good)
nitrogen dioxide (NO2)
PM10 69 (Unhealthy for Sensitive Groups)
particulate matter (PM10) suspended dust
CO 219 (Good)
carbon monoxide (CO)
O3 0.05 (Good)
ozone (O3)
SO2 7.7 (Good)
sulfur dioxide (SO2)
凤凰小区
index
2022-05-27
pm25
28
no2
22
pm10
35
co
579
o3
22
so2
4.6
凤凰小区
2018-10 2020-05

index
2020-05
2020-04
2020-03
2020-02
2020-01
2019-12
2019-11
2019-10
2019-09
2019-08
2019-07
2019-06
2019-05
2019-04
2019-03
2019-02
2019-01
2018-12
2018-11
2018-10
pm25
36
35
38
65
56
85
47
20
33
29
20
28
41
33
54
60
92
68
37
48
co
518
615
434
721
1
1
705
516
680
729
705
926
832
755
774
894
1
1
837
797
no2
32
47
48
27
41
47
42
38
39
32
33
33
34
38
50
42
51
34
34
34
o3
127
98
91
58
54
44
36
69
110
157
133
114
120
120
98
65
40
39
55
81
pm10
58
56
67
74
70
106
66
30
46
48
36
42
64
53
79
78
132
103
64
65
so2
10
8
7.6
8
8.8
12
13
10
9
8.3
6.8
6.7
7.6
7.8
11
11
10
10
8.6
7.3
* Pollution data source:
https://openaq.org
(ChinaAQIData)
The data is licensed under CC-By 4.0
PM2,5 61 (Unhealthy)
NO2 22 (Good)
PM10 69 (Unhealthy for Sensitive Groups)
CO 219 (Good)
O3 0 (Good)
SO2 8 (Good)
Data on air pollution from recent days in Tongchuan Qu
| index | 2022-05-27 |
|---|---|
| pm25 | 28 Moderate |
| no2 | 22 Good |
| pm10 | 35 Moderate |
| co | 579 Good |
| o3 | 22 Good |
| so2 | 5 Good |
| index | 2020-05 | 2020-04 | 2020-03 | 2020-02 | 2020-01 | 2019-12 | 2019-11 | 2019-10 | 2019-09 | 2019-08 | 2019-07 | 2019-06 | 2019-05 | 2019-04 | 2019-03 | 2019-02 | 2019-01 | 2018-12 | 2018-11 | 2018-10 |
|---|---|---|---|---|---|---|---|---|---|---|---|---|---|---|---|---|---|---|---|---|
| pm25 | 36 (Unhealthy for Sensitive Groups) | 35 (Unhealthy for Sensitive Groups) | 38 (Unhealthy for Sensitive Groups) | 65 (Unhealthy) | 56 (Unhealthy) | 85 (Very Unhealthy) | 47 (Unhealthy for Sensitive Groups) | 20 (Moderate) | 33 (Moderate) | 29 (Moderate) | 20 (Moderate) | 28 (Moderate) | 41 (Unhealthy for Sensitive Groups) | 33 (Moderate) | 54 (Unhealthy for Sensitive Groups) | 60 (Unhealthy) | 92 (Very Unhealthy) | 68 (Unhealthy) | 37 (Unhealthy for Sensitive Groups) | 48 (Unhealthy for Sensitive Groups) |
| co | 518 (Good) | 615 (Good) | 434 (Good) | 721 (Good) | 1 (Good) | 1 (Good) | 705 (Good) | 516 (Good) | 680 (Good) | 729 (Good) | 705 (Good) | 926 (Good) | 832 (Good) | 755 (Good) | 774 (Good) | 894 (Good) | 1 (Good) | 1 (Good) | 837 (Good) | 797 (Good) |
| no2 | 32 (Good) | 47 (Moderate) | 48 (Moderate) | 27 (Good) | 41 (Moderate) | 47 (Moderate) | 42 (Moderate) | 38 (Good) | 39 (Good) | 32 (Good) | 33 (Good) | 33 (Good) | 34 (Good) | 38 (Good) | 50 (Moderate) | 42 (Moderate) | 51 (Moderate) | 34 (Good) | 34 (Good) | 34 (Good) |
| o3 | 127 (Unhealthy for Sensitive Groups) | 98 (Moderate) | 91 (Moderate) | 58 (Good) | 54 (Good) | 44 (Good) | 36 (Good) | 69 (Good) | 110 (Moderate) | 157 (Unhealthy) | 133 (Unhealthy for Sensitive Groups) | 114 (Moderate) | 120 (Unhealthy for Sensitive Groups) | 120 (Unhealthy for Sensitive Groups) | 98 (Moderate) | 65 (Good) | 40 (Good) | 39 (Good) | 55 (Good) | 81 (Moderate) |
| pm10 | 58 (Unhealthy for Sensitive Groups) | 56 (Unhealthy for Sensitive Groups) | 67 (Unhealthy for Sensitive Groups) | 74 (Unhealthy for Sensitive Groups) | 70 (Unhealthy for Sensitive Groups) | 106 (Unhealthy) | 66 (Unhealthy for Sensitive Groups) | 30 (Moderate) | 46 (Moderate) | 48 (Moderate) | 36 (Moderate) | 42 (Moderate) | 64 (Unhealthy for Sensitive Groups) | 53 (Unhealthy for Sensitive Groups) | 79 (Unhealthy for Sensitive Groups) | 78 (Unhealthy for Sensitive Groups) | 132 (Very Unhealthy) | 103 (Unhealthy) | 64 (Unhealthy for Sensitive Groups) | 65 (Unhealthy for Sensitive Groups) |
| so2 | 10 (Good) | 8 (Good) | 7.6 (Good) | 8 (Good) | 8.8 (Good) | 12 (Good) | 13 (Good) | 10 (Good) | 9 (Good) | 8.3 (Good) | 6.8 (Good) | 6.7 (Good) | 7.6 (Good) | 7.8 (Good) | 11 (Good) | 11 (Good) | 10 (Good) | 10 (Good) | 8.6 (Good) | 7.3 (Good) |
PM2,5 61 (Unhealthy)
particulate matter (PM2.5) dustNO2 22 (Good)
nitrogen dioxide (NO2)PM10 69 (Unhealthy for Sensitive Groups)
particulate matter (PM10) suspended dustCO 219 (Good)
carbon monoxide (CO)O3 0.05 (Good)
ozone (O3)SO2 7.7 (Good)
sulfur dioxide (SO2)凤凰小区
| index | 2022-05-27 |
|---|---|
| pm25 | 28 |
| no2 | 22 |
| pm10 | 35 |
| co | 579 |
| o3 | 22 |
| so2 | 4.6 |
凤凰小区
| index | 2020-05 | 2020-04 | 2020-03 | 2020-02 | 2020-01 | 2019-12 | 2019-11 | 2019-10 | 2019-09 | 2019-08 | 2019-07 | 2019-06 | 2019-05 | 2019-04 | 2019-03 | 2019-02 | 2019-01 | 2018-12 | 2018-11 | 2018-10 |
|---|---|---|---|---|---|---|---|---|---|---|---|---|---|---|---|---|---|---|---|---|
| pm25 | 36 | 35 | 38 | 65 | 56 | 85 | 47 | 20 | 33 | 29 | 20 | 28 | 41 | 33 | 54 | 60 | 92 | 68 | 37 | 48 |
| co | 518 | 615 | 434 | 721 | 1 | 1 | 705 | 516 | 680 | 729 | 705 | 926 | 832 | 755 | 774 | 894 | 1 | 1 | 837 | 797 |
| no2 | 32 | 47 | 48 | 27 | 41 | 47 | 42 | 38 | 39 | 32 | 33 | 33 | 34 | 38 | 50 | 42 | 51 | 34 | 34 | 34 |
| o3 | 127 | 98 | 91 | 58 | 54 | 44 | 36 | 69 | 110 | 157 | 133 | 114 | 120 | 120 | 98 | 65 | 40 | 39 | 55 | 81 |
| pm10 | 58 | 56 | 67 | 74 | 70 | 106 | 66 | 30 | 46 | 48 | 36 | 42 | 64 | 53 | 79 | 78 | 132 | 103 | 64 | 65 |
| so2 | 10 | 8 | 7.6 | 8 | 8.8 | 12 | 13 | 10 | 9 | 8.3 | 6.8 | 6.7 | 7.6 | 7.8 | 11 | 11 | 10 | 10 | 8.6 | 7.3 |