Air Pollution in Deyang: Real-time Air Quality Index and smog alert.
Pollution and air quality forecast for Deyang. Today is Tuesday, June 16, 2026. The following air pollution values have been recorded for Deyang:- particulate matter (PM2.5) dust - 61 (Unhealthy)
- nitrogen dioxide (NO2) - 22 (Good)
- particulate matter (PM10) suspended dust - 69 (Unhealthy for Sensitive Groups)
- carbon monoxide (CO) - 219 (Good)
- ozone (O3) - 0 (Good)
- sulfur dioxide (SO2) - 8 (Good)

What is the air quality in Deyang today? Is the air polluted in Deyang?. Is there smog?
What is the current level of PM2.5 in Deyang? (particulate matter (PM2.5) dust)
Today's PM2.5 level is:
61 (Unhealthy)
For comparison, the highest level of PM2.5 in Deyang in the last 7 days was: 28 (Friday, May 27, 2022) and the lowest: 28 (Friday, May 27, 2022).
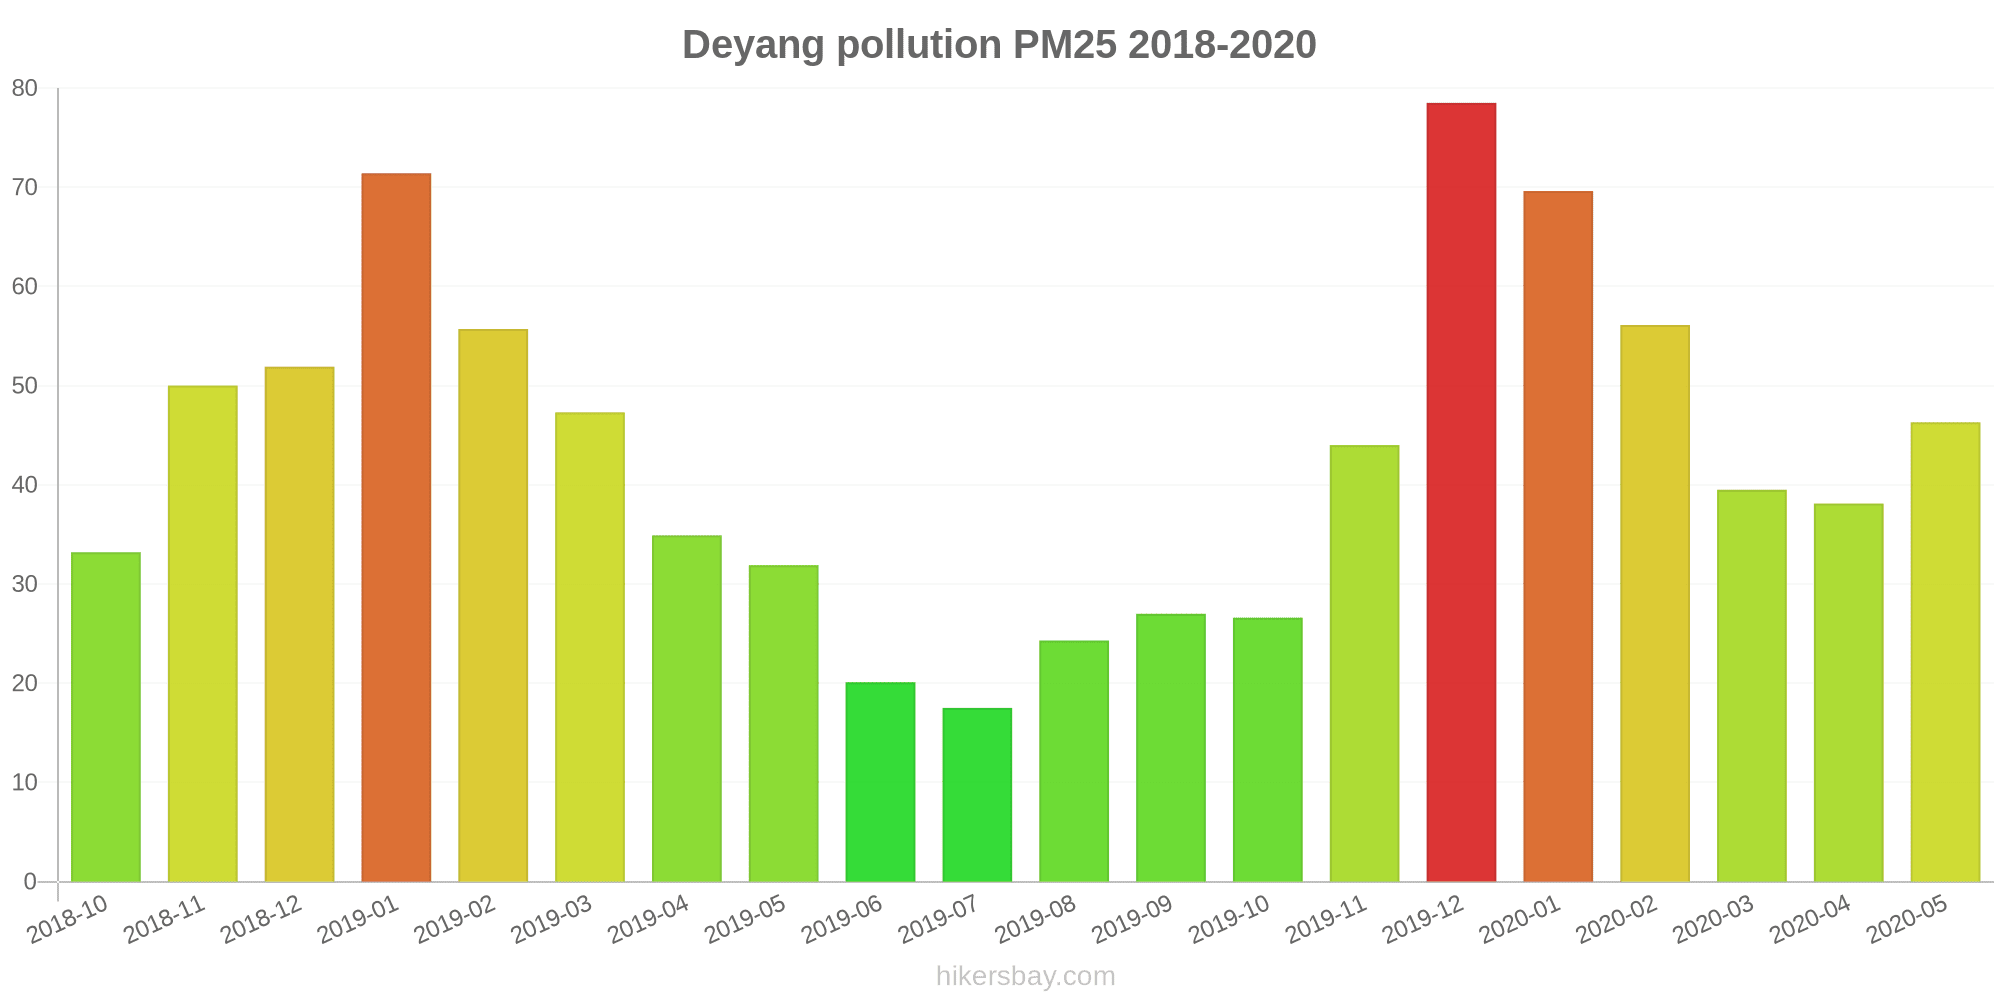
The highest PM2.5 values were recorded: 79 (December 2019).
The lowest level of particulate matter PM2.5 pollution occurs in month: July (18).
How high is the level of NO2? (nitrogen dioxide (NO2))
22 (Good)
What is the level of PM10 today in Deyang? (particulate matter (PM10) suspended dust)
The current level of particulate matter PM10 in Deyang is:
69 (Unhealthy for Sensitive Groups)
The highest PM10 values usually occur in month: 109 (December 2019).
The lowest value of particulate matter PM10 pollution in Deyang is usually recorded in: July (52).
How high is the CO level? (carbon monoxide (CO))
219 (Good)
How is the O3 level today in Deyang? (ozone (O3))
0 (Good)
What is the level of SO2 pollution? (sulfur dioxide (SO2))
8 (Good)
Current data Friday, May 27, 2022, 3:00 PM
PM2,5 61 (Unhealthy)
NO2 22 (Good)
PM10 69 (Unhealthy for Sensitive Groups)
CO 219 (Good)
O3 0 (Good)
SO2 8 (Good)
Data on air pollution from recent days in Deyang
index
2022-05-27
pm25
28
Moderate
no2
22
Good
pm10
35
Moderate
co
579
Good
o3
22
Good
so2
5
Good
data source »
Air pollution in Deyang from October 2018 to May 2020

index
2020-05
2020-04
2020-03
2020-02
2020-01
2019-12
2019-11
2019-10
2019-09
2019-08
2019-07
2019-06
2019-05
2019-04
2019-03
2019-02
2019-01
2018-12
2018-11
2018-10
pm25
46 (Unhealthy for Sensitive Groups)
38 (Unhealthy for Sensitive Groups)
40 (Unhealthy for Sensitive Groups)
56 (Unhealthy)
70 (Unhealthy)
79 (Very Unhealthy)
44 (Unhealthy for Sensitive Groups)
27 (Moderate)
27 (Moderate)
24 (Moderate)
18 (Moderate)
20 (Moderate)
32 (Moderate)
35 (Moderate)
47 (Unhealthy for Sensitive Groups)
56 (Unhealthy)
71 (Unhealthy)
52 (Unhealthy for Sensitive Groups)
50 (Unhealthy for Sensitive Groups)
33 (Moderate)
co
760 (Good)
631 (Good)
633 (Good)
755 (Good)
1 (Good)
984 (Good)
675 (Good)
717 (Good)
703 (Good)
712 (Good)
665 (Good)
628 (Good)
595 (Good)
625 (Good)
703 (Good)
975 (Good)
1 (Good)
725 (Good)
716 (Good)
770 (Good)
no2
36 (Good)
35 (Good)
34 (Good)
19 (Good)
40 (Moderate)
53 (Moderate)
42 (Moderate)
34 (Good)
34 (Good)
30 (Good)
31 (Good)
20 (Good)
26 (Good)
33 (Good)
42 (Moderate)
32 (Good)
52 (Moderate)
35 (Good)
39 (Good)
38 (Good)
o3
168 (Unhealthy)
129 (Unhealthy for Sensitive Groups)
103 (Moderate)
87 (Moderate)
63 (Good)
56 (Good)
61 (Good)
76 (Moderate)
92 (Moderate)
148 (Unhealthy for Sensitive Groups)
128 (Unhealthy for Sensitive Groups)
139 (Unhealthy for Sensitive Groups)
127 (Unhealthy for Sensitive Groups)
133 (Unhealthy for Sensitive Groups)
100 (Moderate)
72 (Moderate)
61 (Good)
45 (Good)
65 (Good)
73 (Moderate)
pm10
85 (Unhealthy)
68 (Unhealthy for Sensitive Groups)
72 (Unhealthy for Sensitive Groups)
74 (Unhealthy for Sensitive Groups)
89 (Unhealthy)
109 (Unhealthy)
79 (Unhealthy for Sensitive Groups)
52 (Unhealthy for Sensitive Groups)
59 (Unhealthy for Sensitive Groups)
59 (Unhealthy for Sensitive Groups)
52 (Unhealthy for Sensitive Groups)
54 (Unhealthy for Sensitive Groups)
71 (Unhealthy for Sensitive Groups)
73 (Unhealthy for Sensitive Groups)
82 (Unhealthy)
82 (Unhealthy)
107 (Unhealthy)
95 (Unhealthy)
89 (Unhealthy)
75 (Unhealthy for Sensitive Groups)
so2
9 (Good)
5.6 (Good)
5 (Good)
2.8 (Good)
3.4 (Good)
5.2 (Good)
4 (Good)
4.6 (Good)
4 (Good)
6.3 (Good)
4.2 (Good)
4.7 (Good)
6 (Good)
6.2 (Good)
4.9 (Good)
4.2 (Good)
6.5 (Good)
5 (Good)
5.8 (Good)
7 (Good)
data source »
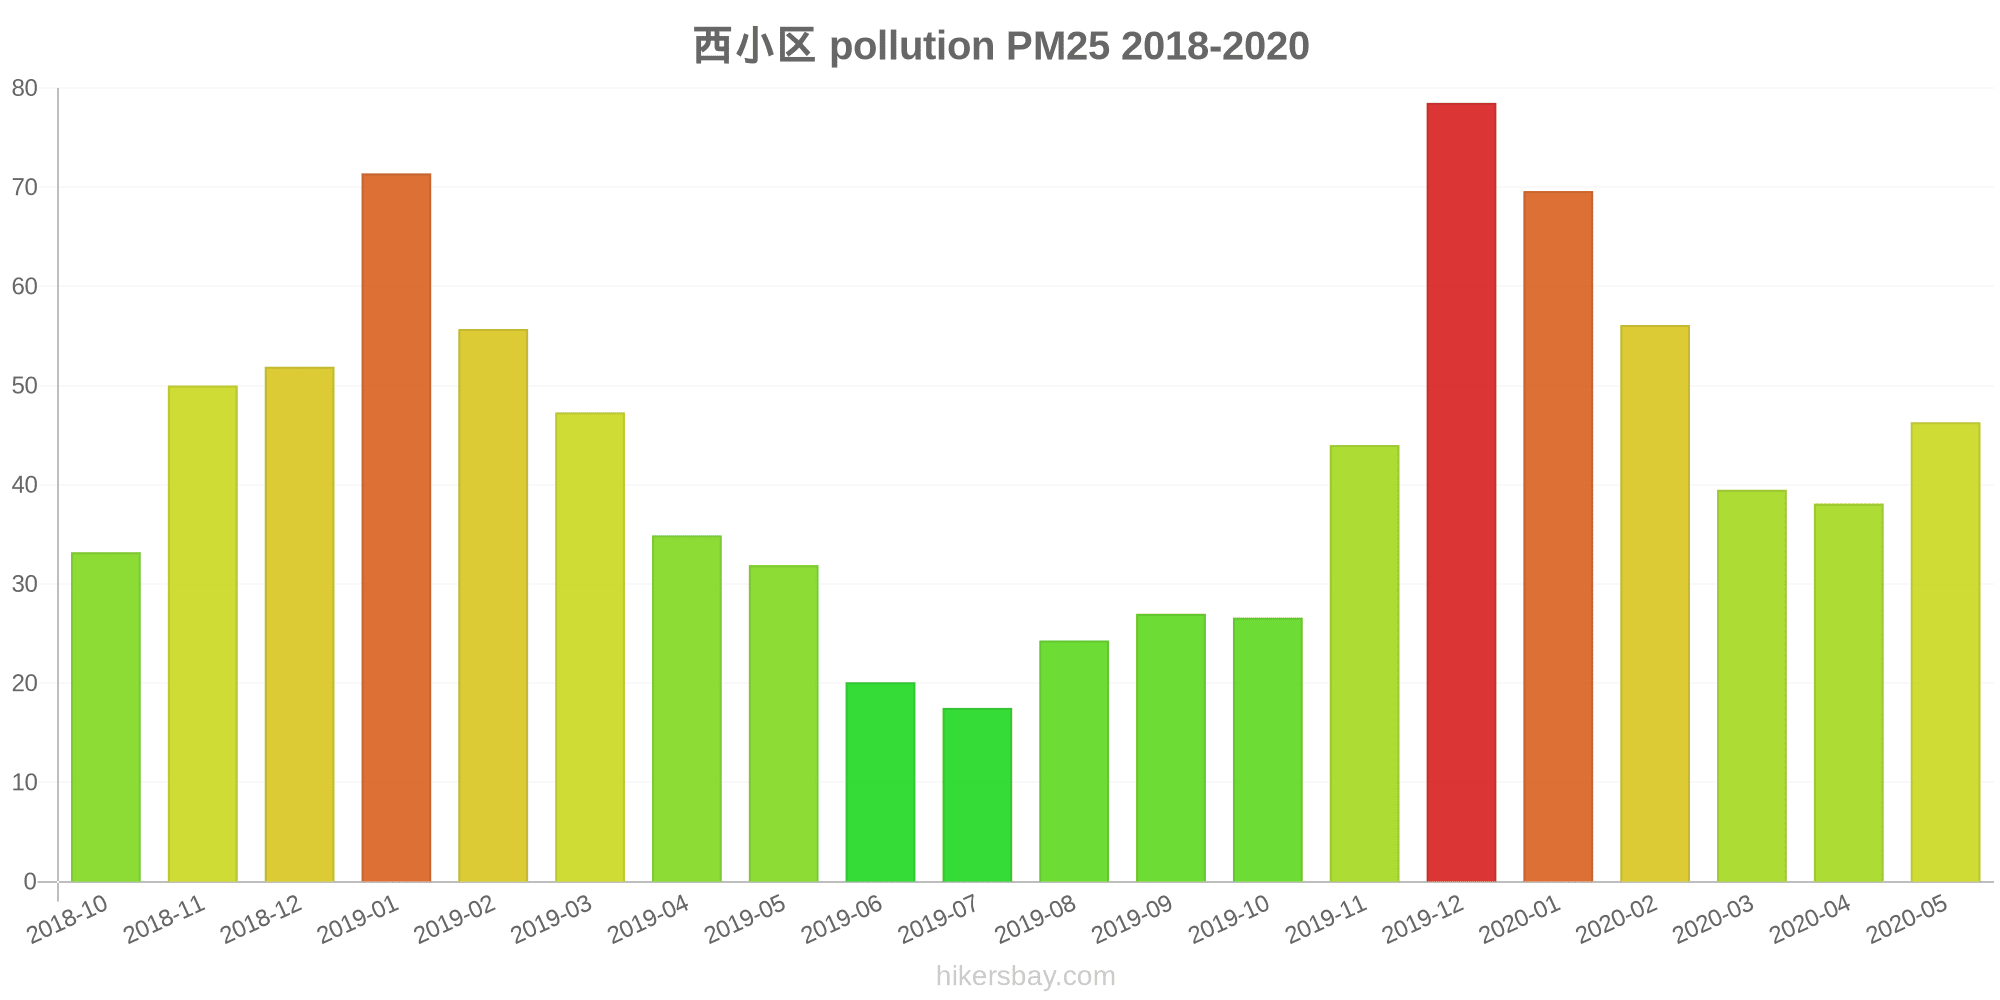
西小区
Friday, May 27, 2022, 3:00 PM
PM2,5 61 (Unhealthy)
particulate matter (PM2.5) dust
NO2 22 (Good)
nitrogen dioxide (NO2)
PM10 69 (Unhealthy for Sensitive Groups)
particulate matter (PM10) suspended dust
CO 219 (Good)
carbon monoxide (CO)
O3 0.05 (Good)
ozone (O3)
SO2 7.7 (Good)
sulfur dioxide (SO2)
西小区
index
2022-05-27
pm25
28
no2
22
pm10
35
co
579
o3
22
so2
4.6
西小区
2018-10 2020-05

index
2020-05
2020-04
2020-03
2020-02
2020-01
2019-12
2019-11
2019-10
2019-09
2019-08
2019-07
2019-06
2019-05
2019-04
2019-03
2019-02
2019-01
2018-12
2018-11
2018-10
pm25
46
38
40
56
70
79
44
27
27
24
18
20
32
35
47
56
71
52
50
33
co
760
631
633
755
1
984
675
717
703
712
665
628
595
625
703
975
1
725
716
770
no2
36
35
34
19
40
53
42
34
34
30
31
20
26
33
42
32
52
35
39
38
o3
168
129
103
87
63
56
61
76
92
148
128
139
127
133
100
72
61
45
65
73
pm10
85
68
72
74
89
109
79
52
59
59
52
54
71
73
82
82
107
95
89
75
so2
9
5.6
5
2.8
3.4
5.2
4
4.6
4
6.3
4.2
4.7
6
6.2
4.9
4.2
6.5
5
5.8
7
* Pollution data source:
https://openaq.org
(ChinaAQIData)
The data is licensed under CC-By 4.0
PM2,5 61 (Unhealthy)
NO2 22 (Good)
PM10 69 (Unhealthy for Sensitive Groups)
CO 219 (Good)
O3 0 (Good)
SO2 8 (Good)
Data on air pollution from recent days in Deyang
| index | 2022-05-27 |
|---|---|
| pm25 | 28 Moderate |
| no2 | 22 Good |
| pm10 | 35 Moderate |
| co | 579 Good |
| o3 | 22 Good |
| so2 | 5 Good |
| index | 2020-05 | 2020-04 | 2020-03 | 2020-02 | 2020-01 | 2019-12 | 2019-11 | 2019-10 | 2019-09 | 2019-08 | 2019-07 | 2019-06 | 2019-05 | 2019-04 | 2019-03 | 2019-02 | 2019-01 | 2018-12 | 2018-11 | 2018-10 |
|---|---|---|---|---|---|---|---|---|---|---|---|---|---|---|---|---|---|---|---|---|
| pm25 | 46 (Unhealthy for Sensitive Groups) | 38 (Unhealthy for Sensitive Groups) | 40 (Unhealthy for Sensitive Groups) | 56 (Unhealthy) | 70 (Unhealthy) | 79 (Very Unhealthy) | 44 (Unhealthy for Sensitive Groups) | 27 (Moderate) | 27 (Moderate) | 24 (Moderate) | 18 (Moderate) | 20 (Moderate) | 32 (Moderate) | 35 (Moderate) | 47 (Unhealthy for Sensitive Groups) | 56 (Unhealthy) | 71 (Unhealthy) | 52 (Unhealthy for Sensitive Groups) | 50 (Unhealthy for Sensitive Groups) | 33 (Moderate) |
| co | 760 (Good) | 631 (Good) | 633 (Good) | 755 (Good) | 1 (Good) | 984 (Good) | 675 (Good) | 717 (Good) | 703 (Good) | 712 (Good) | 665 (Good) | 628 (Good) | 595 (Good) | 625 (Good) | 703 (Good) | 975 (Good) | 1 (Good) | 725 (Good) | 716 (Good) | 770 (Good) |
| no2 | 36 (Good) | 35 (Good) | 34 (Good) | 19 (Good) | 40 (Moderate) | 53 (Moderate) | 42 (Moderate) | 34 (Good) | 34 (Good) | 30 (Good) | 31 (Good) | 20 (Good) | 26 (Good) | 33 (Good) | 42 (Moderate) | 32 (Good) | 52 (Moderate) | 35 (Good) | 39 (Good) | 38 (Good) |
| o3 | 168 (Unhealthy) | 129 (Unhealthy for Sensitive Groups) | 103 (Moderate) | 87 (Moderate) | 63 (Good) | 56 (Good) | 61 (Good) | 76 (Moderate) | 92 (Moderate) | 148 (Unhealthy for Sensitive Groups) | 128 (Unhealthy for Sensitive Groups) | 139 (Unhealthy for Sensitive Groups) | 127 (Unhealthy for Sensitive Groups) | 133 (Unhealthy for Sensitive Groups) | 100 (Moderate) | 72 (Moderate) | 61 (Good) | 45 (Good) | 65 (Good) | 73 (Moderate) |
| pm10 | 85 (Unhealthy) | 68 (Unhealthy for Sensitive Groups) | 72 (Unhealthy for Sensitive Groups) | 74 (Unhealthy for Sensitive Groups) | 89 (Unhealthy) | 109 (Unhealthy) | 79 (Unhealthy for Sensitive Groups) | 52 (Unhealthy for Sensitive Groups) | 59 (Unhealthy for Sensitive Groups) | 59 (Unhealthy for Sensitive Groups) | 52 (Unhealthy for Sensitive Groups) | 54 (Unhealthy for Sensitive Groups) | 71 (Unhealthy for Sensitive Groups) | 73 (Unhealthy for Sensitive Groups) | 82 (Unhealthy) | 82 (Unhealthy) | 107 (Unhealthy) | 95 (Unhealthy) | 89 (Unhealthy) | 75 (Unhealthy for Sensitive Groups) |
| so2 | 9 (Good) | 5.6 (Good) | 5 (Good) | 2.8 (Good) | 3.4 (Good) | 5.2 (Good) | 4 (Good) | 4.6 (Good) | 4 (Good) | 6.3 (Good) | 4.2 (Good) | 4.7 (Good) | 6 (Good) | 6.2 (Good) | 4.9 (Good) | 4.2 (Good) | 6.5 (Good) | 5 (Good) | 5.8 (Good) | 7 (Good) |
PM2,5 61 (Unhealthy)
particulate matter (PM2.5) dustNO2 22 (Good)
nitrogen dioxide (NO2)PM10 69 (Unhealthy for Sensitive Groups)
particulate matter (PM10) suspended dustCO 219 (Good)
carbon monoxide (CO)O3 0.05 (Good)
ozone (O3)SO2 7.7 (Good)
sulfur dioxide (SO2)西小区
| index | 2022-05-27 |
|---|---|
| pm25 | 28 |
| no2 | 22 |
| pm10 | 35 |
| co | 579 |
| o3 | 22 |
| so2 | 4.6 |
西小区
| index | 2020-05 | 2020-04 | 2020-03 | 2020-02 | 2020-01 | 2019-12 | 2019-11 | 2019-10 | 2019-09 | 2019-08 | 2019-07 | 2019-06 | 2019-05 | 2019-04 | 2019-03 | 2019-02 | 2019-01 | 2018-12 | 2018-11 | 2018-10 |
|---|---|---|---|---|---|---|---|---|---|---|---|---|---|---|---|---|---|---|---|---|
| pm25 | 46 | 38 | 40 | 56 | 70 | 79 | 44 | 27 | 27 | 24 | 18 | 20 | 32 | 35 | 47 | 56 | 71 | 52 | 50 | 33 |
| co | 760 | 631 | 633 | 755 | 1 | 984 | 675 | 717 | 703 | 712 | 665 | 628 | 595 | 625 | 703 | 975 | 1 | 725 | 716 | 770 |
| no2 | 36 | 35 | 34 | 19 | 40 | 53 | 42 | 34 | 34 | 30 | 31 | 20 | 26 | 33 | 42 | 32 | 52 | 35 | 39 | 38 |
| o3 | 168 | 129 | 103 | 87 | 63 | 56 | 61 | 76 | 92 | 148 | 128 | 139 | 127 | 133 | 100 | 72 | 61 | 45 | 65 | 73 |
| pm10 | 85 | 68 | 72 | 74 | 89 | 109 | 79 | 52 | 59 | 59 | 52 | 54 | 71 | 73 | 82 | 82 | 107 | 95 | 89 | 75 |
| so2 | 9 | 5.6 | 5 | 2.8 | 3.4 | 5.2 | 4 | 4.6 | 4 | 6.3 | 4.2 | 4.7 | 6 | 6.2 | 4.9 | 4.2 | 6.5 | 5 | 5.8 | 7 |