Air Pollution in Dingxi Shi: Real-time Air Quality Index and smog alert.
Pollution and air quality forecast for Dingxi Shi. Today is Tuesday, June 2, 2026. The following air pollution values have been recorded for Dingxi Shi:- particulate matter (PM10) suspended dust - 7 (Good)
- particulate matter (PM2.5) dust - 2 (Good)
- carbon monoxide (CO) - 100 (Good)
- nitrogen dioxide (NO2) - 8 (Good)
- ozone (O3) - 0 (Good)
- sulfur dioxide (SO2) - 9 (Good)

What is the air quality in Dingxi Shi today? Is the air polluted in Dingxi Shi?. Is there smog?
What is the level of PM10 today in Dingxi Shi? (particulate matter (PM10) suspended dust)
The current level of particulate matter PM10 in Dingxi Shi is:
7 (Good)
The highest PM10 values usually occur in month: 116 (November 2018).
The lowest value of particulate matter PM10 pollution in Dingxi Shi is usually recorded in: August (31).
What is the current level of PM2.5 in Dingxi Shi? (particulate matter (PM2.5) dust)
Today's PM2.5 level is:
2 (Good)
For comparison, the highest level of PM2.5 in Dingxi Shi in the last 7 days was: 24 (Friday, May 27, 2022) and the lowest: 24 (Friday, May 27, 2022).
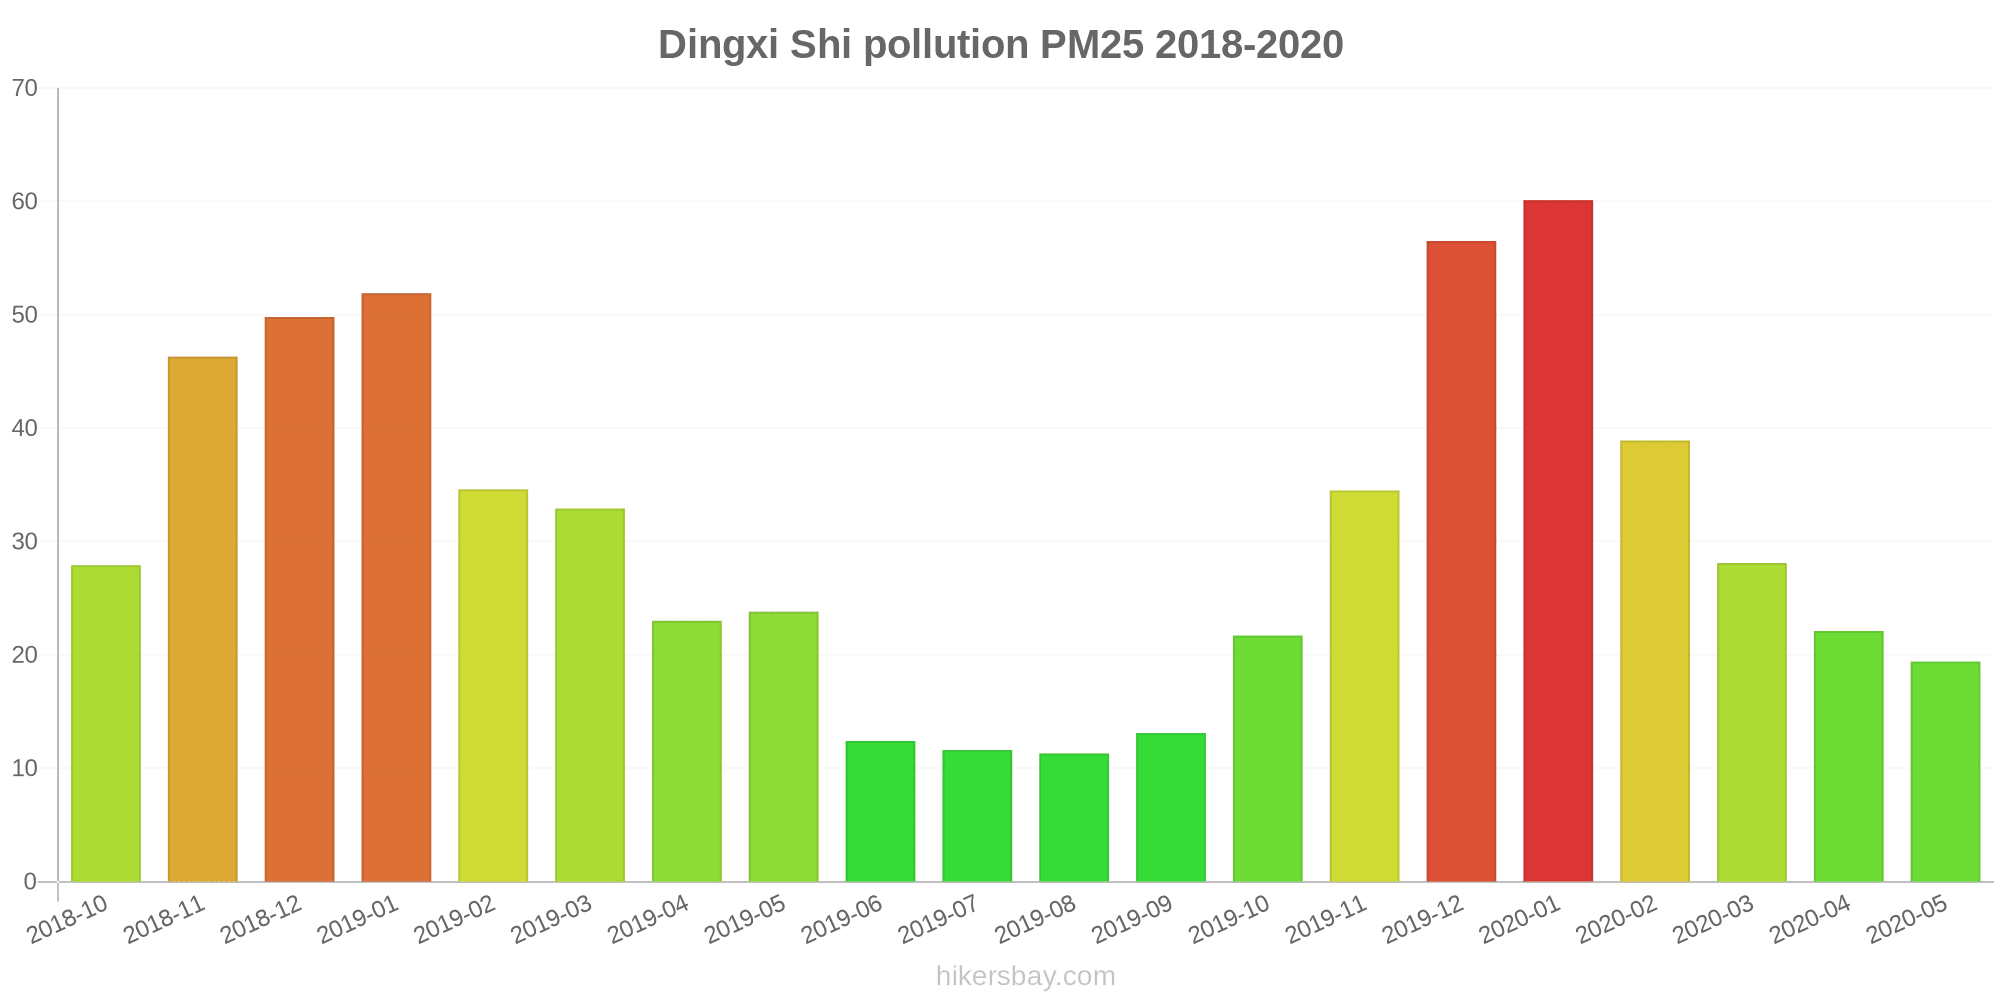
The highest PM2.5 values were recorded: 60 (January 2020).
The lowest level of particulate matter PM2.5 pollution occurs in month: August (11).
How high is the CO level? (carbon monoxide (CO))
100 (Good)
How high is the level of NO2? (nitrogen dioxide (NO2))
8 (Good)
How is the O3 level today in Dingxi Shi? (ozone (O3))
0 (Good)
What is the level of SO2 pollution? (sulfur dioxide (SO2))
9 (Good)
Current data Friday, May 27, 2022, 12:00 PM
PM10 7 (Good)
PM2,5 2 (Good)
CO 100 (Good)
NO2 8 (Good)
O3 0 (Good)
SO2 9 (Good)
Data on air pollution from recent days in Dingxi Shi
index
2022-05-27
pm10
32
Moderate
pm25
24
Moderate
co
468
Good
no2
21
Good
o3
32
Good
so2
5
Good
data source »
Air pollution in Dingxi Shi from October 2018 to May 2020

index
2020-05
2020-04
2020-03
2020-02
2020-01
2019-12
2019-11
2019-10
2019-09
2019-08
2019-07
2019-06
2019-05
2019-04
2019-03
2019-02
2019-01
2018-12
2018-11
2018-10
pm25
19 (Moderate)
22 (Moderate)
28 (Moderate)
39 (Unhealthy for Sensitive Groups)
60 (Unhealthy)
57 (Unhealthy)
35 (Moderate)
22 (Moderate)
13 (Moderate)
11 (Good)
12 (Good)
12 (Good)
24 (Moderate)
23 (Moderate)
33 (Moderate)
35 (Moderate)
52 (Unhealthy for Sensitive Groups)
50 (Unhealthy for Sensitive Groups)
46 (Unhealthy for Sensitive Groups)
28 (Moderate)
co
349 (Good)
429 (Good)
507 (Good)
692 (Good)
707 (Good)
814 (Good)
522 (Good)
483 (Good)
344 (Good)
329 (Good)
272 (Good)
310 (Good)
317 (Good)
386 (Good)
643 (Good)
717 (Good)
1 (Good)
685 (Good)
662 (Good)
485 (Good)
no2
16 (Good)
25 (Good)
25 (Good)
16 (Good)
23 (Good)
28 (Good)
25 (Good)
21 (Good)
18 (Good)
18 (Good)
19 (Good)
16 (Good)
16 (Good)
24 (Good)
25 (Good)
13 (Good)
42 (Moderate)
28 (Good)
30 (Good)
25 (Good)
o3
139 (Unhealthy for Sensitive Groups)
129 (Unhealthy for Sensitive Groups)
105 (Moderate)
81 (Moderate)
74 (Moderate)
71 (Moderate)
75 (Moderate)
82 (Moderate)
102 (Moderate)
131 (Unhealthy for Sensitive Groups)
124 (Unhealthy for Sensitive Groups)
122 (Unhealthy for Sensitive Groups)
133 (Unhealthy for Sensitive Groups)
127 (Unhealthy for Sensitive Groups)
117 (Moderate)
92 (Moderate)
86 (Moderate)
71 (Moderate)
86 (Moderate)
91 (Moderate)
pm10
65 (Unhealthy for Sensitive Groups)
64 (Unhealthy for Sensitive Groups)
71 (Unhealthy for Sensitive Groups)
74 (Unhealthy for Sensitive Groups)
87 (Unhealthy)
97 (Unhealthy)
79 (Unhealthy for Sensitive Groups)
56 (Unhealthy for Sensitive Groups)
32 (Moderate)
31 (Moderate)
33 (Moderate)
40 (Moderate)
78 (Unhealthy for Sensitive Groups)
83 (Unhealthy)
97 (Unhealthy)
79 (Unhealthy for Sensitive Groups)
88 (Unhealthy)
112 (Very Unhealthy)
116 (Very Unhealthy)
80 (Unhealthy)
so2
4.2 (Good)
4.8 (Good)
9.8 (Good)
14 (Good)
16 (Good)
22 (Good)
14 (Good)
7 (Good)
4 (Good)
4.1 (Good)
3.2 (Good)
5 (Good)
4.3 (Good)
5.7 (Good)
17 (Good)
19 (Good)
39 (Good)
29 (Good)
25 (Good)
13 (Good)
data source »
监测站(原粮食局)
Friday, May 27, 2022, 12:00 PM
PM10 6.7 (Good)
particulate matter (PM10) suspended dust
PM2,5 1.7 (Good)
particulate matter (PM2.5) dust
CO 100 (Good)
carbon monoxide (CO)
NO2 7.6 (Good)
nitrogen dioxide (NO2)
O3 0.02 (Good)
ozone (O3)
SO2 8.6 (Good)
sulfur dioxide (SO2)
监测站(原粮食局)
index
2022-05-27
pm10
32
pm25
24
co
468
no2
21
o3
32
so2
4.6
监测站(原粮食局)
2018-10 2020-05

index
2020-05
2020-04
2020-03
2020-02
2020-01
2019-12
2019-11
2019-10
2019-09
2019-08
2019-07
2019-06
2019-05
2019-04
2019-03
2019-02
2019-01
2018-12
2018-11
2018-10
pm25
19
22
28
39
60
57
35
22
13
11
12
12
24
23
33
35
52
50
46
28
co
349
429
507
692
707
814
522
483
344
329
272
310
317
386
643
717
1
685
662
485
no2
16
25
25
16
23
28
25
21
18
18
19
16
16
24
25
13
42
28
30
25
o3
139
129
105
81
74
71
75
82
102
131
124
122
133
127
117
92
86
71
86
91
pm10
65
64
71
74
87
97
79
56
32
31
33
40
78
83
97
79
88
112
116
80
so2
4.2
4.8
9.8
14
16
22
14
7
4
4.1
3.2
5
4.3
5.7
17
19
39
29
25
13
* Pollution data source:
https://openaq.org
(ChinaAQIData)
The data is licensed under CC-By 4.0
PM10 7 (Good)
PM2,5 2 (Good)
CO 100 (Good)
NO2 8 (Good)
O3 0 (Good)
SO2 9 (Good)
Data on air pollution from recent days in Dingxi Shi
| index | 2022-05-27 |
|---|---|
| pm10 | 32 Moderate |
| pm25 | 24 Moderate |
| co | 468 Good |
| no2 | 21 Good |
| o3 | 32 Good |
| so2 | 5 Good |
| index | 2020-05 | 2020-04 | 2020-03 | 2020-02 | 2020-01 | 2019-12 | 2019-11 | 2019-10 | 2019-09 | 2019-08 | 2019-07 | 2019-06 | 2019-05 | 2019-04 | 2019-03 | 2019-02 | 2019-01 | 2018-12 | 2018-11 | 2018-10 |
|---|---|---|---|---|---|---|---|---|---|---|---|---|---|---|---|---|---|---|---|---|
| pm25 | 19 (Moderate) | 22 (Moderate) | 28 (Moderate) | 39 (Unhealthy for Sensitive Groups) | 60 (Unhealthy) | 57 (Unhealthy) | 35 (Moderate) | 22 (Moderate) | 13 (Moderate) | 11 (Good) | 12 (Good) | 12 (Good) | 24 (Moderate) | 23 (Moderate) | 33 (Moderate) | 35 (Moderate) | 52 (Unhealthy for Sensitive Groups) | 50 (Unhealthy for Sensitive Groups) | 46 (Unhealthy for Sensitive Groups) | 28 (Moderate) |
| co | 349 (Good) | 429 (Good) | 507 (Good) | 692 (Good) | 707 (Good) | 814 (Good) | 522 (Good) | 483 (Good) | 344 (Good) | 329 (Good) | 272 (Good) | 310 (Good) | 317 (Good) | 386 (Good) | 643 (Good) | 717 (Good) | 1 (Good) | 685 (Good) | 662 (Good) | 485 (Good) |
| no2 | 16 (Good) | 25 (Good) | 25 (Good) | 16 (Good) | 23 (Good) | 28 (Good) | 25 (Good) | 21 (Good) | 18 (Good) | 18 (Good) | 19 (Good) | 16 (Good) | 16 (Good) | 24 (Good) | 25 (Good) | 13 (Good) | 42 (Moderate) | 28 (Good) | 30 (Good) | 25 (Good) |
| o3 | 139 (Unhealthy for Sensitive Groups) | 129 (Unhealthy for Sensitive Groups) | 105 (Moderate) | 81 (Moderate) | 74 (Moderate) | 71 (Moderate) | 75 (Moderate) | 82 (Moderate) | 102 (Moderate) | 131 (Unhealthy for Sensitive Groups) | 124 (Unhealthy for Sensitive Groups) | 122 (Unhealthy for Sensitive Groups) | 133 (Unhealthy for Sensitive Groups) | 127 (Unhealthy for Sensitive Groups) | 117 (Moderate) | 92 (Moderate) | 86 (Moderate) | 71 (Moderate) | 86 (Moderate) | 91 (Moderate) |
| pm10 | 65 (Unhealthy for Sensitive Groups) | 64 (Unhealthy for Sensitive Groups) | 71 (Unhealthy for Sensitive Groups) | 74 (Unhealthy for Sensitive Groups) | 87 (Unhealthy) | 97 (Unhealthy) | 79 (Unhealthy for Sensitive Groups) | 56 (Unhealthy for Sensitive Groups) | 32 (Moderate) | 31 (Moderate) | 33 (Moderate) | 40 (Moderate) | 78 (Unhealthy for Sensitive Groups) | 83 (Unhealthy) | 97 (Unhealthy) | 79 (Unhealthy for Sensitive Groups) | 88 (Unhealthy) | 112 (Very Unhealthy) | 116 (Very Unhealthy) | 80 (Unhealthy) |
| so2 | 4.2 (Good) | 4.8 (Good) | 9.8 (Good) | 14 (Good) | 16 (Good) | 22 (Good) | 14 (Good) | 7 (Good) | 4 (Good) | 4.1 (Good) | 3.2 (Good) | 5 (Good) | 4.3 (Good) | 5.7 (Good) | 17 (Good) | 19 (Good) | 39 (Good) | 29 (Good) | 25 (Good) | 13 (Good) |
PM10 6.7 (Good)
particulate matter (PM10) suspended dustPM2,5 1.7 (Good)
particulate matter (PM2.5) dustCO 100 (Good)
carbon monoxide (CO)NO2 7.6 (Good)
nitrogen dioxide (NO2)O3 0.02 (Good)
ozone (O3)SO2 8.6 (Good)
sulfur dioxide (SO2)监测站(原粮食局)
| index | 2022-05-27 |
|---|---|
| pm10 | 32 |
| pm25 | 24 |
| co | 468 |
| no2 | 21 |
| o3 | 32 |
| so2 | 4.6 |
监测站(原粮食局)
| index | 2020-05 | 2020-04 | 2020-03 | 2020-02 | 2020-01 | 2019-12 | 2019-11 | 2019-10 | 2019-09 | 2019-08 | 2019-07 | 2019-06 | 2019-05 | 2019-04 | 2019-03 | 2019-02 | 2019-01 | 2018-12 | 2018-11 | 2018-10 |
|---|---|---|---|---|---|---|---|---|---|---|---|---|---|---|---|---|---|---|---|---|
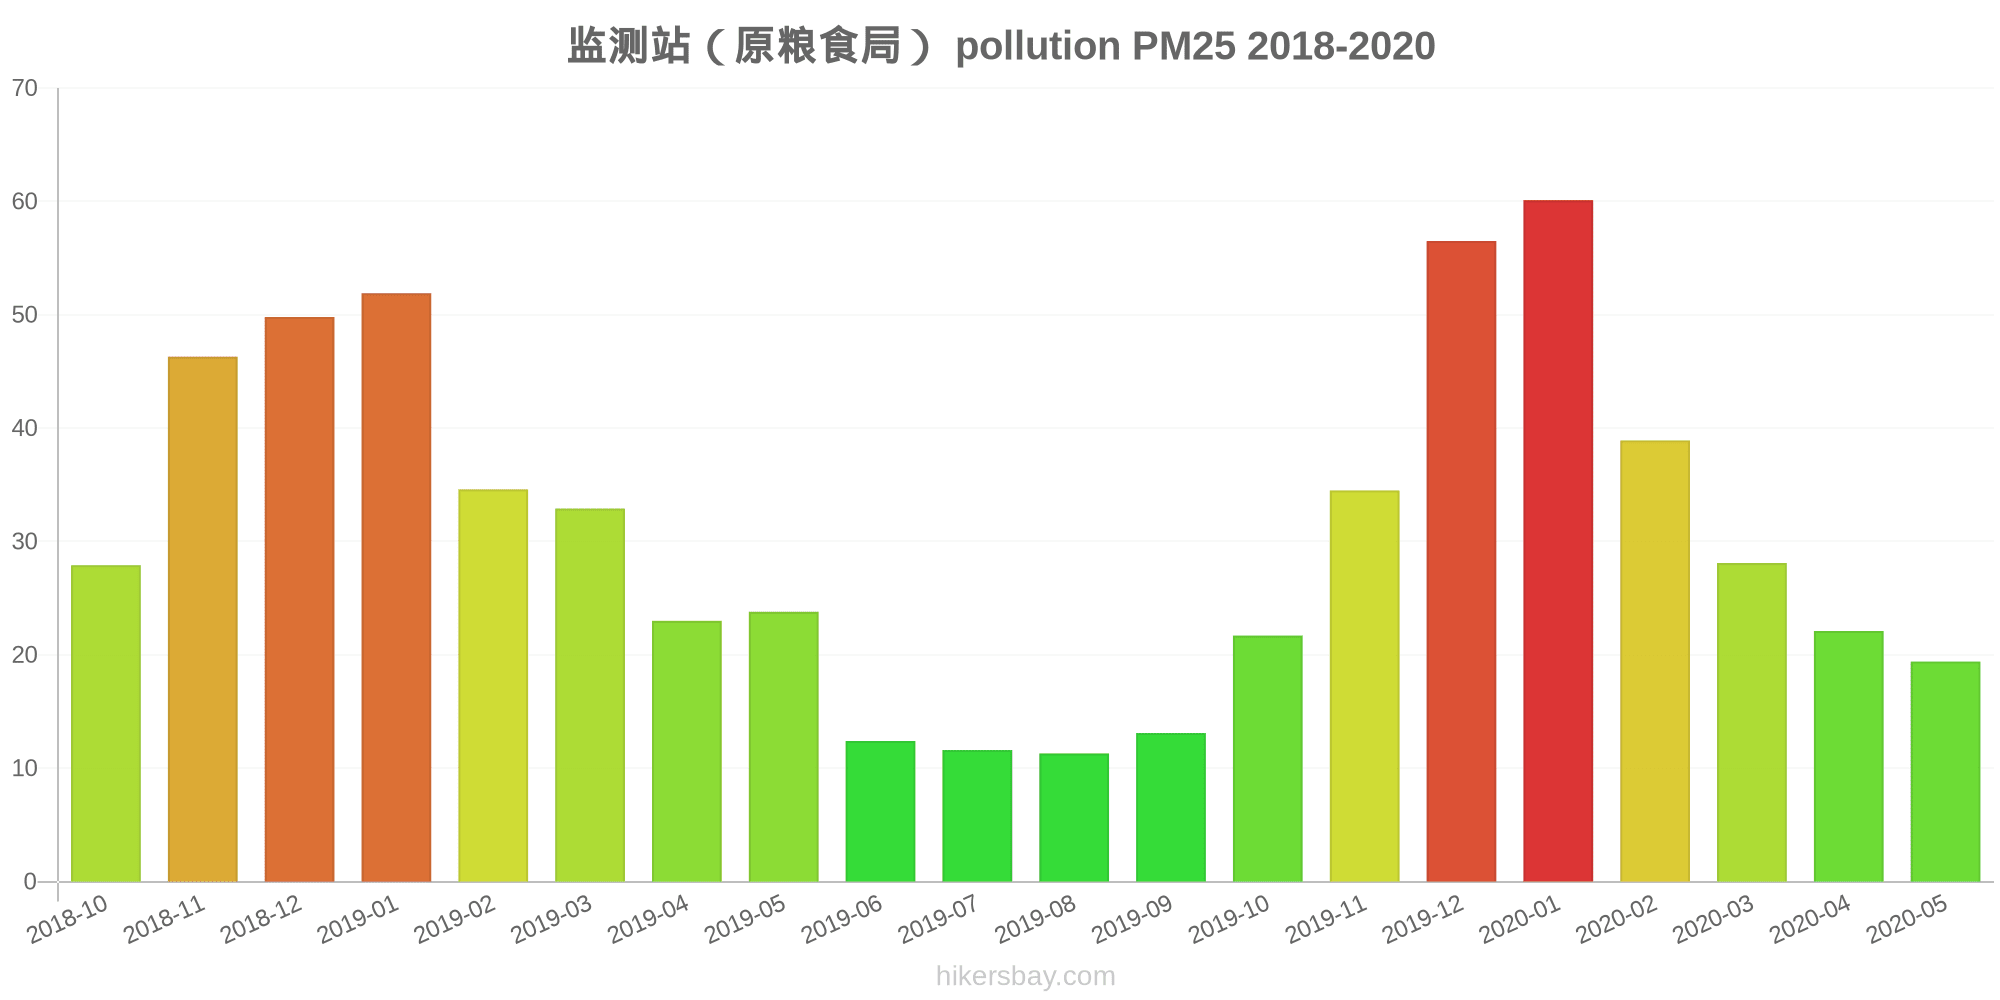
| pm25 | 19 | 22 | 28 | 39 | 60 | 57 | 35 | 22 | 13 | 11 | 12 | 12 | 24 | 23 | 33 | 35 | 52 | 50 | 46 | 28 |
| co | 349 | 429 | 507 | 692 | 707 | 814 | 522 | 483 | 344 | 329 | 272 | 310 | 317 | 386 | 643 | 717 | 1 | 685 | 662 | 485 |
| no2 | 16 | 25 | 25 | 16 | 23 | 28 | 25 | 21 | 18 | 18 | 19 | 16 | 16 | 24 | 25 | 13 | 42 | 28 | 30 | 25 |
| o3 | 139 | 129 | 105 | 81 | 74 | 71 | 75 | 82 | 102 | 131 | 124 | 122 | 133 | 127 | 117 | 92 | 86 | 71 | 86 | 91 |
| pm10 | 65 | 64 | 71 | 74 | 87 | 97 | 79 | 56 | 32 | 31 | 33 | 40 | 78 | 83 | 97 | 79 | 88 | 112 | 116 | 80 |
| so2 | 4.2 | 4.8 | 9.8 | 14 | 16 | 22 | 14 | 7 | 4 | 4.1 | 3.2 | 5 | 4.3 | 5.7 | 17 | 19 | 39 | 29 | 25 | 13 |