Air Pollution in Fengdeng: Real-time Air Quality Index and smog alert.
Pollution and air quality forecast for Fengdeng. Today is Tuesday, June 16, 2026. The following air pollution values have been recorded for Fengdeng:- particulate matter (PM10) suspended dust - 179 (Very bad Hazardous)
- particulate matter (PM2.5) dust - 35 (Unhealthy for Sensitive Groups)
- ozone (O3) - 0 (Good)
- nitrogen dioxide (NO2) - 0 (Good)
- sulfur dioxide (SO2) - 0 (Good)

What is the air quality in Fengdeng today? Is the air polluted in Fengdeng?. Is there smog?
What is the level of PM10 today in Fengdeng? (particulate matter (PM10) suspended dust)
The current level of particulate matter PM10 in Fengdeng is:
179 (Very bad Hazardous)
The highest PM10 values usually occur in month: 130 (November 2018).
The lowest value of particulate matter PM10 pollution in Fengdeng is usually recorded in: September (38).
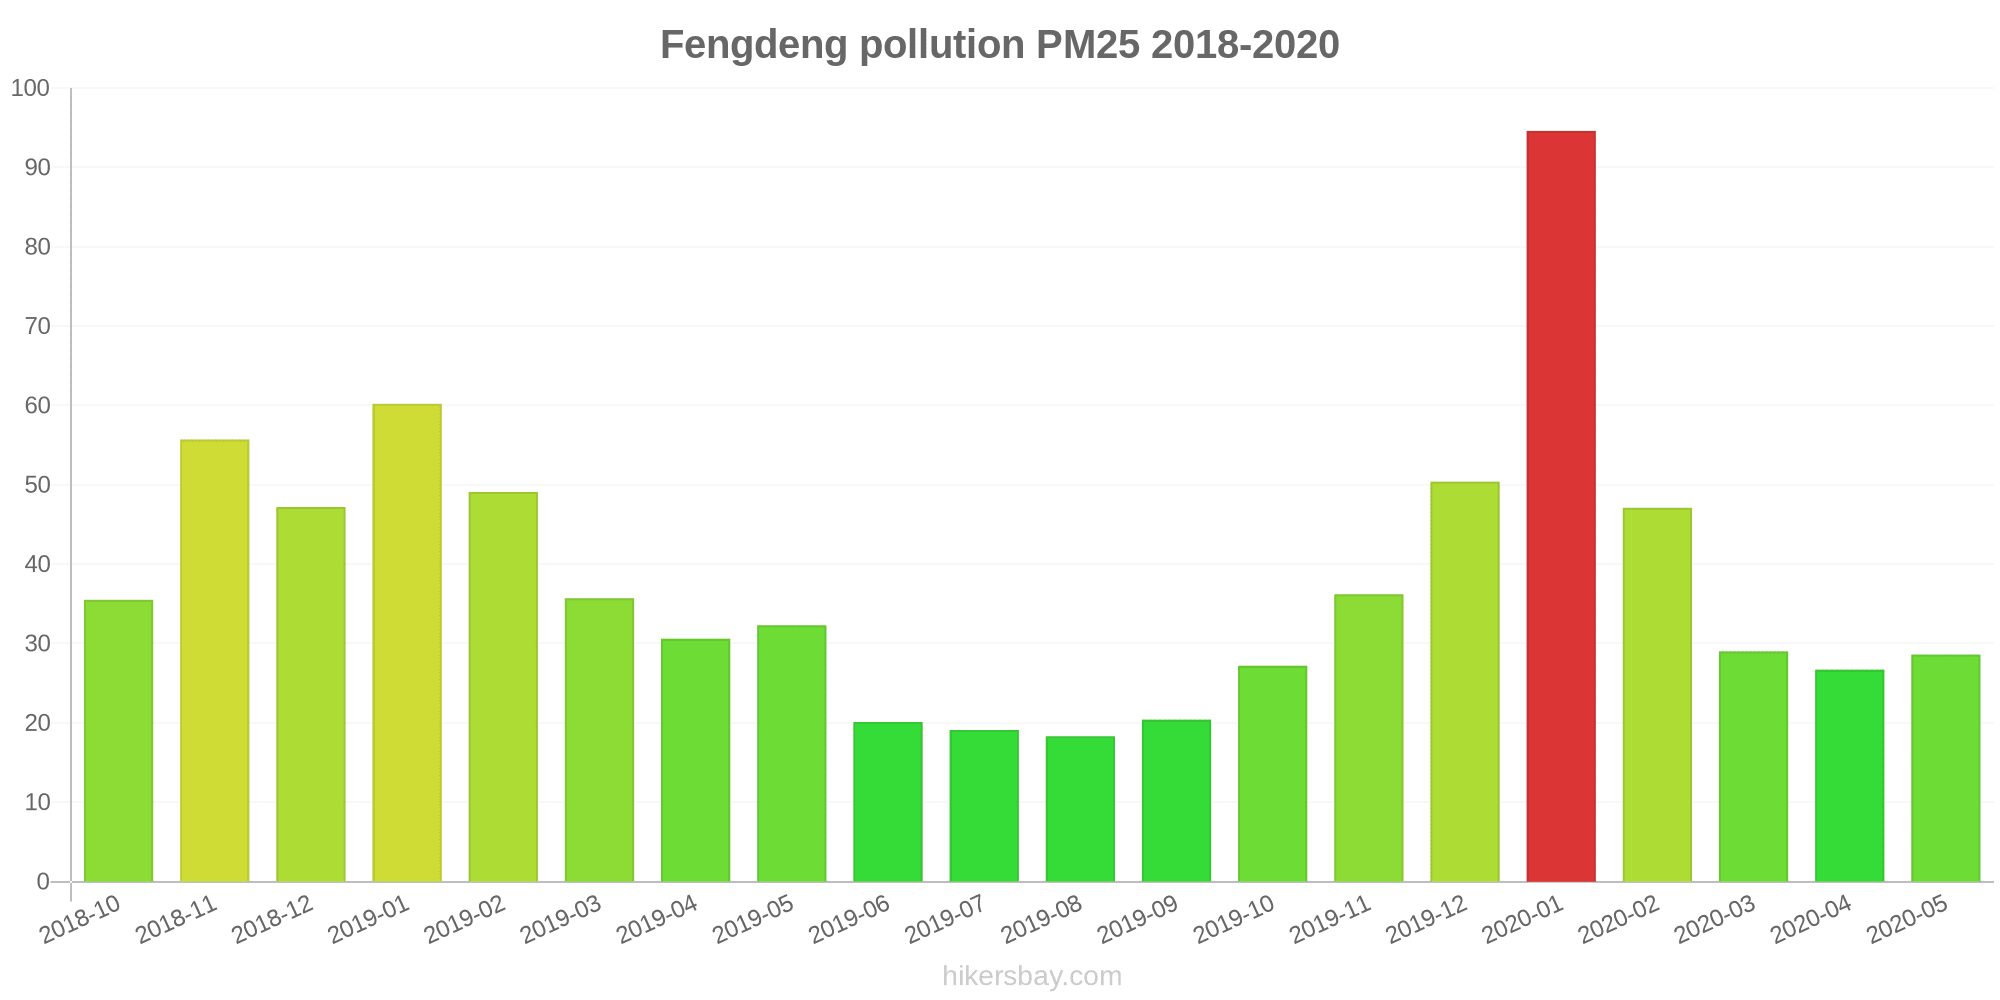
What is the current level of PM2.5 in Fengdeng? (particulate matter (PM2.5) dust)
Today's PM2.5 level is:
35 (Unhealthy for Sensitive Groups)
For comparison, the highest level of PM2.5 in Fengdeng in the last 7 days was: 56 (Friday, May 27, 2022) and the lowest: 56 (Friday, May 27, 2022).
The highest PM2.5 values were recorded: 95 (January 2020).
The lowest level of particulate matter PM2.5 pollution occurs in month: August (18).
How is the O3 level today in Fengdeng? (ozone (O3))
0 (Good)
How high is the level of NO2? (nitrogen dioxide (NO2))
0 (Good)
What is the level of SO2 pollution? (sulfur dioxide (SO2))
0 (Good)
Current data Friday, May 27, 2022, 12:00 PM
PM10 179 (Very bad Hazardous)
PM2,5 35 (Unhealthy for Sensitive Groups)
O3 0 (Good)
NO2 0 (Good)
SO2 0 (Good)
Data on air pollution from recent days in Fengdeng
index
2022-05-27
pm10
56
Unhealthy for Sensitive Groups
pm25
56
Unhealthy
o3
0
Good
no2
0
Good
so2
0
Good
data source »
Air pollution in Fengdeng from October 2018 to May 2020

index
2020-05
2020-04
2020-03
2020-02
2020-01
2019-12
2019-11
2019-10
2019-09
2019-08
2019-07
2019-06
2019-05
2019-04
2019-03
2019-02
2019-01
2018-12
2018-11
2018-10
pm25
29 (Moderate)
27 (Moderate)
29 (Moderate)
47 (Unhealthy for Sensitive Groups)
95 (Very Unhealthy)
50 (Unhealthy for Sensitive Groups)
36 (Unhealthy for Sensitive Groups)
27 (Moderate)
20 (Moderate)
18 (Moderate)
19 (Moderate)
20 (Moderate)
32 (Moderate)
31 (Moderate)
36 (Unhealthy for Sensitive Groups)
49 (Unhealthy for Sensitive Groups)
60 (Unhealthy)
47 (Unhealthy for Sensitive Groups)
56 (Unhealthy)
36 (Unhealthy for Sensitive Groups)
co
458 (Good)
683 (Good)
837 (Good)
1 (Good)
1 (Good)
1 (Good)
1 (Good)
772 (Good)
697 (Good)
716 (Good)
578 (Good)
561 (Good)
541 (Good)
859 (Good)
1 (Good)
1 (Good)
2 (Good)
1 (Good)
1 (Good)
881 (Good)
no2
26 (Good)
33 (Good)
28 (Good)
32 (Good)
52 (Moderate)
50 (Moderate)
47 (Moderate)
41 (Moderate)
36 (Good)
28 (Good)
29 (Good)
26 (Good)
25 (Good)
27 (Good)
40 (Good)
37 (Good)
51 (Moderate)
42 (Moderate)
55 (Moderate)
38 (Good)
o3
130 (Unhealthy for Sensitive Groups)
133 (Unhealthy for Sensitive Groups)
115 (Moderate)
110 (Moderate)
73 (Moderate)
68 (Good)
74 (Moderate)
92 (Moderate)
141 (Unhealthy for Sensitive Groups)
161 (Unhealthy)
172 (Unhealthy)
158 (Unhealthy)
143 (Unhealthy for Sensitive Groups)
144 (Unhealthy for Sensitive Groups)
113 (Moderate)
93 (Moderate)
58 (Good)
61 (Good)
71 (Moderate)
94 (Moderate)
pm10
98 (Unhealthy)
71 (Unhealthy for Sensitive Groups)
83 (Unhealthy)
90 (Unhealthy)
122 (Very Unhealthy)
78 (Unhealthy for Sensitive Groups)
81 (Unhealthy)
58 (Unhealthy for Sensitive Groups)
38 (Moderate)
39 (Moderate)
43 (Moderate)
39 (Moderate)
97 (Unhealthy)
88 (Unhealthy)
79 (Unhealthy for Sensitive Groups)
91 (Unhealthy)
102 (Unhealthy)
111 (Very Unhealthy)
130 (Very Unhealthy)
72 (Unhealthy for Sensitive Groups)
so2
11 (Good)
11 (Good)
12 (Good)
21 (Good)
20 (Good)
20 (Good)
17 (Good)
11 (Good)
11 (Good)
12 (Good)
12 (Good)
11 (Good)
7.7 (Good)
9 (Good)
15 (Good)
24 (Good)
36 (Good)
29 (Good)
25 (Good)
14 (Good)
data source »
贺兰山东路
Friday, May 27, 2022, 12:00 PM
PM10 179 (Very bad Hazardous)
particulate matter (PM10) suspended dust
PM2,5 35 (Unhealthy for Sensitive Groups)
particulate matter (PM2.5) dust
O3 0.04 (Good)
ozone (O3)
NO2 0 (Good)
nitrogen dioxide (NO2)
SO2 0 (Good)
sulfur dioxide (SO2)
贺兰山东路
index
2022-05-27
pm10
56
pm25
56
o3
0.03
no2
0
so2
0
贺兰山东路
2018-10 2020-05

index
2020-05
2020-04
2020-03
2020-02
2020-01
2019-12
2019-11
2019-10
2019-09
2019-08
2019-07
2019-06
2019-05
2019-04
2019-03
2019-02
2019-01
2018-12
2018-11
2018-10
pm25
29
27
29
47
95
50
36
27
20
18
19
20
32
31
36
49
60
47
56
36
co
458
683
837
1
1
1
1
772
697
716
578
561
541
859
1
1
2
1
1
881
no2
26
33
28
32
52
50
47
41
36
28
29
26
25
27
40
37
51
42
55
38
o3
130
133
115
110
73
68
74
92
141
161
172
158
143
144
113
93
58
61
71
94
pm10
98
71
83
90
122
78
81
58
38
39
43
39
97
88
79
91
102
111
130
72
so2
11
11
12
21
20
20
17
11
11
12
12
11
7.7
9
15
24
36
29
25
14
* Pollution data source:
https://openaq.org
(ChinaAQIData)
The data is licensed under CC-By 4.0
PM10 179 (Very bad Hazardous)
PM2,5 35 (Unhealthy for Sensitive Groups)
O3 0 (Good)
NO2 0 (Good)
SO2 0 (Good)
Data on air pollution from recent days in Fengdeng
| index | 2022-05-27 |
|---|---|
| pm10 | 56 Unhealthy for Sensitive Groups |
| pm25 | 56 Unhealthy |
| o3 | 0 Good |
| no2 | 0 Good |
| so2 | 0 Good |
| index | 2020-05 | 2020-04 | 2020-03 | 2020-02 | 2020-01 | 2019-12 | 2019-11 | 2019-10 | 2019-09 | 2019-08 | 2019-07 | 2019-06 | 2019-05 | 2019-04 | 2019-03 | 2019-02 | 2019-01 | 2018-12 | 2018-11 | 2018-10 |
|---|---|---|---|---|---|---|---|---|---|---|---|---|---|---|---|---|---|---|---|---|
| pm25 | 29 (Moderate) | 27 (Moderate) | 29 (Moderate) | 47 (Unhealthy for Sensitive Groups) | 95 (Very Unhealthy) | 50 (Unhealthy for Sensitive Groups) | 36 (Unhealthy for Sensitive Groups) | 27 (Moderate) | 20 (Moderate) | 18 (Moderate) | 19 (Moderate) | 20 (Moderate) | 32 (Moderate) | 31 (Moderate) | 36 (Unhealthy for Sensitive Groups) | 49 (Unhealthy for Sensitive Groups) | 60 (Unhealthy) | 47 (Unhealthy for Sensitive Groups) | 56 (Unhealthy) | 36 (Unhealthy for Sensitive Groups) |
| co | 458 (Good) | 683 (Good) | 837 (Good) | 1 (Good) | 1 (Good) | 1 (Good) | 1 (Good) | 772 (Good) | 697 (Good) | 716 (Good) | 578 (Good) | 561 (Good) | 541 (Good) | 859 (Good) | 1 (Good) | 1 (Good) | 2 (Good) | 1 (Good) | 1 (Good) | 881 (Good) |
| no2 | 26 (Good) | 33 (Good) | 28 (Good) | 32 (Good) | 52 (Moderate) | 50 (Moderate) | 47 (Moderate) | 41 (Moderate) | 36 (Good) | 28 (Good) | 29 (Good) | 26 (Good) | 25 (Good) | 27 (Good) | 40 (Good) | 37 (Good) | 51 (Moderate) | 42 (Moderate) | 55 (Moderate) | 38 (Good) |
| o3 | 130 (Unhealthy for Sensitive Groups) | 133 (Unhealthy for Sensitive Groups) | 115 (Moderate) | 110 (Moderate) | 73 (Moderate) | 68 (Good) | 74 (Moderate) | 92 (Moderate) | 141 (Unhealthy for Sensitive Groups) | 161 (Unhealthy) | 172 (Unhealthy) | 158 (Unhealthy) | 143 (Unhealthy for Sensitive Groups) | 144 (Unhealthy for Sensitive Groups) | 113 (Moderate) | 93 (Moderate) | 58 (Good) | 61 (Good) | 71 (Moderate) | 94 (Moderate) |
| pm10 | 98 (Unhealthy) | 71 (Unhealthy for Sensitive Groups) | 83 (Unhealthy) | 90 (Unhealthy) | 122 (Very Unhealthy) | 78 (Unhealthy for Sensitive Groups) | 81 (Unhealthy) | 58 (Unhealthy for Sensitive Groups) | 38 (Moderate) | 39 (Moderate) | 43 (Moderate) | 39 (Moderate) | 97 (Unhealthy) | 88 (Unhealthy) | 79 (Unhealthy for Sensitive Groups) | 91 (Unhealthy) | 102 (Unhealthy) | 111 (Very Unhealthy) | 130 (Very Unhealthy) | 72 (Unhealthy for Sensitive Groups) |
| so2 | 11 (Good) | 11 (Good) | 12 (Good) | 21 (Good) | 20 (Good) | 20 (Good) | 17 (Good) | 11 (Good) | 11 (Good) | 12 (Good) | 12 (Good) | 11 (Good) | 7.7 (Good) | 9 (Good) | 15 (Good) | 24 (Good) | 36 (Good) | 29 (Good) | 25 (Good) | 14 (Good) |
PM10 179 (Very bad Hazardous)
particulate matter (PM10) suspended dustPM2,5 35 (Unhealthy for Sensitive Groups)
particulate matter (PM2.5) dustO3 0.04 (Good)
ozone (O3)NO2 0 (Good)
nitrogen dioxide (NO2)SO2 0 (Good)
sulfur dioxide (SO2)贺兰山东路
| index | 2022-05-27 |
|---|---|
| pm10 | 56 |
| pm25 | 56 |
| o3 | 0.03 |
| no2 | 0 |
| so2 | 0 |
贺兰山东路

| index | 2020-05 | 2020-04 | 2020-03 | 2020-02 | 2020-01 | 2019-12 | 2019-11 | 2019-10 | 2019-09 | 2019-08 | 2019-07 | 2019-06 | 2019-05 | 2019-04 | 2019-03 | 2019-02 | 2019-01 | 2018-12 | 2018-11 | 2018-10 |
|---|---|---|---|---|---|---|---|---|---|---|---|---|---|---|---|---|---|---|---|---|
| pm25 | 29 | 27 | 29 | 47 | 95 | 50 | 36 | 27 | 20 | 18 | 19 | 20 | 32 | 31 | 36 | 49 | 60 | 47 | 56 | 36 |
| co | 458 | 683 | 837 | 1 | 1 | 1 | 1 | 772 | 697 | 716 | 578 | 561 | 541 | 859 | 1 | 1 | 2 | 1 | 1 | 881 |
| no2 | 26 | 33 | 28 | 32 | 52 | 50 | 47 | 41 | 36 | 28 | 29 | 26 | 25 | 27 | 40 | 37 | 51 | 42 | 55 | 38 |
| o3 | 130 | 133 | 115 | 110 | 73 | 68 | 74 | 92 | 141 | 161 | 172 | 158 | 143 | 144 | 113 | 93 | 58 | 61 | 71 | 94 |
| pm10 | 98 | 71 | 83 | 90 | 122 | 78 | 81 | 58 | 38 | 39 | 43 | 39 | 97 | 88 | 79 | 91 | 102 | 111 | 130 | 72 |
| so2 | 11 | 11 | 12 | 21 | 20 | 20 | 17 | 11 | 11 | 12 | 12 | 11 | 7.7 | 9 | 15 | 24 | 36 | 29 | 25 | 14 |