Air Pollution in Fujiatun: Real-time Air Quality Index and smog alert.
Pollution and air quality forecast for Fujiatun. Today is Tuesday, June 2, 2026. The following air pollution values have been recorded for Fujiatun:- particulate matter (PM10) suspended dust - 179 (Very bad Hazardous)
- particulate matter (PM2.5) dust - 35 (Unhealthy for Sensitive Groups)
- ozone (O3) - 0 (Good)
- nitrogen dioxide (NO2) - 0 (Good)
- sulfur dioxide (SO2) - 0 (Good)

What is the air quality in Fujiatun today? Is the air polluted in Fujiatun?. Is there smog?
What is the level of PM10 today in Fujiatun? (particulate matter (PM10) suspended dust)
The current level of particulate matter PM10 in Fujiatun is:
179 (Very bad Hazardous)
The highest PM10 values usually occur in month: 185 (November 2018).
The lowest value of particulate matter PM10 pollution in Fujiatun is usually recorded in: August (63).
What is the current level of PM2.5 in Fujiatun? (particulate matter (PM2.5) dust)
Today's PM2.5 level is:
35 (Unhealthy for Sensitive Groups)
For comparison, the highest level of PM2.5 in Fujiatun in the last 7 days was: 56 (Friday, May 27, 2022) and the lowest: 56 (Friday, May 27, 2022).
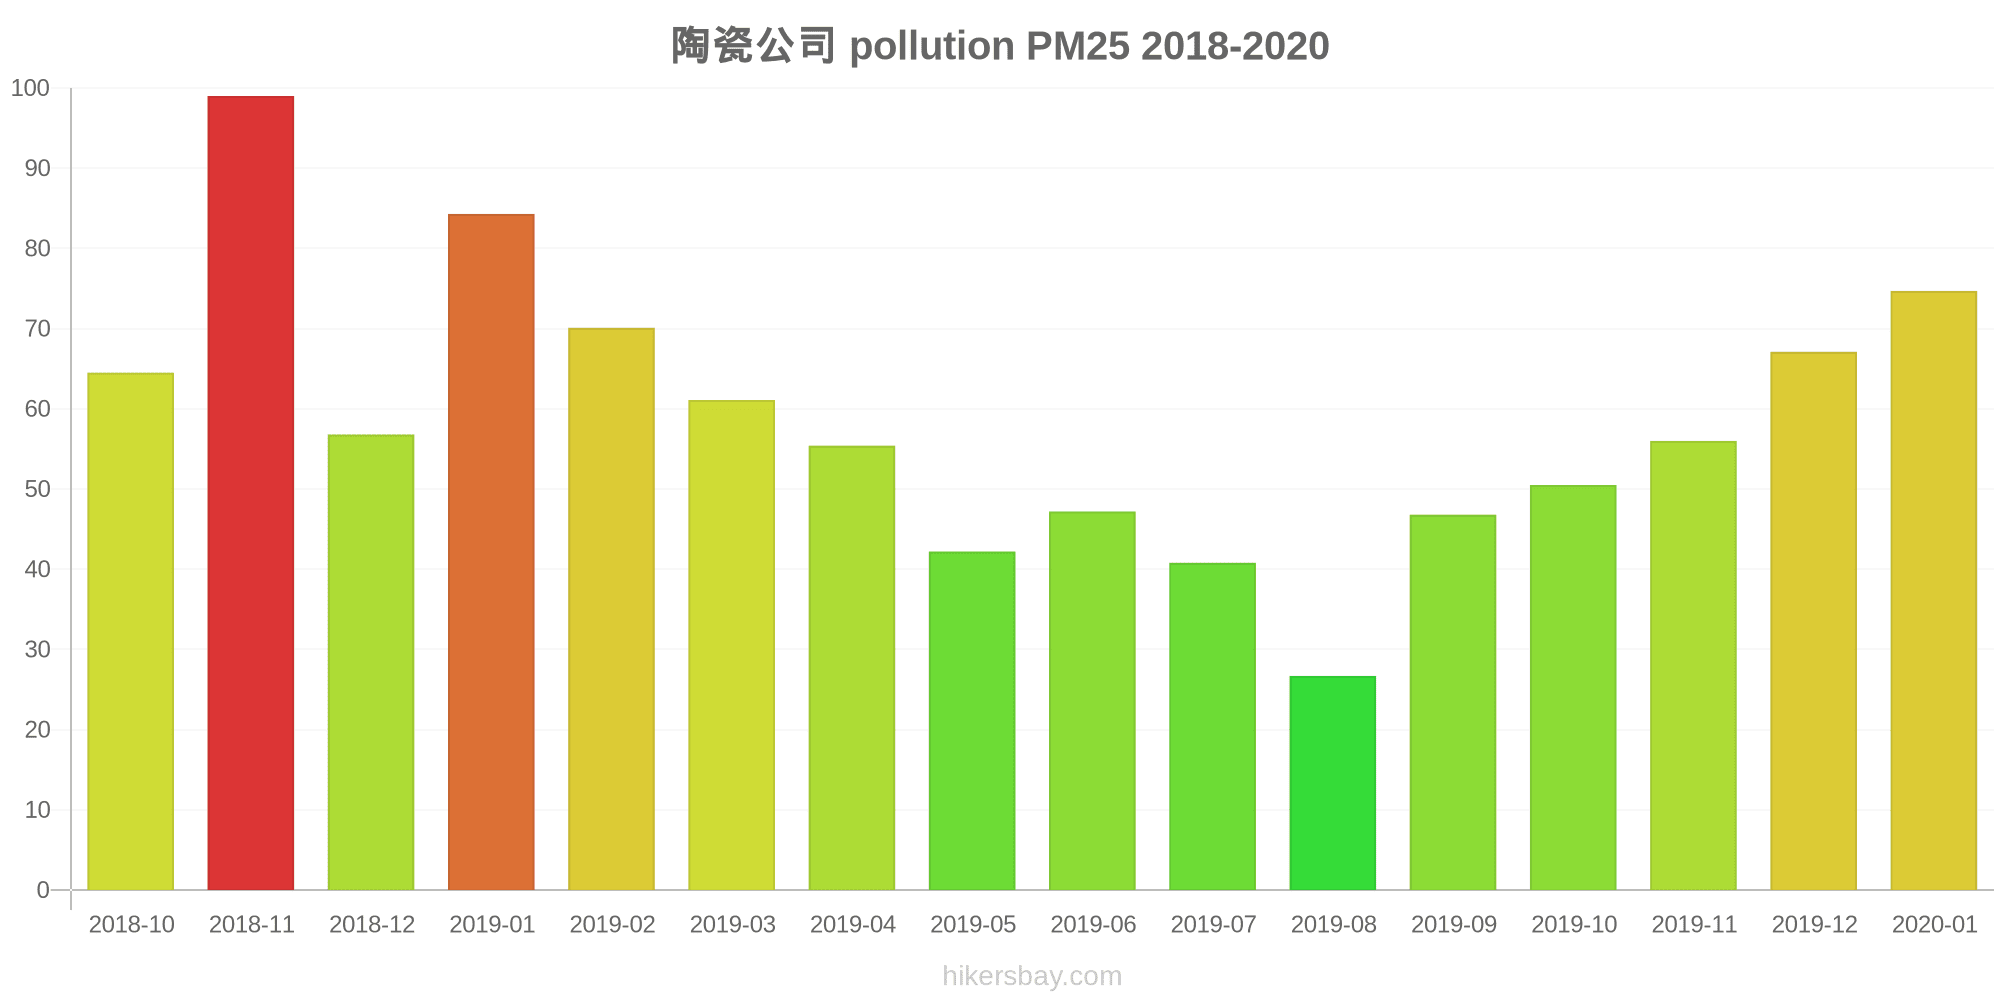
The highest PM2.5 values were recorded: 99 (November 2018).
The lowest level of particulate matter PM2.5 pollution occurs in month: August (27).
How is the O3 level today in Fujiatun? (ozone (O3))
0 (Good)
How high is the level of NO2? (nitrogen dioxide (NO2))
0 (Good)
What is the level of SO2 pollution? (sulfur dioxide (SO2))
0 (Good)
Current data Friday, May 27, 2022, 12:00 PM
PM10 179 (Very bad Hazardous)
PM2,5 35 (Unhealthy for Sensitive Groups)
O3 0 (Good)
NO2 0 (Good)
SO2 0 (Good)
Data on air pollution from recent days in Fujiatun
index
2022-05-27
pm10
56
Unhealthy for Sensitive Groups
pm25
56
Unhealthy
o3
0
Good
no2
0
Good
so2
0
Good
data source »
Air pollution in Fujiatun from October 2018 to January 2020

index
2020-01
2019-12
2019-11
2019-10
2019-09
2019-08
2019-07
2019-06
2019-05
2019-04
2019-03
2019-02
2019-01
2018-12
2018-11
2018-10
pm25
75 (Unhealthy)
67 (Unhealthy)
56 (Unhealthy)
51 (Unhealthy for Sensitive Groups)
47 (Unhealthy for Sensitive Groups)
27 (Moderate)
41 (Unhealthy for Sensitive Groups)
47 (Unhealthy for Sensitive Groups)
42 (Unhealthy for Sensitive Groups)
55 (Unhealthy)
61 (Unhealthy)
70 (Unhealthy)
84 (Very Unhealthy)
57 (Unhealthy)
99 (Very Unhealthy)
65 (Unhealthy)
co
2 (Good)
1 (Good)
1 (Good)
1 (Good)
1 (Good)
1 (Good)
1 (Good)
1 (Good)
1 (Good)
1 (Good)
1 (Good)
1 (Good)
1 (Good)
1 (Good)
1 (Good)
1 (Good)
no2
70 (Moderate)
59 (Moderate)
62 (Moderate)
65 (Moderate)
54 (Moderate)
40 (Moderate)
40 (Good)
52 (Moderate)
51 (Moderate)
48 (Moderate)
58 (Moderate)
54 (Moderate)
70 (Moderate)
55 (Moderate)
69 (Moderate)
62 (Moderate)
o3
43 (Good)
37 (Good)
47 (Good)
89 (Moderate)
168 (Unhealthy)
125 (Unhealthy for Sensitive Groups)
180 (Very Unhealthy)
196 (Very Unhealthy)
165 (Unhealthy)
123 (Unhealthy for Sensitive Groups)
101 (Moderate)
75 (Moderate)
47 (Good)
48 (Good)
58 (Good)
76 (Moderate)
pm10
138 (Very Unhealthy)
130 (Very Unhealthy)
128 (Very Unhealthy)
119 (Very Unhealthy)
109 (Unhealthy)
63 (Unhealthy for Sensitive Groups)
90 (Unhealthy)
111 (Very Unhealthy)
115 (Very Unhealthy)
128 (Very Unhealthy)
128 (Very Unhealthy)
127 (Very Unhealthy)
152 (Very bad Hazardous)
121 (Very Unhealthy)
185 (Very bad Hazardous)
136 (Very Unhealthy)
so2
38 (Good)
24 (Good)
31 (Good)
18 (Good)
18 (Good)
15 (Good)
19 (Good)
36 (Good)
23 (Good)
24 (Good)
26 (Good)
25 (Good)
26 (Good)
33 (Good)
37 (Good)
26 (Good)
data source »
消防缸窑路中队(启用200109)
Friday, May 27, 2022, 12:00 PM
PM10 179 (Very bad Hazardous)
particulate matter (PM10) suspended dust
PM2,5 35 (Unhealthy for Sensitive Groups)
particulate matter (PM2.5) dust
O3 0.04 (Good)
ozone (O3)
NO2 0 (Good)
nitrogen dioxide (NO2)
SO2 0 (Good)
sulfur dioxide (SO2)
消防缸窑路中队(启用200109)
index
2022-05-27
pm10
56
pm25
56
o3
0.03
no2
0
so2
0
陶瓷公司
2018-10 2020-01

index
2020-01
2019-12
2019-11
2019-10
2019-09
2019-08
2019-07
2019-06
2019-05
2019-04
2019-03
2019-02
2019-01
2018-12
2018-11
2018-10
pm25
75
67
56
51
47
27
41
47
42
55
61
70
84
57
99
65
co
2
1
1
1
1
1
1
1
1
1
1
1
1
1
1
1
no2
70
59
62
65
54
40
40
52
51
48
58
54
70
55
69
62
o3
43
37
47
89
168
125
180
196
165
123
101
75
47
48
58
76
pm10
138
130
128
119
109
63
90
111
115
128
128
127
152
121
185
136
so2
38
24
31
18
18
15
19
36
23
24
26
25
26
33
37
26
* Pollution data source:
https://openaq.org
(ChinaAQIData)
The data is licensed under CC-By 4.0
PM10 179 (Very bad Hazardous)
PM2,5 35 (Unhealthy for Sensitive Groups)
O3 0 (Good)
NO2 0 (Good)
SO2 0 (Good)
Data on air pollution from recent days in Fujiatun
| index | 2022-05-27 |
|---|---|
| pm10 | 56 Unhealthy for Sensitive Groups |
| pm25 | 56 Unhealthy |
| o3 | 0 Good |
| no2 | 0 Good |
| so2 | 0 Good |

| index | 2020-01 | 2019-12 | 2019-11 | 2019-10 | 2019-09 | 2019-08 | 2019-07 | 2019-06 | 2019-05 | 2019-04 | 2019-03 | 2019-02 | 2019-01 | 2018-12 | 2018-11 | 2018-10 |
|---|---|---|---|---|---|---|---|---|---|---|---|---|---|---|---|---|
| pm25 | 75 (Unhealthy) | 67 (Unhealthy) | 56 (Unhealthy) | 51 (Unhealthy for Sensitive Groups) | 47 (Unhealthy for Sensitive Groups) | 27 (Moderate) | 41 (Unhealthy for Sensitive Groups) | 47 (Unhealthy for Sensitive Groups) | 42 (Unhealthy for Sensitive Groups) | 55 (Unhealthy) | 61 (Unhealthy) | 70 (Unhealthy) | 84 (Very Unhealthy) | 57 (Unhealthy) | 99 (Very Unhealthy) | 65 (Unhealthy) |
| co | 2 (Good) | 1 (Good) | 1 (Good) | 1 (Good) | 1 (Good) | 1 (Good) | 1 (Good) | 1 (Good) | 1 (Good) | 1 (Good) | 1 (Good) | 1 (Good) | 1 (Good) | 1 (Good) | 1 (Good) | 1 (Good) |
| no2 | 70 (Moderate) | 59 (Moderate) | 62 (Moderate) | 65 (Moderate) | 54 (Moderate) | 40 (Moderate) | 40 (Good) | 52 (Moderate) | 51 (Moderate) | 48 (Moderate) | 58 (Moderate) | 54 (Moderate) | 70 (Moderate) | 55 (Moderate) | 69 (Moderate) | 62 (Moderate) |
| o3 | 43 (Good) | 37 (Good) | 47 (Good) | 89 (Moderate) | 168 (Unhealthy) | 125 (Unhealthy for Sensitive Groups) | 180 (Very Unhealthy) | 196 (Very Unhealthy) | 165 (Unhealthy) | 123 (Unhealthy for Sensitive Groups) | 101 (Moderate) | 75 (Moderate) | 47 (Good) | 48 (Good) | 58 (Good) | 76 (Moderate) |
| pm10 | 138 (Very Unhealthy) | 130 (Very Unhealthy) | 128 (Very Unhealthy) | 119 (Very Unhealthy) | 109 (Unhealthy) | 63 (Unhealthy for Sensitive Groups) | 90 (Unhealthy) | 111 (Very Unhealthy) | 115 (Very Unhealthy) | 128 (Very Unhealthy) | 128 (Very Unhealthy) | 127 (Very Unhealthy) | 152 (Very bad Hazardous) | 121 (Very Unhealthy) | 185 (Very bad Hazardous) | 136 (Very Unhealthy) |
| so2 | 38 (Good) | 24 (Good) | 31 (Good) | 18 (Good) | 18 (Good) | 15 (Good) | 19 (Good) | 36 (Good) | 23 (Good) | 24 (Good) | 26 (Good) | 25 (Good) | 26 (Good) | 33 (Good) | 37 (Good) | 26 (Good) |
PM10 179 (Very bad Hazardous)
particulate matter (PM10) suspended dustPM2,5 35 (Unhealthy for Sensitive Groups)
particulate matter (PM2.5) dustO3 0.04 (Good)
ozone (O3)NO2 0 (Good)
nitrogen dioxide (NO2)SO2 0 (Good)
sulfur dioxide (SO2)消防缸窑路中队(启用200109)
| index | 2022-05-27 |
|---|---|
| pm10 | 56 |
| pm25 | 56 |
| o3 | 0.03 |
| no2 | 0 |
| so2 | 0 |
陶瓷公司
| index | 2020-01 | 2019-12 | 2019-11 | 2019-10 | 2019-09 | 2019-08 | 2019-07 | 2019-06 | 2019-05 | 2019-04 | 2019-03 | 2019-02 | 2019-01 | 2018-12 | 2018-11 | 2018-10 |
|---|---|---|---|---|---|---|---|---|---|---|---|---|---|---|---|---|
| pm25 | 75 | 67 | 56 | 51 | 47 | 27 | 41 | 47 | 42 | 55 | 61 | 70 | 84 | 57 | 99 | 65 |
| co | 2 | 1 | 1 | 1 | 1 | 1 | 1 | 1 | 1 | 1 | 1 | 1 | 1 | 1 | 1 | 1 |
| no2 | 70 | 59 | 62 | 65 | 54 | 40 | 40 | 52 | 51 | 48 | 58 | 54 | 70 | 55 | 69 | 62 |
| o3 | 43 | 37 | 47 | 89 | 168 | 125 | 180 | 196 | 165 | 123 | 101 | 75 | 47 | 48 | 58 | 76 |
| pm10 | 138 | 130 | 128 | 119 | 109 | 63 | 90 | 111 | 115 | 128 | 128 | 127 | 152 | 121 | 185 | 136 |
| so2 | 38 | 24 | 31 | 18 | 18 | 15 | 19 | 36 | 23 | 24 | 26 | 25 | 26 | 33 | 37 | 26 |