Air Pollution in Gangyao: Real-time Air Quality Index and smog alert.
Pollution and air quality forecast for Gangyao. Today is Tuesday, June 2, 2026. The following air pollution values have been recorded for Gangyao:- particulate matter (PM10) suspended dust - 179 (Very bad Hazardous)
- particulate matter (PM2.5) dust - 35 (Unhealthy for Sensitive Groups)
- ozone (O3) - 0 (Good)
- nitrogen dioxide (NO2) - 0 (Good)
- sulfur dioxide (SO2) - 0 (Good)

What is the air quality in Gangyao today? Is the air polluted in Gangyao?. Is there smog?
What is the level of PM10 today in Gangyao? (particulate matter (PM10) suspended dust)
The current level of particulate matter PM10 in Gangyao is:
179 (Very bad Hazardous)
The highest PM10 values usually occur in month: 154 (November 2018).
The lowest value of particulate matter PM10 pollution in Gangyao is usually recorded in: August (51).
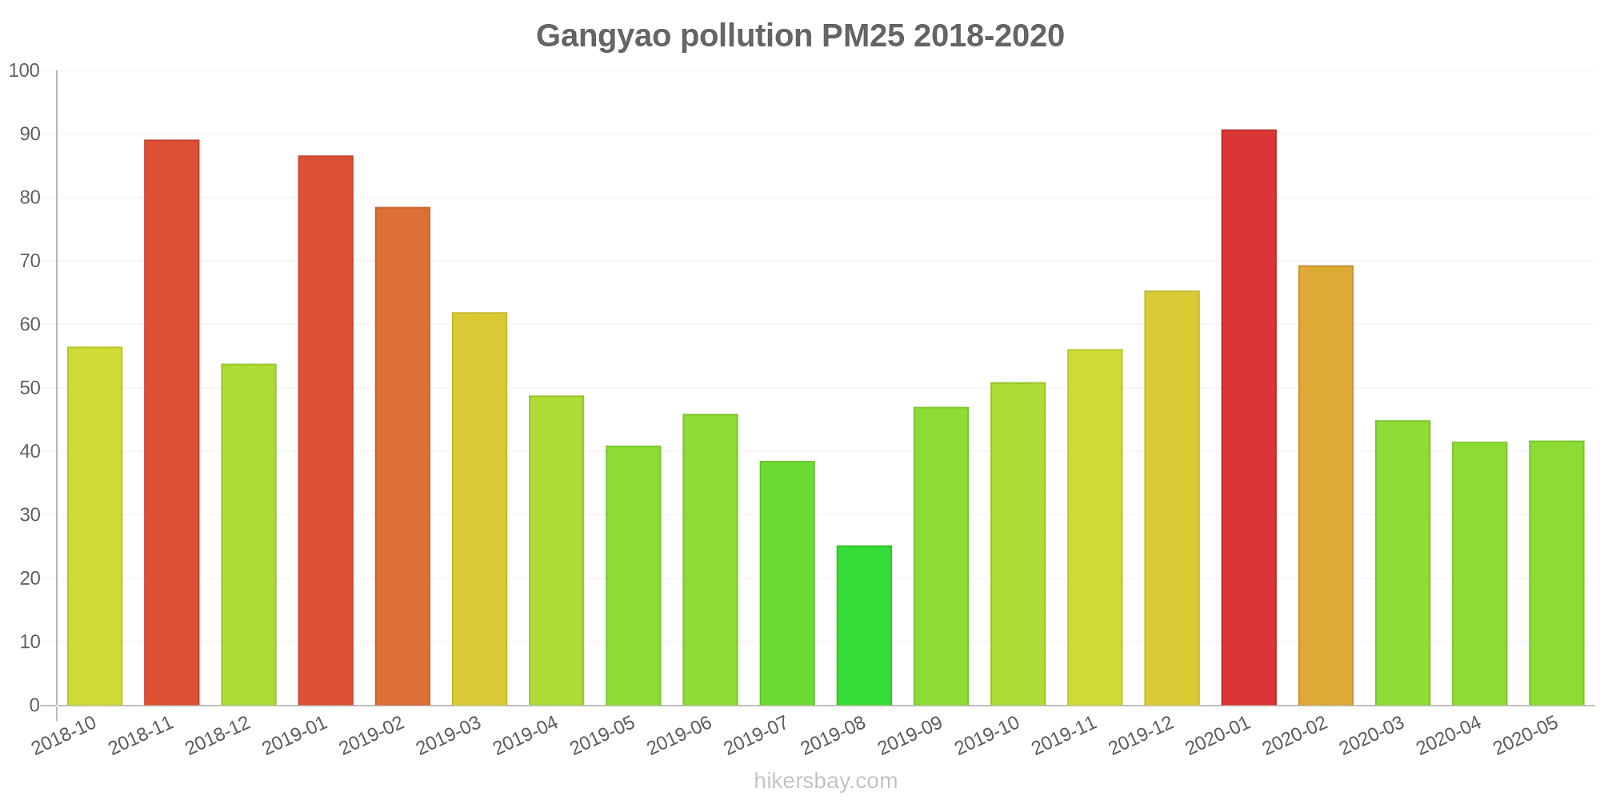
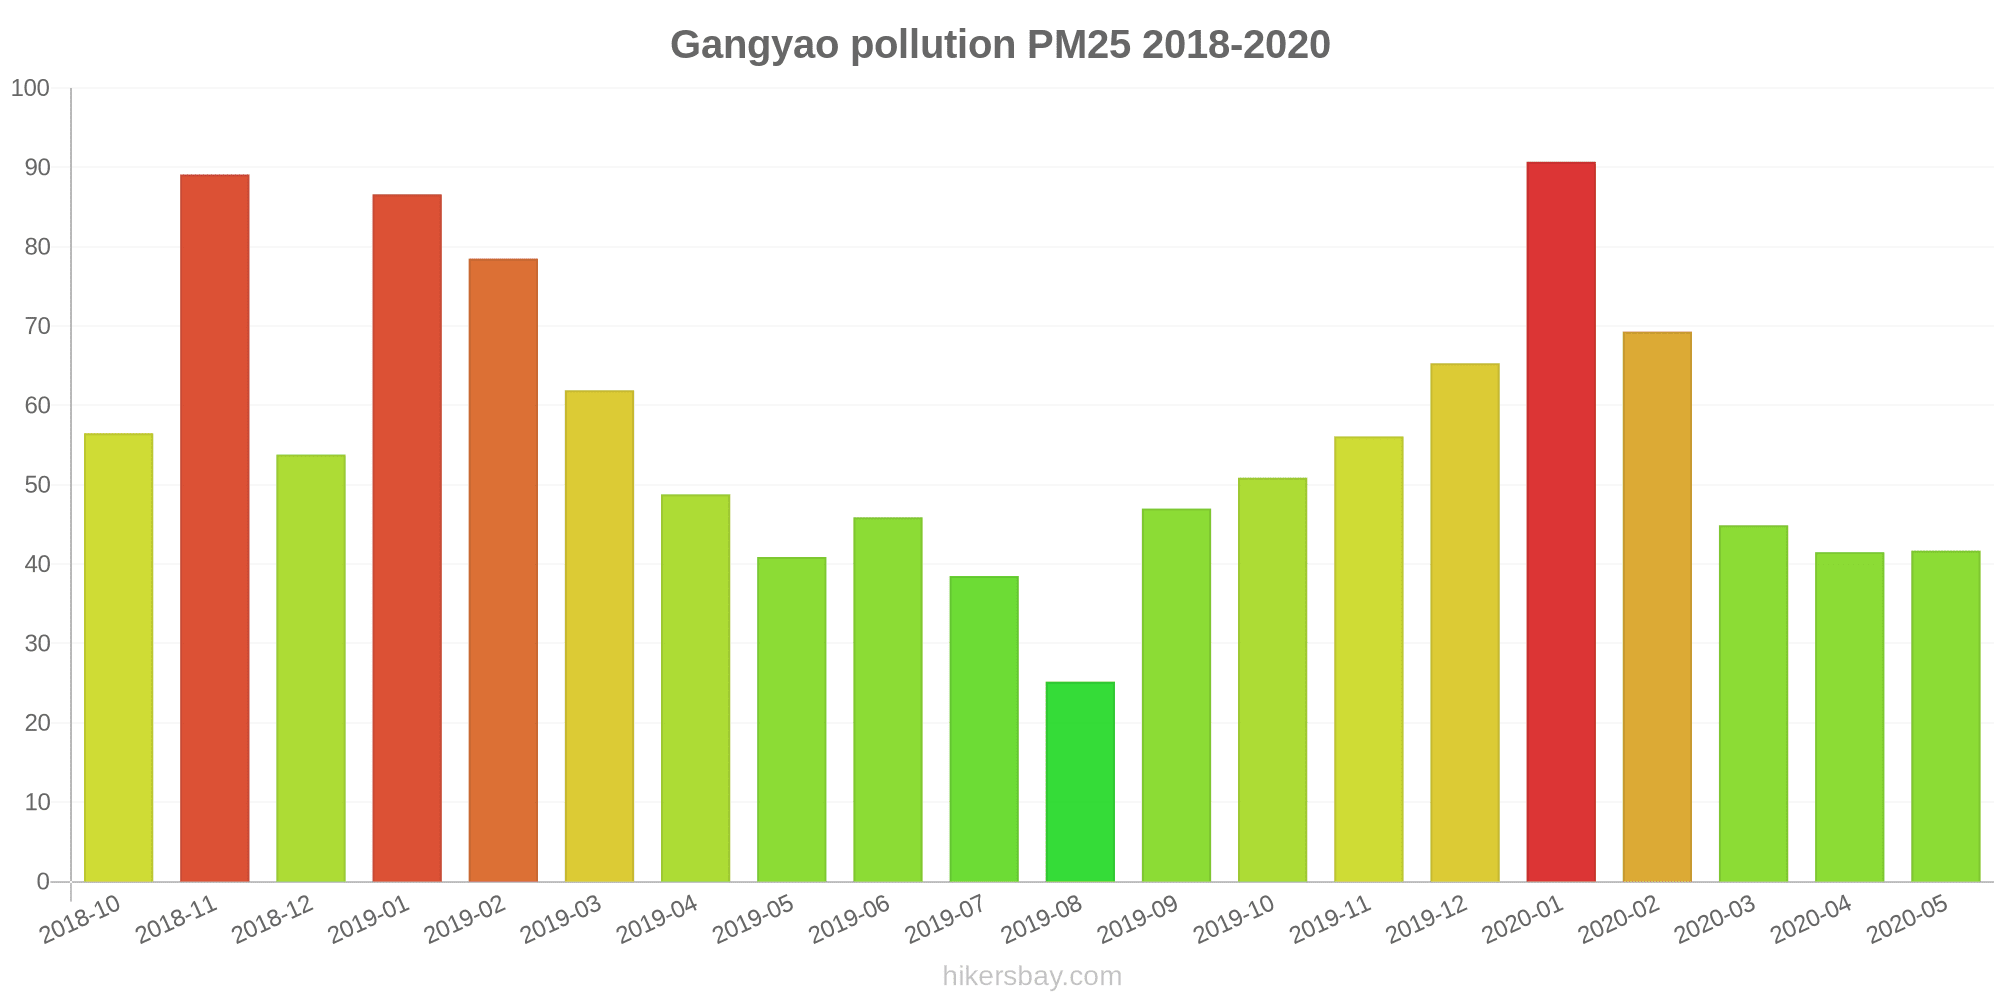
What is the current level of PM2.5 in Gangyao? (particulate matter (PM2.5) dust)
Today's PM2.5 level is:
35 (Unhealthy for Sensitive Groups)
For comparison, the highest level of PM2.5 in Gangyao in the last 7 days was: 56 (Friday, May 27, 2022) and the lowest: 56 (Friday, May 27, 2022).
The highest PM2.5 values were recorded: 91 (January 2020).
The lowest level of particulate matter PM2.5 pollution occurs in month: August (25).
How is the O3 level today in Gangyao? (ozone (O3))
0 (Good)
How high is the level of NO2? (nitrogen dioxide (NO2))
0 (Good)
What is the level of SO2 pollution? (sulfur dioxide (SO2))
0 (Good)
Current data Friday, May 27, 2022, 12:00 PM
PM10 179 (Very bad Hazardous)
PM2,5 35 (Unhealthy for Sensitive Groups)
O3 0 (Good)
NO2 0 (Good)
SO2 0 (Good)
Data on air pollution from recent days in Gangyao
index
2022-05-27
pm10
56
Unhealthy for Sensitive Groups
pm25
56
Unhealthy
o3
0
Good
no2
0
Good
so2
0
Good
data source »
Air pollution in Gangyao from October 2018 to May 2020
index
2020-05
2020-04
2020-03
2020-02
2020-01
2019-12
2019-11
2019-10
2019-09
2019-08
2019-07
2019-06
2019-05
2019-04
2019-03
2019-02
2019-01
2018-12
2018-11
2018-10
pm25
42 (Unhealthy for Sensitive Groups)
42 (Unhealthy for Sensitive Groups)
45 (Unhealthy for Sensitive Groups)
69 (Unhealthy)
91 (Very Unhealthy)
65 (Unhealthy)
56 (Unhealthy)
51 (Unhealthy for Sensitive Groups)
47 (Unhealthy for Sensitive Groups)
25 (Moderate)
39 (Unhealthy for Sensitive Groups)
46 (Unhealthy for Sensitive Groups)
41 (Unhealthy for Sensitive Groups)
49 (Unhealthy for Sensitive Groups)
62 (Unhealthy)
79 (Very Unhealthy)
87 (Very Unhealthy)
54 (Unhealthy for Sensitive Groups)
89 (Very Unhealthy)
57 (Unhealthy)
co
945 (Good)
1 (Good)
1 (Good)
1 (Good)
2 (Good)
1 (Good)
1 (Good)
1 (Good)
1 (Good)
1 (Good)
1 (Good)
1 (Good)
797 (Good)
1 (Good)
1 (Good)
1 (Good)
1 (Good)
1 (Good)
1 (Good)
1 (Good)
no2
34 (Good)
48 (Moderate)
43 (Moderate)
36 (Good)
64 (Moderate)
62 (Moderate)
63 (Moderate)
60 (Moderate)
51 (Moderate)
38 (Good)
41 (Moderate)
46 (Moderate)
44 (Moderate)
43 (Moderate)
56 (Moderate)
49 (Moderate)
65 (Moderate)
55 (Moderate)
77 (Moderate)
67 (Moderate)
o3
152 (Unhealthy)
137 (Unhealthy for Sensitive Groups)
91 (Moderate)
74 (Moderate)
62 (Good)
40 (Good)
48 (Good)
91 (Moderate)
182 (Very Unhealthy)
142 (Unhealthy for Sensitive Groups)
202 (Very Unhealthy)
210 (Very Unhealthy)
180 (Very Unhealthy)
132 (Unhealthy for Sensitive Groups)
107 (Moderate)
80 (Moderate)
50 (Good)
50 (Good)
63 (Good)
92 (Moderate)
pm10
81 (Unhealthy)
90 (Unhealthy)
84 (Unhealthy)
100 (Unhealthy)
131 (Very Unhealthy)
110 (Very Unhealthy)
117 (Very Unhealthy)
104 (Unhealthy)
94 (Unhealthy)
51 (Unhealthy for Sensitive Groups)
67 (Unhealthy for Sensitive Groups)
85 (Unhealthy)
92 (Unhealthy)
99 (Unhealthy)
112 (Very Unhealthy)
129 (Very Unhealthy)
140 (Very Unhealthy)
107 (Unhealthy)
154 (Very bad Hazardous)
106 (Unhealthy)
so2
21 (Good)
20 (Good)
18 (Good)
20 (Good)
31 (Good)
24 (Good)
27 (Good)
18 (Good)
21 (Good)
16 (Good)
22 (Good)
38 (Good)
25 (Good)
28 (Good)
27 (Good)
29 (Good)
29 (Good)
26 (Good)
37 (Good)
27 (Good)
data source »
小山
Friday, May 27, 2022, 12:00 PM
PM10 179 (Very bad Hazardous)
particulate matter (PM10) suspended dust
PM2,5 35 (Unhealthy for Sensitive Groups)
particulate matter (PM2.5) dust
O3 0.04 (Good)
ozone (O3)
NO2 0 (Good)
nitrogen dioxide (NO2)
SO2 0 (Good)
sulfur dioxide (SO2)
小山
index
2022-05-27
pm10
56
pm25
56
o3
0.03
no2
0
so2
0
小山
2018-10 2020-05

index
2020-05
2020-04
2020-03
2020-02
2020-01
2019-12
2019-11
2019-10
2019-09
2019-08
2019-07
2019-06
2019-05
2019-04
2019-03
2019-02
2019-01
2018-12
2018-11
2018-10
pm25
42
42
45
69
91
65
56
51
47
25
39
46
41
49
62
79
87
54
89
57
co
945
1
1
1
2
1
1
1
1
1
1
1
797
1
1
1
1
1
1
1
no2
34
48
43
36
64
62
63
60
51
38
41
46
44
43
56
49
65
55
77
67
o3
152
137
91
74
62
40
48
91
182
142
202
210
180
132
107
80
50
50
63
92
pm10
81
90
84
100
131
110
117
104
94
51
67
85
92
99
112
129
140
107
154
106
so2
21
20
18
20
31
24
27
18
21
16
22
38
25
28
27
29
29
26
37
27
* Pollution data source:
https://openaq.org
(ChinaAQIData)
The data is licensed under CC-By 4.0
PM10 179 (Very bad Hazardous)
PM2,5 35 (Unhealthy for Sensitive Groups)
O3 0 (Good)
NO2 0 (Good)
SO2 0 (Good)
Data on air pollution from recent days in Gangyao
| index | 2022-05-27 |
|---|---|
| pm10 | 56 Unhealthy for Sensitive Groups |
| pm25 | 56 Unhealthy |
| o3 | 0 Good |
| no2 | 0 Good |
| so2 | 0 Good |
| index | 2020-05 | 2020-04 | 2020-03 | 2020-02 | 2020-01 | 2019-12 | 2019-11 | 2019-10 | 2019-09 | 2019-08 | 2019-07 | 2019-06 | 2019-05 | 2019-04 | 2019-03 | 2019-02 | 2019-01 | 2018-12 | 2018-11 | 2018-10 |
|---|---|---|---|---|---|---|---|---|---|---|---|---|---|---|---|---|---|---|---|---|
| pm25 | 42 (Unhealthy for Sensitive Groups) | 42 (Unhealthy for Sensitive Groups) | 45 (Unhealthy for Sensitive Groups) | 69 (Unhealthy) | 91 (Very Unhealthy) | 65 (Unhealthy) | 56 (Unhealthy) | 51 (Unhealthy for Sensitive Groups) | 47 (Unhealthy for Sensitive Groups) | 25 (Moderate) | 39 (Unhealthy for Sensitive Groups) | 46 (Unhealthy for Sensitive Groups) | 41 (Unhealthy for Sensitive Groups) | 49 (Unhealthy for Sensitive Groups) | 62 (Unhealthy) | 79 (Very Unhealthy) | 87 (Very Unhealthy) | 54 (Unhealthy for Sensitive Groups) | 89 (Very Unhealthy) | 57 (Unhealthy) |
| co | 945 (Good) | 1 (Good) | 1 (Good) | 1 (Good) | 2 (Good) | 1 (Good) | 1 (Good) | 1 (Good) | 1 (Good) | 1 (Good) | 1 (Good) | 1 (Good) | 797 (Good) | 1 (Good) | 1 (Good) | 1 (Good) | 1 (Good) | 1 (Good) | 1 (Good) | 1 (Good) |
| no2 | 34 (Good) | 48 (Moderate) | 43 (Moderate) | 36 (Good) | 64 (Moderate) | 62 (Moderate) | 63 (Moderate) | 60 (Moderate) | 51 (Moderate) | 38 (Good) | 41 (Moderate) | 46 (Moderate) | 44 (Moderate) | 43 (Moderate) | 56 (Moderate) | 49 (Moderate) | 65 (Moderate) | 55 (Moderate) | 77 (Moderate) | 67 (Moderate) |
| o3 | 152 (Unhealthy) | 137 (Unhealthy for Sensitive Groups) | 91 (Moderate) | 74 (Moderate) | 62 (Good) | 40 (Good) | 48 (Good) | 91 (Moderate) | 182 (Very Unhealthy) | 142 (Unhealthy for Sensitive Groups) | 202 (Very Unhealthy) | 210 (Very Unhealthy) | 180 (Very Unhealthy) | 132 (Unhealthy for Sensitive Groups) | 107 (Moderate) | 80 (Moderate) | 50 (Good) | 50 (Good) | 63 (Good) | 92 (Moderate) |
| pm10 | 81 (Unhealthy) | 90 (Unhealthy) | 84 (Unhealthy) | 100 (Unhealthy) | 131 (Very Unhealthy) | 110 (Very Unhealthy) | 117 (Very Unhealthy) | 104 (Unhealthy) | 94 (Unhealthy) | 51 (Unhealthy for Sensitive Groups) | 67 (Unhealthy for Sensitive Groups) | 85 (Unhealthy) | 92 (Unhealthy) | 99 (Unhealthy) | 112 (Very Unhealthy) | 129 (Very Unhealthy) | 140 (Very Unhealthy) | 107 (Unhealthy) | 154 (Very bad Hazardous) | 106 (Unhealthy) |
| so2 | 21 (Good) | 20 (Good) | 18 (Good) | 20 (Good) | 31 (Good) | 24 (Good) | 27 (Good) | 18 (Good) | 21 (Good) | 16 (Good) | 22 (Good) | 38 (Good) | 25 (Good) | 28 (Good) | 27 (Good) | 29 (Good) | 29 (Good) | 26 (Good) | 37 (Good) | 27 (Good) |
PM10 179 (Very bad Hazardous)
particulate matter (PM10) suspended dustPM2,5 35 (Unhealthy for Sensitive Groups)
particulate matter (PM2.5) dustO3 0.04 (Good)
ozone (O3)NO2 0 (Good)
nitrogen dioxide (NO2)SO2 0 (Good)
sulfur dioxide (SO2)小山
| index | 2022-05-27 |
|---|---|
| pm10 | 56 |
| pm25 | 56 |
| o3 | 0.03 |
| no2 | 0 |
| so2 | 0 |
小山

| index | 2020-05 | 2020-04 | 2020-03 | 2020-02 | 2020-01 | 2019-12 | 2019-11 | 2019-10 | 2019-09 | 2019-08 | 2019-07 | 2019-06 | 2019-05 | 2019-04 | 2019-03 | 2019-02 | 2019-01 | 2018-12 | 2018-11 | 2018-10 |
|---|---|---|---|---|---|---|---|---|---|---|---|---|---|---|---|---|---|---|---|---|
| pm25 | 42 | 42 | 45 | 69 | 91 | 65 | 56 | 51 | 47 | 25 | 39 | 46 | 41 | 49 | 62 | 79 | 87 | 54 | 89 | 57 |
| co | 945 | 1 | 1 | 1 | 2 | 1 | 1 | 1 | 1 | 1 | 1 | 1 | 797 | 1 | 1 | 1 | 1 | 1 | 1 | 1 |
| no2 | 34 | 48 | 43 | 36 | 64 | 62 | 63 | 60 | 51 | 38 | 41 | 46 | 44 | 43 | 56 | 49 | 65 | 55 | 77 | 67 |
| o3 | 152 | 137 | 91 | 74 | 62 | 40 | 48 | 91 | 182 | 142 | 202 | 210 | 180 | 132 | 107 | 80 | 50 | 50 | 63 | 92 |
| pm10 | 81 | 90 | 84 | 100 | 131 | 110 | 117 | 104 | 94 | 51 | 67 | 85 | 92 | 99 | 112 | 129 | 140 | 107 | 154 | 106 |
| so2 | 21 | 20 | 18 | 20 | 31 | 24 | 27 | 18 | 21 | 16 | 22 | 38 | 25 | 28 | 27 | 29 | 29 | 26 | 37 | 27 |