Air Pollution in Gaoping: Real-time Air Quality Index and smog alert.
Pollution and air quality forecast for Gaoping. Today is Tuesday, June 16, 2026. The following air pollution values have been recorded for Gaoping:- particulate matter (PM2.5) dust - 61 (Unhealthy)
- nitrogen dioxide (NO2) - 22 (Good)
- particulate matter (PM10) suspended dust - 69 (Unhealthy for Sensitive Groups)
- carbon monoxide (CO) - 219 (Good)
- ozone (O3) - 0 (Good)
- sulfur dioxide (SO2) - 8 (Good)

What is the air quality in Gaoping today? Is the air polluted in Gaoping?. Is there smog?
What is the current level of PM2.5 in Gaoping? (particulate matter (PM2.5) dust)
Today's PM2.5 level is:
61 (Unhealthy)
For comparison, the highest level of PM2.5 in Gaoping in the last 7 days was: 28 (Friday, May 27, 2022) and the lowest: 28 (Friday, May 27, 2022).
The highest PM2.5 values were recorded: 87 (January 2019).
The lowest level of particulate matter PM2.5 pollution occurs in month: July (21).
How high is the level of NO2? (nitrogen dioxide (NO2))
22 (Good)
What is the level of PM10 today in Gaoping? (particulate matter (PM10) suspended dust)
The current level of particulate matter PM10 in Gaoping is:
69 (Unhealthy for Sensitive Groups)
The highest PM10 values usually occur in month: 118 (January 2019).
The lowest value of particulate matter PM10 pollution in Gaoping is usually recorded in: October (45).
How high is the CO level? (carbon monoxide (CO))
219 (Good)
How is the O3 level today in Gaoping? (ozone (O3))
0 (Good)
What is the level of SO2 pollution? (sulfur dioxide (SO2))
8 (Good)
Current data Friday, May 27, 2022, 3:00 PM
PM2,5 61 (Unhealthy)
NO2 22 (Good)
PM10 69 (Unhealthy for Sensitive Groups)
CO 219 (Good)
O3 0 (Good)
SO2 8 (Good)
Data on air pollution from recent days in Gaoping
index
2022-05-27
pm25
28
Moderate
no2
22
Good
pm10
35
Moderate
co
579
Good
o3
22
Good
so2
5
Good
data source »
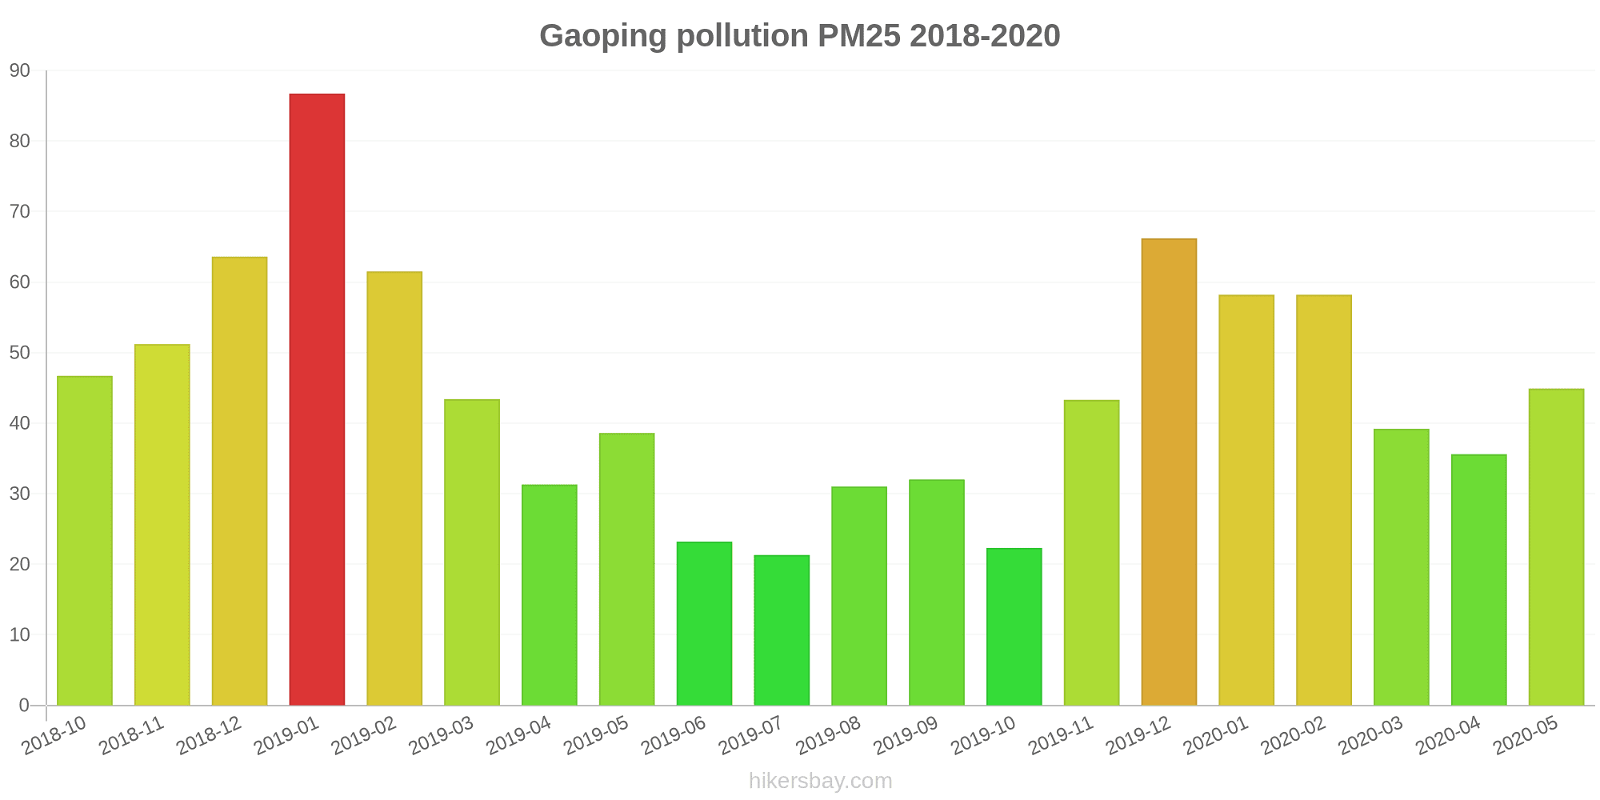
Air pollution in Gaoping from October 2018 to May 2020
index
2020-05
2020-04
2020-03
2020-02
2020-01
2019-12
2019-11
2019-10
2019-09
2019-08
2019-07
2019-06
2019-05
2019-04
2019-03
2019-02
2019-01
2018-12
2018-11
2018-10
pm25
45 (Unhealthy for Sensitive Groups)
36 (Unhealthy for Sensitive Groups)
39 (Unhealthy for Sensitive Groups)
58 (Unhealthy)
58 (Unhealthy)
66 (Unhealthy)
43 (Unhealthy for Sensitive Groups)
22 (Moderate)
32 (Moderate)
31 (Moderate)
21 (Moderate)
23 (Moderate)
39 (Unhealthy for Sensitive Groups)
31 (Moderate)
43 (Unhealthy for Sensitive Groups)
62 (Unhealthy)
87 (Very Unhealthy)
64 (Unhealthy)
51 (Unhealthy for Sensitive Groups)
47 (Unhealthy for Sensitive Groups)
co
635 (Good)
565 (Good)
557 (Good)
714 (Good)
941 (Good)
848 (Good)
658 (Good)
554 (Good)
588 (Good)
536 (Good)
550 (Good)
567 (Good)
551 (Good)
636 (Good)
664 (Good)
902 (Good)
1 (Good)
754 (Good)
655 (Good)
692 (Good)
no2
35 (Good)
30 (Good)
26 (Good)
20 (Good)
30 (Good)
33 (Good)
34 (Good)
24 (Good)
22 (Good)
21 (Good)
20 (Good)
25 (Good)
26 (Good)
34 (Good)
36 (Good)
29 (Good)
42 (Moderate)
27 (Good)
30 (Good)
24 (Good)
o3
137 (Unhealthy for Sensitive Groups)
113 (Moderate)
99 (Moderate)
79 (Moderate)
64 (Good)
49 (Good)
45 (Good)
72 (Moderate)
94 (Moderate)
127 (Unhealthy for Sensitive Groups)
97 (Moderate)
101 (Moderate)
107 (Moderate)
107 (Moderate)
86 (Moderate)
71 (Moderate)
53 (Good)
43 (Good)
62 (Good)
76 (Moderate)
pm10
82 (Unhealthy)
63 (Unhealthy for Sensitive Groups)
70 (Unhealthy for Sensitive Groups)
80 (Unhealthy)
83 (Unhealthy)
103 (Unhealthy)
84 (Unhealthy)
45 (Moderate)
61 (Unhealthy for Sensitive Groups)
68 (Unhealthy for Sensitive Groups)
51 (Unhealthy for Sensitive Groups)
52 (Unhealthy for Sensitive Groups)
74 (Unhealthy for Sensitive Groups)
65 (Unhealthy for Sensitive Groups)
74 (Unhealthy for Sensitive Groups)
90 (Unhealthy)
118 (Very Unhealthy)
96 (Unhealthy)
77 (Unhealthy for Sensitive Groups)
75 (Unhealthy for Sensitive Groups)
so2
4.7 (Good)
4.9 (Good)
4.5 (Good)
4.8 (Good)
8.4 (Good)
8.7 (Good)
4.3 (Good)
4.8 (Good)
2.2 (Good)
4.2 (Good)
6.5 (Good)
9.5 (Good)
6 (Good)
4.7 (Good)
6.7 (Good)
5.4 (Good)
3.9 (Good)
6.8 (Good)
6.9 (Good)
6.3 (Good)
data source »
高坪区监测站
Friday, May 27, 2022, 3:00 PM
PM2,5 61 (Unhealthy)
particulate matter (PM2.5) dust
NO2 22 (Good)
nitrogen dioxide (NO2)
PM10 69 (Unhealthy for Sensitive Groups)
particulate matter (PM10) suspended dust
CO 219 (Good)
carbon monoxide (CO)
O3 0.05 (Good)
ozone (O3)
SO2 7.7 (Good)
sulfur dioxide (SO2)
高坪区监测站
index
2022-05-27
pm25
28
no2
22
pm10
35
co
579
o3
22
so2
4.6
高坪区监测站
2018-10 2020-05

index
2020-05
2020-04
2020-03
2020-02
2020-01
2019-12
2019-11
2019-10
2019-09
2019-08
2019-07
2019-06
2019-05
2019-04
2019-03
2019-02
2019-01
2018-12
2018-11
2018-10
pm25
45
36
39
58
58
66
43
22
32
31
21
23
39
31
43
62
87
64
51
47
co
635
565
557
714
941
848
658
554
588
536
550
567
551
636
664
902
1
754
655
692
no2
35
30
26
20
30
33
34
24
22
21
20
25
26
34
36
29
42
27
30
24
o3
137
113
99
79
64
49
45
72
94
127
97
101
107
107
86
71
53
43
62
76
pm10
82
63
70
80
83
103
84
45
61
68
51
52
74
65
74
90
118
96
77
75
so2
4.7
4.9
4.5
4.8
8.4
8.7
4.3
4.8
2.2
4.2
6.5
9.5
6
4.7
6.7
5.4
3.9
6.8
6.9
6.3
* Pollution data source:
https://openaq.org
(ChinaAQIData)
The data is licensed under CC-By 4.0
PM2,5 61 (Unhealthy)
NO2 22 (Good)
PM10 69 (Unhealthy for Sensitive Groups)
CO 219 (Good)
O3 0 (Good)
SO2 8 (Good)
Data on air pollution from recent days in Gaoping
| index | 2022-05-27 |
|---|---|
| pm25 | 28 Moderate |
| no2 | 22 Good |
| pm10 | 35 Moderate |
| co | 579 Good |
| o3 | 22 Good |
| so2 | 5 Good |

| index | 2020-05 | 2020-04 | 2020-03 | 2020-02 | 2020-01 | 2019-12 | 2019-11 | 2019-10 | 2019-09 | 2019-08 | 2019-07 | 2019-06 | 2019-05 | 2019-04 | 2019-03 | 2019-02 | 2019-01 | 2018-12 | 2018-11 | 2018-10 |
|---|---|---|---|---|---|---|---|---|---|---|---|---|---|---|---|---|---|---|---|---|
| pm25 | 45 (Unhealthy for Sensitive Groups) | 36 (Unhealthy for Sensitive Groups) | 39 (Unhealthy for Sensitive Groups) | 58 (Unhealthy) | 58 (Unhealthy) | 66 (Unhealthy) | 43 (Unhealthy for Sensitive Groups) | 22 (Moderate) | 32 (Moderate) | 31 (Moderate) | 21 (Moderate) | 23 (Moderate) | 39 (Unhealthy for Sensitive Groups) | 31 (Moderate) | 43 (Unhealthy for Sensitive Groups) | 62 (Unhealthy) | 87 (Very Unhealthy) | 64 (Unhealthy) | 51 (Unhealthy for Sensitive Groups) | 47 (Unhealthy for Sensitive Groups) |
| co | 635 (Good) | 565 (Good) | 557 (Good) | 714 (Good) | 941 (Good) | 848 (Good) | 658 (Good) | 554 (Good) | 588 (Good) | 536 (Good) | 550 (Good) | 567 (Good) | 551 (Good) | 636 (Good) | 664 (Good) | 902 (Good) | 1 (Good) | 754 (Good) | 655 (Good) | 692 (Good) |
| no2 | 35 (Good) | 30 (Good) | 26 (Good) | 20 (Good) | 30 (Good) | 33 (Good) | 34 (Good) | 24 (Good) | 22 (Good) | 21 (Good) | 20 (Good) | 25 (Good) | 26 (Good) | 34 (Good) | 36 (Good) | 29 (Good) | 42 (Moderate) | 27 (Good) | 30 (Good) | 24 (Good) |
| o3 | 137 (Unhealthy for Sensitive Groups) | 113 (Moderate) | 99 (Moderate) | 79 (Moderate) | 64 (Good) | 49 (Good) | 45 (Good) | 72 (Moderate) | 94 (Moderate) | 127 (Unhealthy for Sensitive Groups) | 97 (Moderate) | 101 (Moderate) | 107 (Moderate) | 107 (Moderate) | 86 (Moderate) | 71 (Moderate) | 53 (Good) | 43 (Good) | 62 (Good) | 76 (Moderate) |
| pm10 | 82 (Unhealthy) | 63 (Unhealthy for Sensitive Groups) | 70 (Unhealthy for Sensitive Groups) | 80 (Unhealthy) | 83 (Unhealthy) | 103 (Unhealthy) | 84 (Unhealthy) | 45 (Moderate) | 61 (Unhealthy for Sensitive Groups) | 68 (Unhealthy for Sensitive Groups) | 51 (Unhealthy for Sensitive Groups) | 52 (Unhealthy for Sensitive Groups) | 74 (Unhealthy for Sensitive Groups) | 65 (Unhealthy for Sensitive Groups) | 74 (Unhealthy for Sensitive Groups) | 90 (Unhealthy) | 118 (Very Unhealthy) | 96 (Unhealthy) | 77 (Unhealthy for Sensitive Groups) | 75 (Unhealthy for Sensitive Groups) |
| so2 | 4.7 (Good) | 4.9 (Good) | 4.5 (Good) | 4.8 (Good) | 8.4 (Good) | 8.7 (Good) | 4.3 (Good) | 4.8 (Good) | 2.2 (Good) | 4.2 (Good) | 6.5 (Good) | 9.5 (Good) | 6 (Good) | 4.7 (Good) | 6.7 (Good) | 5.4 (Good) | 3.9 (Good) | 6.8 (Good) | 6.9 (Good) | 6.3 (Good) |
PM2,5 61 (Unhealthy)
particulate matter (PM2.5) dustNO2 22 (Good)
nitrogen dioxide (NO2)PM10 69 (Unhealthy for Sensitive Groups)
particulate matter (PM10) suspended dustCO 219 (Good)
carbon monoxide (CO)O3 0.05 (Good)
ozone (O3)SO2 7.7 (Good)
sulfur dioxide (SO2)高坪区监测站
| index | 2022-05-27 |
|---|---|
| pm25 | 28 |
| no2 | 22 |
| pm10 | 35 |
| co | 579 |
| o3 | 22 |
| so2 | 4.6 |
高坪区监测站

| index | 2020-05 | 2020-04 | 2020-03 | 2020-02 | 2020-01 | 2019-12 | 2019-11 | 2019-10 | 2019-09 | 2019-08 | 2019-07 | 2019-06 | 2019-05 | 2019-04 | 2019-03 | 2019-02 | 2019-01 | 2018-12 | 2018-11 | 2018-10 |
|---|---|---|---|---|---|---|---|---|---|---|---|---|---|---|---|---|---|---|---|---|
| pm25 | 45 | 36 | 39 | 58 | 58 | 66 | 43 | 22 | 32 | 31 | 21 | 23 | 39 | 31 | 43 | 62 | 87 | 64 | 51 | 47 |
| co | 635 | 565 | 557 | 714 | 941 | 848 | 658 | 554 | 588 | 536 | 550 | 567 | 551 | 636 | 664 | 902 | 1 | 754 | 655 | 692 |
| no2 | 35 | 30 | 26 | 20 | 30 | 33 | 34 | 24 | 22 | 21 | 20 | 25 | 26 | 34 | 36 | 29 | 42 | 27 | 30 | 24 |
| o3 | 137 | 113 | 99 | 79 | 64 | 49 | 45 | 72 | 94 | 127 | 97 | 101 | 107 | 107 | 86 | 71 | 53 | 43 | 62 | 76 |
| pm10 | 82 | 63 | 70 | 80 | 83 | 103 | 84 | 45 | 61 | 68 | 51 | 52 | 74 | 65 | 74 | 90 | 118 | 96 | 77 | 75 |
| so2 | 4.7 | 4.9 | 4.5 | 4.8 | 8.4 | 8.7 | 4.3 | 4.8 | 2.2 | 4.2 | 6.5 | 9.5 | 6 | 4.7 | 6.7 | 5.4 | 3.9 | 6.8 | 6.9 | 6.3 |