Air Pollution in Gongjing: Real-time Air Quality Index and smog alert.
Pollution and air quality forecast for Gongjing. Today is Tuesday, June 16, 2026. The following air pollution values have been recorded for Gongjing:- particulate matter (PM2.5) dust - 61 (Unhealthy)
- nitrogen dioxide (NO2) - 22 (Good)
- particulate matter (PM10) suspended dust - 69 (Unhealthy for Sensitive Groups)
- carbon monoxide (CO) - 219 (Good)
- ozone (O3) - 0 (Good)
- sulfur dioxide (SO2) - 8 (Good)

What is the air quality in Gongjing today? Is the air polluted in Gongjing?. Is there smog?
What is the current level of PM2.5 in Gongjing? (particulate matter (PM2.5) dust)
Today's PM2.5 level is:
61 (Unhealthy)
For comparison, the highest level of PM2.5 in Gongjing in the last 7 days was: 28 (Friday, May 27, 2022) and the lowest: 28 (Friday, May 27, 2022).
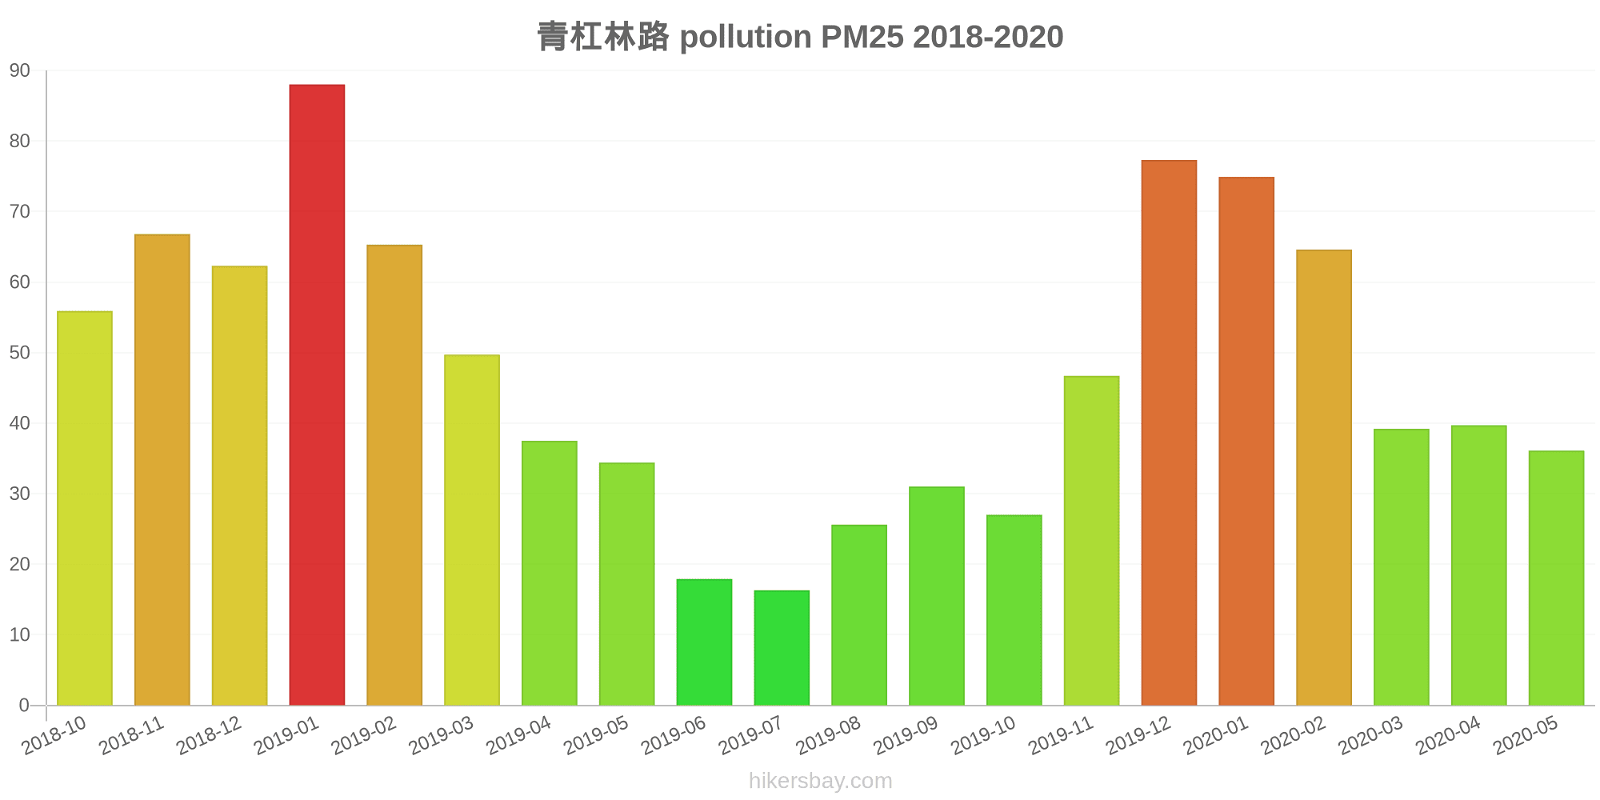
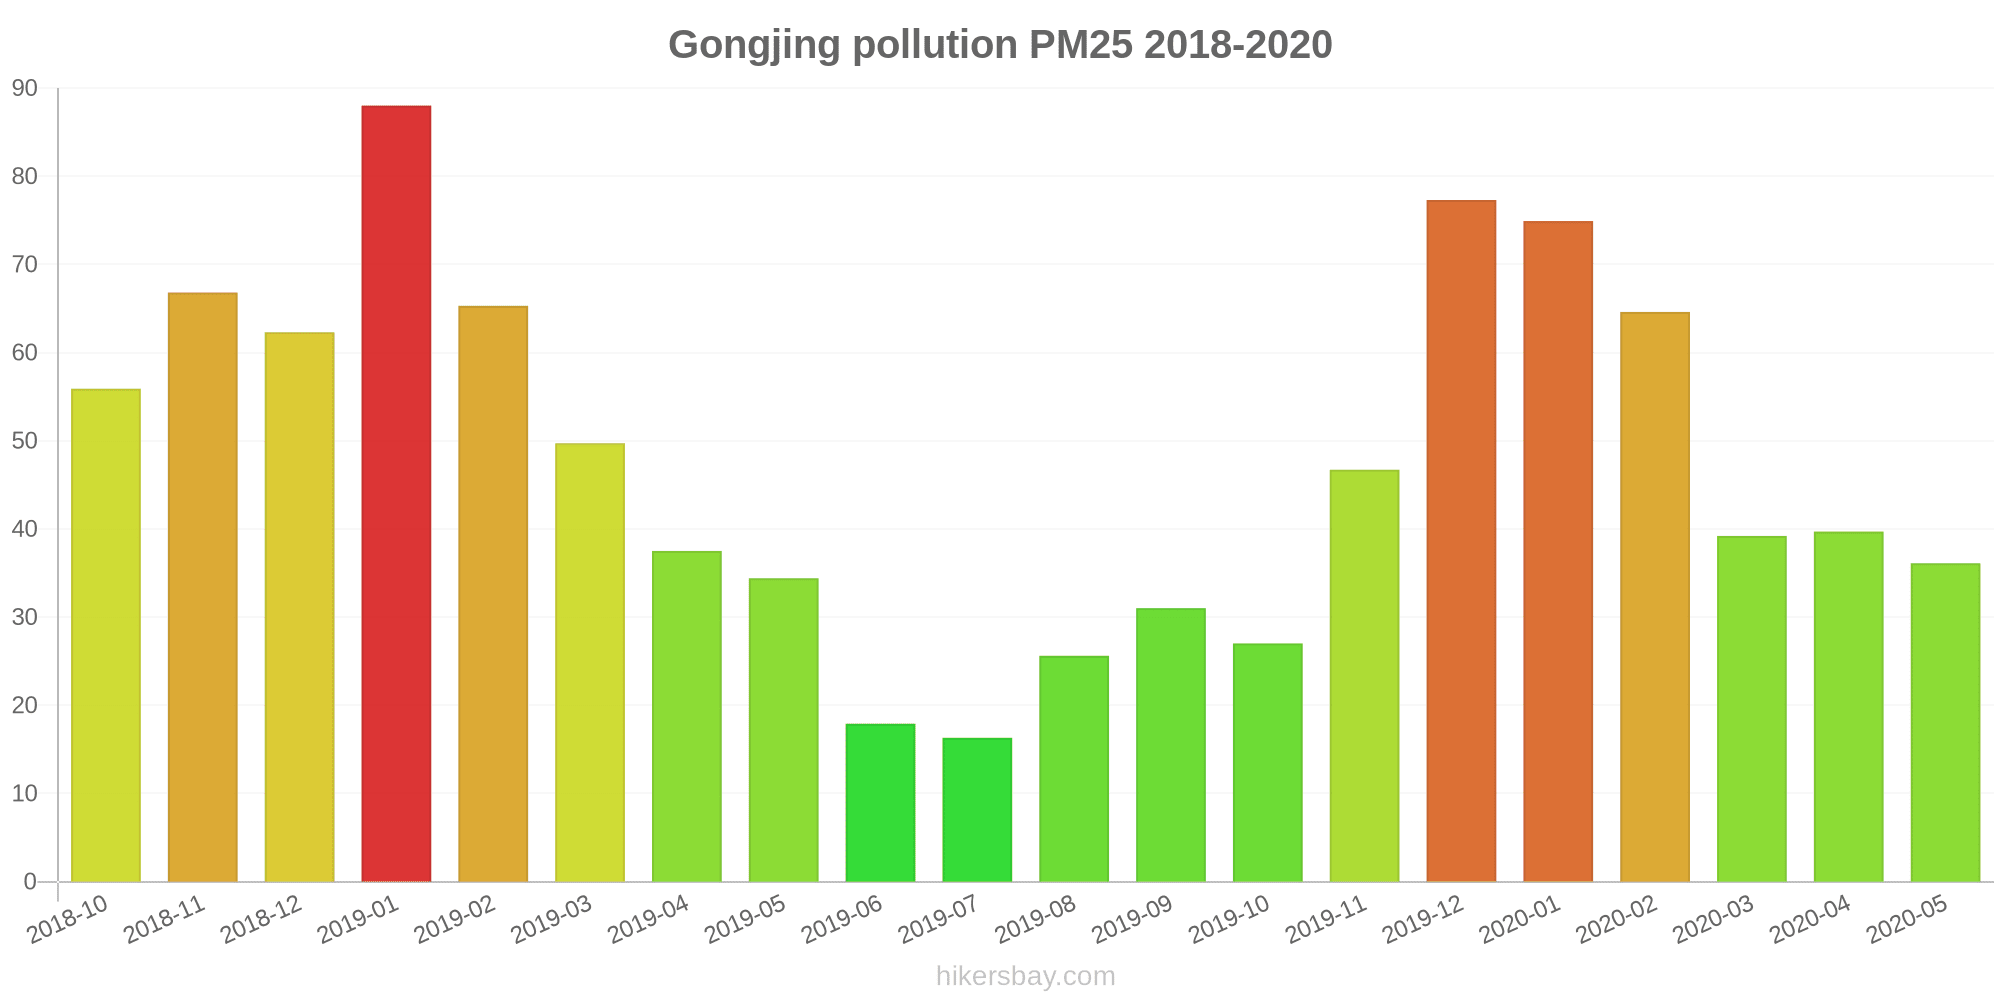
The highest PM2.5 values were recorded: 88 (January 2019).
The lowest level of particulate matter PM2.5 pollution occurs in month: July (16).
How high is the level of NO2? (nitrogen dioxide (NO2))
22 (Good)
What is the level of PM10 today in Gongjing? (particulate matter (PM10) suspended dust)
The current level of particulate matter PM10 in Gongjing is:
69 (Unhealthy for Sensitive Groups)
The highest PM10 values usually occur in month: 120 (January 2019).
The lowest value of particulate matter PM10 pollution in Gongjing is usually recorded in: July (36).
How high is the CO level? (carbon monoxide (CO))
219 (Good)
How is the O3 level today in Gongjing? (ozone (O3))
0 (Good)
What is the level of SO2 pollution? (sulfur dioxide (SO2))
8 (Good)
Current data Friday, May 27, 2022, 3:00 PM
PM2,5 61 (Unhealthy)
NO2 22 (Good)
PM10 69 (Unhealthy for Sensitive Groups)
CO 219 (Good)
O3 0 (Good)
SO2 8 (Good)
Data on air pollution from recent days in Gongjing
index
2022-05-27
pm25
28
Moderate
no2
22
Good
pm10
35
Moderate
co
579
Good
o3
22
Good
so2
5
Good
data source »
Air pollution in Gongjing from October 2018 to May 2020

index
2020-05
2020-04
2020-03
2020-02
2020-01
2019-12
2019-11
2019-10
2019-09
2019-08
2019-07
2019-06
2019-05
2019-04
2019-03
2019-02
2019-01
2018-12
2018-11
2018-10
pm25
36 (Unhealthy for Sensitive Groups)
40 (Unhealthy for Sensitive Groups)
39 (Unhealthy for Sensitive Groups)
65 (Unhealthy)
75 (Unhealthy)
77 (Very Unhealthy)
47 (Unhealthy for Sensitive Groups)
27 (Moderate)
31 (Moderate)
26 (Moderate)
16 (Moderate)
18 (Moderate)
34 (Moderate)
38 (Unhealthy for Sensitive Groups)
50 (Unhealthy for Sensitive Groups)
65 (Unhealthy)
88 (Very Unhealthy)
62 (Unhealthy)
67 (Unhealthy)
56 (Unhealthy)
co
467 (Good)
552 (Good)
573 (Good)
658 (Good)
901 (Good)
944 (Good)
609 (Good)
682 (Good)
617 (Good)
489 (Good)
638 (Good)
508 (Good)
550 (Good)
703 (Good)
651 (Good)
784 (Good)
983 (Good)
808 (Good)
704 (Good)
695 (Good)
no2
26 (Good)
22 (Good)
22 (Good)
15 (Good)
28 (Good)
32 (Good)
26 (Good)
23 (Good)
28 (Good)
29 (Good)
27 (Good)
28 (Good)
29 (Good)
28 (Good)
19 (Good)
17 (Good)
29 (Good)
25 (Good)
26 (Good)
24 (Good)
o3
186 (Very Unhealthy)
134 (Unhealthy for Sensitive Groups)
125 (Unhealthy for Sensitive Groups)
85 (Moderate)
64 (Good)
58 (Good)
59 (Good)
84 (Moderate)
117 (Moderate)
167 (Unhealthy)
126 (Unhealthy for Sensitive Groups)
138 (Unhealthy for Sensitive Groups)
118 (Moderate)
145 (Unhealthy for Sensitive Groups)
99 (Moderate)
72 (Moderate)
85 (Moderate)
50 (Good)
67 (Good)
56 (Good)
pm10
68 (Unhealthy for Sensitive Groups)
62 (Unhealthy for Sensitive Groups)
67 (Unhealthy for Sensitive Groups)
84 (Unhealthy)
95 (Unhealthy)
104 (Unhealthy)
75 (Unhealthy for Sensitive Groups)
48 (Moderate)
53 (Unhealthy for Sensitive Groups)
51 (Unhealthy for Sensitive Groups)
36 (Moderate)
44 (Moderate)
59 (Unhealthy for Sensitive Groups)
65 (Unhealthy for Sensitive Groups)
77 (Unhealthy for Sensitive Groups)
90 (Unhealthy)
120 (Very Unhealthy)
97 (Unhealthy)
96 (Unhealthy)
95 (Unhealthy)
so2
6.1 (Good)
6.8 (Good)
6.5 (Good)
5.5 (Good)
5.9 (Good)
6.9 (Good)
8.3 (Good)
6.7 (Good)
7.8 (Good)
9.2 (Good)
7.5 (Good)
9.1 (Good)
6.2 (Good)
7.6 (Good)
7.9 (Good)
6.3 (Good)
6.6 (Good)
8.2 (Good)
9.5 (Good)
6.4 (Good)
data source »
青杠林路
Friday, May 27, 2022, 3:00 PM
PM2,5 61 (Unhealthy)
particulate matter (PM2.5) dust
NO2 22 (Good)
nitrogen dioxide (NO2)
PM10 69 (Unhealthy for Sensitive Groups)
particulate matter (PM10) suspended dust
CO 219 (Good)
carbon monoxide (CO)
O3 0.05 (Good)
ozone (O3)
SO2 7.7 (Good)
sulfur dioxide (SO2)
青杠林路
index
2022-05-27
pm25
28
no2
22
pm10
35
co
579
o3
22
so2
4.6
青杠林路
2018-10 2020-05
index
2020-05
2020-04
2020-03
2020-02
2020-01
2019-12
2019-11
2019-10
2019-09
2019-08
2019-07
2019-06
2019-05
2019-04
2019-03
2019-02
2019-01
2018-12
2018-11
2018-10
pm25
36
40
39
65
75
77
47
27
31
26
16
18
34
38
50
65
88
62
67
56
co
467
552
573
658
901
944
609
682
617
489
638
508
550
703
651
784
983
808
704
695
no2
26
22
22
15
28
32
26
23
28
29
27
28
29
28
19
17
29
25
26
24
o3
186
134
125
85
64
58
59
84
117
167
126
138
118
145
99
72
85
50
67
56
pm10
68
62
67
84
95
104
75
48
53
51
36
44
59
65
77
90
120
97
96
95
so2
6.1
6.8
6.5
5.5
5.9
6.9
8.3
6.7
7.8
9.2
7.5
9.1
6.2
7.6
7.9
6.3
6.6
8.2
9.5
6.4
* Pollution data source:
https://openaq.org
(ChinaAQIData)
The data is licensed under CC-By 4.0
PM2,5 61 (Unhealthy)
NO2 22 (Good)
PM10 69 (Unhealthy for Sensitive Groups)
CO 219 (Good)
O3 0 (Good)
SO2 8 (Good)
Data on air pollution from recent days in Gongjing
| index | 2022-05-27 |
|---|---|
| pm25 | 28 Moderate |
| no2 | 22 Good |
| pm10 | 35 Moderate |
| co | 579 Good |
| o3 | 22 Good |
| so2 | 5 Good |
| index | 2020-05 | 2020-04 | 2020-03 | 2020-02 | 2020-01 | 2019-12 | 2019-11 | 2019-10 | 2019-09 | 2019-08 | 2019-07 | 2019-06 | 2019-05 | 2019-04 | 2019-03 | 2019-02 | 2019-01 | 2018-12 | 2018-11 | 2018-10 |
|---|---|---|---|---|---|---|---|---|---|---|---|---|---|---|---|---|---|---|---|---|
| pm25 | 36 (Unhealthy for Sensitive Groups) | 40 (Unhealthy for Sensitive Groups) | 39 (Unhealthy for Sensitive Groups) | 65 (Unhealthy) | 75 (Unhealthy) | 77 (Very Unhealthy) | 47 (Unhealthy for Sensitive Groups) | 27 (Moderate) | 31 (Moderate) | 26 (Moderate) | 16 (Moderate) | 18 (Moderate) | 34 (Moderate) | 38 (Unhealthy for Sensitive Groups) | 50 (Unhealthy for Sensitive Groups) | 65 (Unhealthy) | 88 (Very Unhealthy) | 62 (Unhealthy) | 67 (Unhealthy) | 56 (Unhealthy) |
| co | 467 (Good) | 552 (Good) | 573 (Good) | 658 (Good) | 901 (Good) | 944 (Good) | 609 (Good) | 682 (Good) | 617 (Good) | 489 (Good) | 638 (Good) | 508 (Good) | 550 (Good) | 703 (Good) | 651 (Good) | 784 (Good) | 983 (Good) | 808 (Good) | 704 (Good) | 695 (Good) |
| no2 | 26 (Good) | 22 (Good) | 22 (Good) | 15 (Good) | 28 (Good) | 32 (Good) | 26 (Good) | 23 (Good) | 28 (Good) | 29 (Good) | 27 (Good) | 28 (Good) | 29 (Good) | 28 (Good) | 19 (Good) | 17 (Good) | 29 (Good) | 25 (Good) | 26 (Good) | 24 (Good) |
| o3 | 186 (Very Unhealthy) | 134 (Unhealthy for Sensitive Groups) | 125 (Unhealthy for Sensitive Groups) | 85 (Moderate) | 64 (Good) | 58 (Good) | 59 (Good) | 84 (Moderate) | 117 (Moderate) | 167 (Unhealthy) | 126 (Unhealthy for Sensitive Groups) | 138 (Unhealthy for Sensitive Groups) | 118 (Moderate) | 145 (Unhealthy for Sensitive Groups) | 99 (Moderate) | 72 (Moderate) | 85 (Moderate) | 50 (Good) | 67 (Good) | 56 (Good) |
| pm10 | 68 (Unhealthy for Sensitive Groups) | 62 (Unhealthy for Sensitive Groups) | 67 (Unhealthy for Sensitive Groups) | 84 (Unhealthy) | 95 (Unhealthy) | 104 (Unhealthy) | 75 (Unhealthy for Sensitive Groups) | 48 (Moderate) | 53 (Unhealthy for Sensitive Groups) | 51 (Unhealthy for Sensitive Groups) | 36 (Moderate) | 44 (Moderate) | 59 (Unhealthy for Sensitive Groups) | 65 (Unhealthy for Sensitive Groups) | 77 (Unhealthy for Sensitive Groups) | 90 (Unhealthy) | 120 (Very Unhealthy) | 97 (Unhealthy) | 96 (Unhealthy) | 95 (Unhealthy) |
| so2 | 6.1 (Good) | 6.8 (Good) | 6.5 (Good) | 5.5 (Good) | 5.9 (Good) | 6.9 (Good) | 8.3 (Good) | 6.7 (Good) | 7.8 (Good) | 9.2 (Good) | 7.5 (Good) | 9.1 (Good) | 6.2 (Good) | 7.6 (Good) | 7.9 (Good) | 6.3 (Good) | 6.6 (Good) | 8.2 (Good) | 9.5 (Good) | 6.4 (Good) |
PM2,5 61 (Unhealthy)
particulate matter (PM2.5) dustNO2 22 (Good)
nitrogen dioxide (NO2)PM10 69 (Unhealthy for Sensitive Groups)
particulate matter (PM10) suspended dustCO 219 (Good)
carbon monoxide (CO)O3 0.05 (Good)
ozone (O3)SO2 7.7 (Good)
sulfur dioxide (SO2)青杠林路
| index | 2022-05-27 |
|---|---|
| pm25 | 28 |
| no2 | 22 |
| pm10 | 35 |
| co | 579 |
| o3 | 22 |
| so2 | 4.6 |
青杠林路

| index | 2020-05 | 2020-04 | 2020-03 | 2020-02 | 2020-01 | 2019-12 | 2019-11 | 2019-10 | 2019-09 | 2019-08 | 2019-07 | 2019-06 | 2019-05 | 2019-04 | 2019-03 | 2019-02 | 2019-01 | 2018-12 | 2018-11 | 2018-10 |
|---|---|---|---|---|---|---|---|---|---|---|---|---|---|---|---|---|---|---|---|---|
| pm25 | 36 | 40 | 39 | 65 | 75 | 77 | 47 | 27 | 31 | 26 | 16 | 18 | 34 | 38 | 50 | 65 | 88 | 62 | 67 | 56 |
| co | 467 | 552 | 573 | 658 | 901 | 944 | 609 | 682 | 617 | 489 | 638 | 508 | 550 | 703 | 651 | 784 | 983 | 808 | 704 | 695 |
| no2 | 26 | 22 | 22 | 15 | 28 | 32 | 26 | 23 | 28 | 29 | 27 | 28 | 29 | 28 | 19 | 17 | 29 | 25 | 26 | 24 |
| o3 | 186 | 134 | 125 | 85 | 64 | 58 | 59 | 84 | 117 | 167 | 126 | 138 | 118 | 145 | 99 | 72 | 85 | 50 | 67 | 56 |
| pm10 | 68 | 62 | 67 | 84 | 95 | 104 | 75 | 48 | 53 | 51 | 36 | 44 | 59 | 65 | 77 | 90 | 120 | 97 | 96 | 95 |
| so2 | 6.1 | 6.8 | 6.5 | 5.5 | 5.9 | 6.9 | 8.3 | 6.7 | 7.8 | 9.2 | 7.5 | 9.1 | 6.2 | 7.6 | 7.9 | 6.3 | 6.6 | 8.2 | 9.5 | 6.4 |