Air Pollution in Helanshan: Real-time Air Quality Index and smog alert.
Pollution and air quality forecast for Helanshan. Today is Tuesday, June 16, 2026. The following air pollution values have been recorded for Helanshan:- particulate matter (PM10) suspended dust - 179 (Very bad Hazardous)
- particulate matter (PM2.5) dust - 35 (Unhealthy for Sensitive Groups)
- ozone (O3) - 0 (Good)
- nitrogen dioxide (NO2) - 0 (Good)
- sulfur dioxide (SO2) - 0 (Good)

What is the air quality in Helanshan today? Is the air polluted in Helanshan?. Is there smog?
What is the level of PM10 today in Helanshan? (particulate matter (PM10) suspended dust)
The current level of particulate matter PM10 in Helanshan is:
179 (Very bad Hazardous)
The highest PM10 values usually occur in month: 150 (November 2018).
The lowest value of particulate matter PM10 pollution in Helanshan is usually recorded in: August (51).
What is the current level of PM2.5 in Helanshan? (particulate matter (PM2.5) dust)
Today's PM2.5 level is:
35 (Unhealthy for Sensitive Groups)
For comparison, the highest level of PM2.5 in Helanshan in the last 7 days was: 56 (Friday, May 27, 2022) and the lowest: 56 (Friday, May 27, 2022).
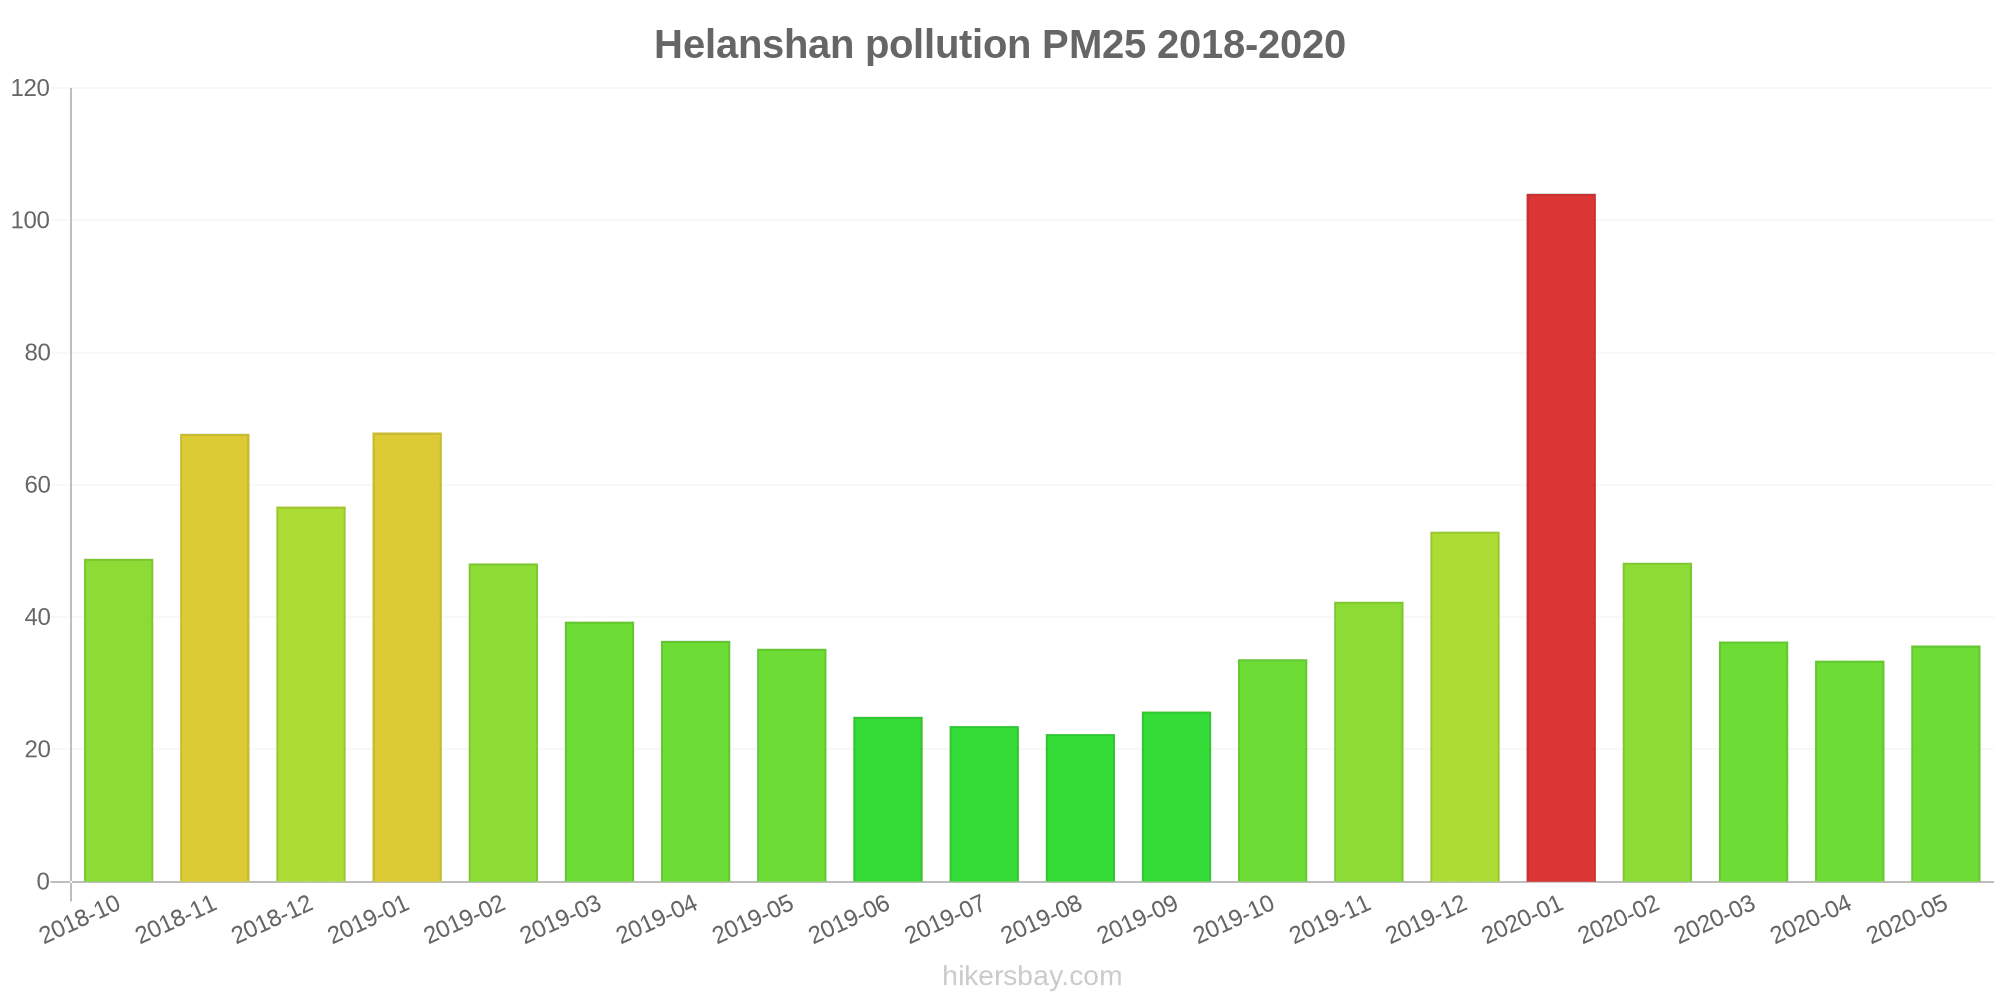
The highest PM2.5 values were recorded: 104 (January 2020).
The lowest level of particulate matter PM2.5 pollution occurs in month: August (22).
How is the O3 level today in Helanshan? (ozone (O3))
0 (Good)
How high is the level of NO2? (nitrogen dioxide (NO2))
0 (Good)
What is the level of SO2 pollution? (sulfur dioxide (SO2))
0 (Good)
Current data Friday, May 27, 2022, 12:00 PM
PM10 179 (Very bad Hazardous)
PM2,5 35 (Unhealthy for Sensitive Groups)
O3 0 (Good)
NO2 0 (Good)
SO2 0 (Good)
Data on air pollution from recent days in Helanshan
index
2022-05-27
pm10
56
Unhealthy for Sensitive Groups
pm25
56
Unhealthy
o3
0
Good
no2
0
Good
so2
0
Good
data source »
Air pollution in Helanshan from October 2018 to May 2020

index
2020-05
2020-04
2020-03
2020-02
2020-01
2019-12
2019-11
2019-10
2019-09
2019-08
2019-07
2019-06
2019-05
2019-04
2019-03
2019-02
2019-01
2018-12
2018-11
2018-10
pm25
36 (Unhealthy for Sensitive Groups)
33 (Moderate)
36 (Unhealthy for Sensitive Groups)
48 (Unhealthy for Sensitive Groups)
104 (Very Unhealthy)
53 (Unhealthy for Sensitive Groups)
42 (Unhealthy for Sensitive Groups)
34 (Moderate)
26 (Moderate)
22 (Moderate)
24 (Moderate)
25 (Moderate)
35 (Unhealthy for Sensitive Groups)
36 (Unhealthy for Sensitive Groups)
39 (Unhealthy for Sensitive Groups)
48 (Unhealthy for Sensitive Groups)
68 (Unhealthy)
57 (Unhealthy)
68 (Unhealthy)
49 (Unhealthy for Sensitive Groups)
co
583 (Good)
660 (Good)
698 (Good)
1 (Good)
1 (Good)
1 (Good)
860 (Good)
657 (Good)
703 (Good)
768 (Good)
683 (Good)
745 (Good)
622 (Good)
783 (Good)
782 (Good)
1 (Good)
1 (Good)
1 (Good)
1 (Good)
923 (Good)
no2
26 (Good)
34 (Good)
25 (Good)
26 (Good)
47 (Moderate)
47 (Moderate)
46 (Moderate)
41 (Moderate)
41 (Moderate)
31 (Good)
29 (Good)
29 (Good)
29 (Good)
31 (Good)
36 (Good)
29 (Good)
49 (Moderate)
40 (Moderate)
52 (Moderate)
38 (Good)
o3
126 (Unhealthy for Sensitive Groups)
124 (Unhealthy for Sensitive Groups)
105 (Moderate)
104 (Moderate)
73 (Moderate)
68 (Good)
72 (Moderate)
91 (Moderate)
134 (Unhealthy for Sensitive Groups)
151 (Unhealthy)
149 (Unhealthy for Sensitive Groups)
121 (Unhealthy for Sensitive Groups)
125 (Unhealthy for Sensitive Groups)
116 (Moderate)
93 (Moderate)
83 (Moderate)
65 (Good)
59 (Good)
70 (Moderate)
87 (Moderate)
pm10
108 (Unhealthy)
78 (Unhealthy for Sensitive Groups)
92 (Unhealthy)
98 (Unhealthy)
137 (Very Unhealthy)
94 (Unhealthy)
96 (Unhealthy)
76 (Unhealthy for Sensitive Groups)
57 (Unhealthy for Sensitive Groups)
51 (Unhealthy for Sensitive Groups)
53 (Unhealthy for Sensitive Groups)
52 (Unhealthy for Sensitive Groups)
96 (Unhealthy)
87 (Unhealthy)
93 (Unhealthy)
98 (Unhealthy)
129 (Very Unhealthy)
130 (Very Unhealthy)
150 (Very bad Hazardous)
93 (Unhealthy)
so2
12 (Good)
13 (Good)
14 (Good)
21 (Good)
13 (Good)
17 (Good)
17 (Good)
11 (Good)
8.7 (Good)
10 (Good)
9.5 (Good)
9.1 (Good)
11 (Good)
13 (Good)
18 (Good)
24 (Good)
39 (Good)
36 (Good)
23 (Good)
13 (Good)
data source »
文昌北街
Friday, May 27, 2022, 12:00 PM
PM10 179 (Very bad Hazardous)
particulate matter (PM10) suspended dust
PM2,5 35 (Unhealthy for Sensitive Groups)
particulate matter (PM2.5) dust
O3 0.04 (Good)
ozone (O3)
NO2 0 (Good)
nitrogen dioxide (NO2)
SO2 0 (Good)
sulfur dioxide (SO2)
文昌北街
index
2022-05-27
pm10
56
pm25
56
o3
0.03
no2
0
so2
0
文昌北街
2018-10 2020-05

index
2020-05
2020-04
2020-03
2020-02
2020-01
2019-12
2019-11
2019-10
2019-09
2019-08
2019-07
2019-06
2019-05
2019-04
2019-03
2019-02
2019-01
2018-12
2018-11
2018-10
pm25
36
33
36
48
104
53
42
34
26
22
24
25
35
36
39
48
68
57
68
49
co
583
660
698
1
1
1
860
657
703
768
683
745
622
783
782
1
1
1
1
923
no2
26
34
25
26
47
47
46
41
41
31
29
29
29
31
36
29
49
40
52
38
o3
126
124
105
104
73
68
72
91
134
151
149
121
125
116
93
83
65
59
70
87
pm10
108
78
92
98
137
94
96
76
57
51
53
52
96
87
93
98
129
130
150
93
so2
12
13
14
21
13
17
17
11
8.7
10
9.5
9.1
11
13
18
24
39
36
23
13
* Pollution data source:
https://openaq.org
(ChinaAQIData)
The data is licensed under CC-By 4.0
PM10 179 (Very bad Hazardous)
PM2,5 35 (Unhealthy for Sensitive Groups)
O3 0 (Good)
NO2 0 (Good)
SO2 0 (Good)
Data on air pollution from recent days in Helanshan
| index | 2022-05-27 |
|---|---|
| pm10 | 56 Unhealthy for Sensitive Groups |
| pm25 | 56 Unhealthy |
| o3 | 0 Good |
| no2 | 0 Good |
| so2 | 0 Good |
| index | 2020-05 | 2020-04 | 2020-03 | 2020-02 | 2020-01 | 2019-12 | 2019-11 | 2019-10 | 2019-09 | 2019-08 | 2019-07 | 2019-06 | 2019-05 | 2019-04 | 2019-03 | 2019-02 | 2019-01 | 2018-12 | 2018-11 | 2018-10 |
|---|---|---|---|---|---|---|---|---|---|---|---|---|---|---|---|---|---|---|---|---|
| pm25 | 36 (Unhealthy for Sensitive Groups) | 33 (Moderate) | 36 (Unhealthy for Sensitive Groups) | 48 (Unhealthy for Sensitive Groups) | 104 (Very Unhealthy) | 53 (Unhealthy for Sensitive Groups) | 42 (Unhealthy for Sensitive Groups) | 34 (Moderate) | 26 (Moderate) | 22 (Moderate) | 24 (Moderate) | 25 (Moderate) | 35 (Unhealthy for Sensitive Groups) | 36 (Unhealthy for Sensitive Groups) | 39 (Unhealthy for Sensitive Groups) | 48 (Unhealthy for Sensitive Groups) | 68 (Unhealthy) | 57 (Unhealthy) | 68 (Unhealthy) | 49 (Unhealthy for Sensitive Groups) |
| co | 583 (Good) | 660 (Good) | 698 (Good) | 1 (Good) | 1 (Good) | 1 (Good) | 860 (Good) | 657 (Good) | 703 (Good) | 768 (Good) | 683 (Good) | 745 (Good) | 622 (Good) | 783 (Good) | 782 (Good) | 1 (Good) | 1 (Good) | 1 (Good) | 1 (Good) | 923 (Good) |
| no2 | 26 (Good) | 34 (Good) | 25 (Good) | 26 (Good) | 47 (Moderate) | 47 (Moderate) | 46 (Moderate) | 41 (Moderate) | 41 (Moderate) | 31 (Good) | 29 (Good) | 29 (Good) | 29 (Good) | 31 (Good) | 36 (Good) | 29 (Good) | 49 (Moderate) | 40 (Moderate) | 52 (Moderate) | 38 (Good) |
| o3 | 126 (Unhealthy for Sensitive Groups) | 124 (Unhealthy for Sensitive Groups) | 105 (Moderate) | 104 (Moderate) | 73 (Moderate) | 68 (Good) | 72 (Moderate) | 91 (Moderate) | 134 (Unhealthy for Sensitive Groups) | 151 (Unhealthy) | 149 (Unhealthy for Sensitive Groups) | 121 (Unhealthy for Sensitive Groups) | 125 (Unhealthy for Sensitive Groups) | 116 (Moderate) | 93 (Moderate) | 83 (Moderate) | 65 (Good) | 59 (Good) | 70 (Moderate) | 87 (Moderate) |
| pm10 | 108 (Unhealthy) | 78 (Unhealthy for Sensitive Groups) | 92 (Unhealthy) | 98 (Unhealthy) | 137 (Very Unhealthy) | 94 (Unhealthy) | 96 (Unhealthy) | 76 (Unhealthy for Sensitive Groups) | 57 (Unhealthy for Sensitive Groups) | 51 (Unhealthy for Sensitive Groups) | 53 (Unhealthy for Sensitive Groups) | 52 (Unhealthy for Sensitive Groups) | 96 (Unhealthy) | 87 (Unhealthy) | 93 (Unhealthy) | 98 (Unhealthy) | 129 (Very Unhealthy) | 130 (Very Unhealthy) | 150 (Very bad Hazardous) | 93 (Unhealthy) |
| so2 | 12 (Good) | 13 (Good) | 14 (Good) | 21 (Good) | 13 (Good) | 17 (Good) | 17 (Good) | 11 (Good) | 8.7 (Good) | 10 (Good) | 9.5 (Good) | 9.1 (Good) | 11 (Good) | 13 (Good) | 18 (Good) | 24 (Good) | 39 (Good) | 36 (Good) | 23 (Good) | 13 (Good) |
PM10 179 (Very bad Hazardous)
particulate matter (PM10) suspended dustPM2,5 35 (Unhealthy for Sensitive Groups)
particulate matter (PM2.5) dustO3 0.04 (Good)
ozone (O3)NO2 0 (Good)
nitrogen dioxide (NO2)SO2 0 (Good)
sulfur dioxide (SO2)文昌北街
| index | 2022-05-27 |
|---|---|
| pm10 | 56 |
| pm25 | 56 |
| o3 | 0.03 |
| no2 | 0 |
| so2 | 0 |
文昌北街
| index | 2020-05 | 2020-04 | 2020-03 | 2020-02 | 2020-01 | 2019-12 | 2019-11 | 2019-10 | 2019-09 | 2019-08 | 2019-07 | 2019-06 | 2019-05 | 2019-04 | 2019-03 | 2019-02 | 2019-01 | 2018-12 | 2018-11 | 2018-10 |
|---|---|---|---|---|---|---|---|---|---|---|---|---|---|---|---|---|---|---|---|---|
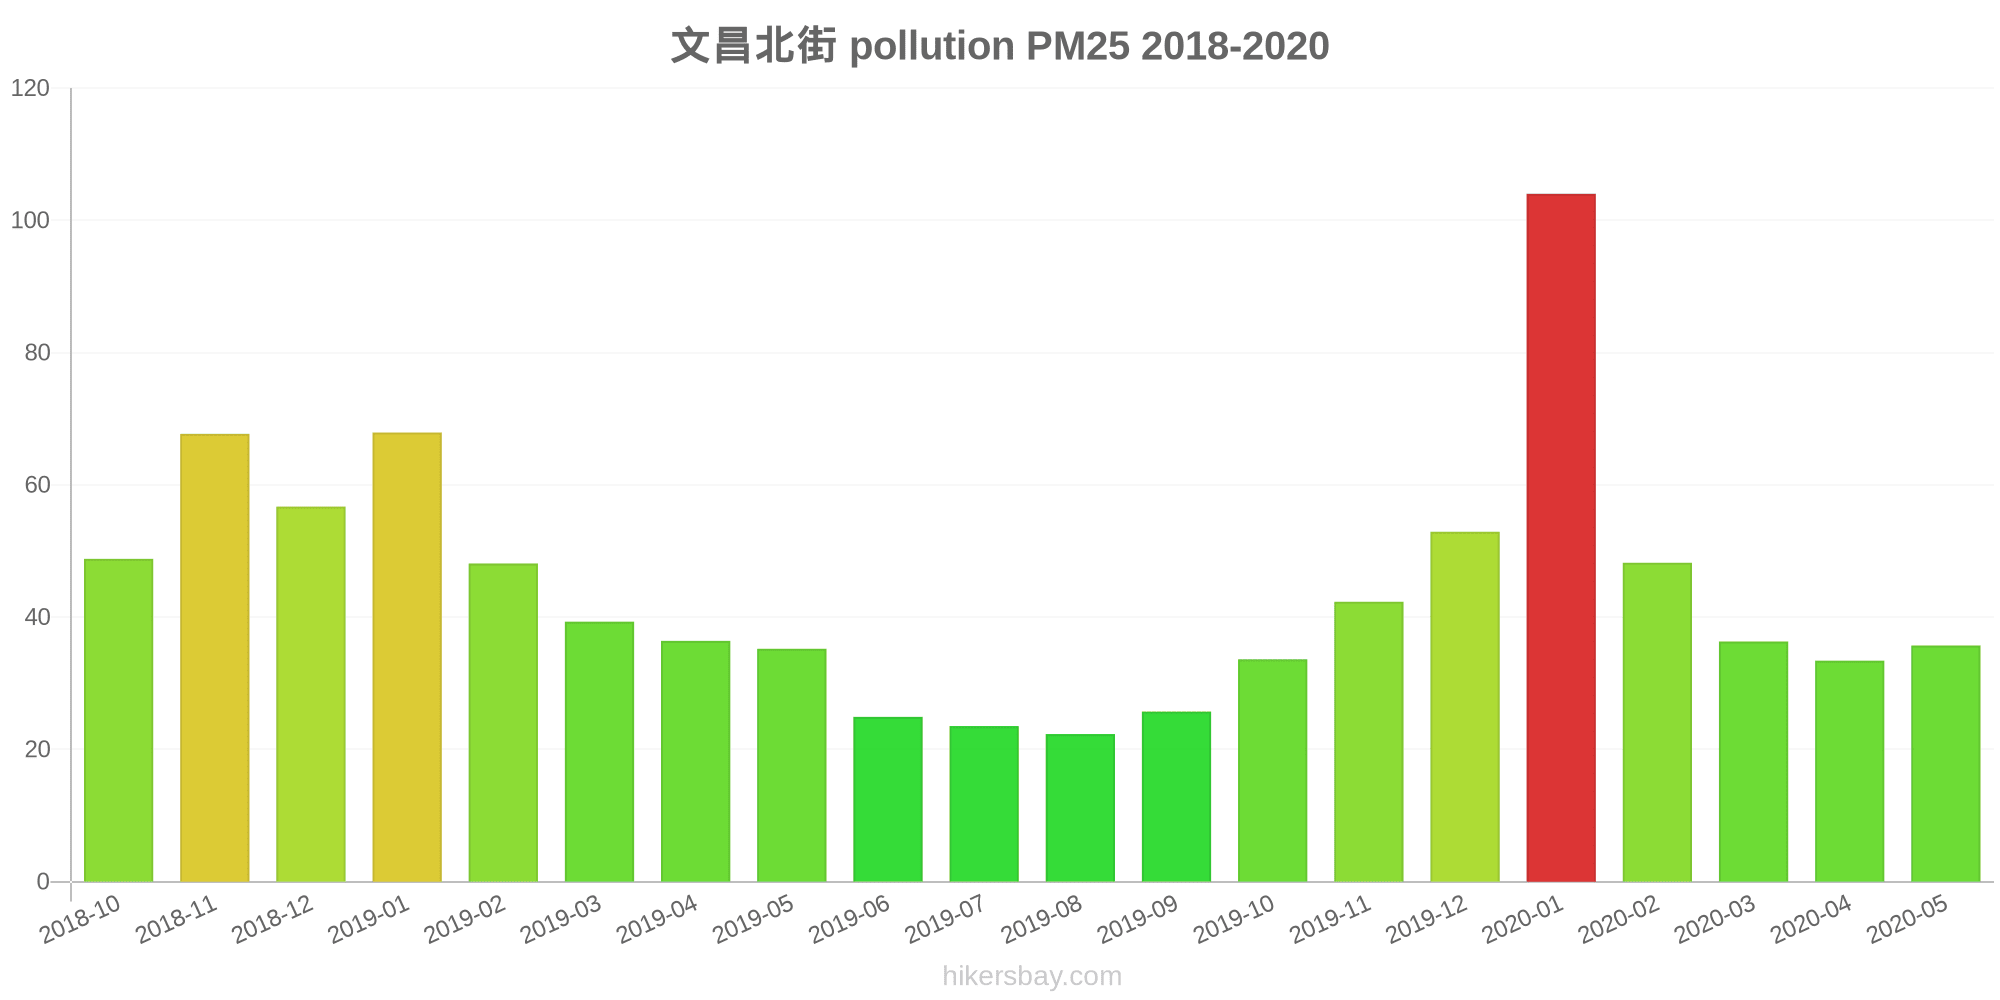
| pm25 | 36 | 33 | 36 | 48 | 104 | 53 | 42 | 34 | 26 | 22 | 24 | 25 | 35 | 36 | 39 | 48 | 68 | 57 | 68 | 49 |
| co | 583 | 660 | 698 | 1 | 1 | 1 | 860 | 657 | 703 | 768 | 683 | 745 | 622 | 783 | 782 | 1 | 1 | 1 | 1 | 923 |
| no2 | 26 | 34 | 25 | 26 | 47 | 47 | 46 | 41 | 41 | 31 | 29 | 29 | 29 | 31 | 36 | 29 | 49 | 40 | 52 | 38 |
| o3 | 126 | 124 | 105 | 104 | 73 | 68 | 72 | 91 | 134 | 151 | 149 | 121 | 125 | 116 | 93 | 83 | 65 | 59 | 70 | 87 |
| pm10 | 108 | 78 | 92 | 98 | 137 | 94 | 96 | 76 | 57 | 51 | 53 | 52 | 96 | 87 | 93 | 98 | 129 | 130 | 150 | 93 |
| so2 | 12 | 13 | 14 | 21 | 13 | 17 | 17 | 11 | 8.7 | 10 | 9.5 | 9.1 | 11 | 13 | 18 | 24 | 39 | 36 | 23 | 13 |