Air Pollution in Heze: Real-time Air Quality Index and smog alert.
Pollution and air quality forecast for Heze. Today is Tuesday, June 16, 2026. The following air pollution values have been recorded for Heze:- particulate matter (PM10) suspended dust - 179 (Very bad Hazardous)
- particulate matter (PM2.5) dust - 35 (Unhealthy for Sensitive Groups)
- ozone (O3) - 0 (Good)
- nitrogen dioxide (NO2) - 0 (Good)
- sulfur dioxide (SO2) - 0 (Good)

What is the air quality in Heze today? Is the air polluted in Heze?. Is there smog?
What is the level of PM10 today in Heze? (particulate matter (PM10) suspended dust)
The current level of particulate matter PM10 in Heze is:
179 (Very bad Hazardous)
The highest PM10 values usually occur in month: 175 (January 2020).
The lowest value of particulate matter PM10 pollution in Heze is usually recorded in: August (54).
What is the current level of PM2.5 in Heze? (particulate matter (PM2.5) dust)
Today's PM2.5 level is:
35 (Unhealthy for Sensitive Groups)
For comparison, the highest level of PM2.5 in Heze in the last 7 days was: 56 (Friday, May 27, 2022) and the lowest: 56 (Friday, May 27, 2022).
The highest PM2.5 values were recorded: 124 (January 2020).
The lowest level of particulate matter PM2.5 pollution occurs in month: May (28).
How is the O3 level today in Heze? (ozone (O3))
0 (Good)
How high is the level of NO2? (nitrogen dioxide (NO2))
0 (Good)
What is the level of SO2 pollution? (sulfur dioxide (SO2))
0 (Good)
Current data Friday, May 27, 2022, 12:00 PM
PM10 179 (Very bad Hazardous)
PM2,5 35 (Unhealthy for Sensitive Groups)
O3 0 (Good)
NO2 0 (Good)
SO2 0 (Good)
Data on air pollution from recent days in Heze
index
2022-05-27
pm10
56
Unhealthy for Sensitive Groups
pm25
56
Unhealthy
o3
0
Good
no2
0
Good
so2
0
Good
data source »
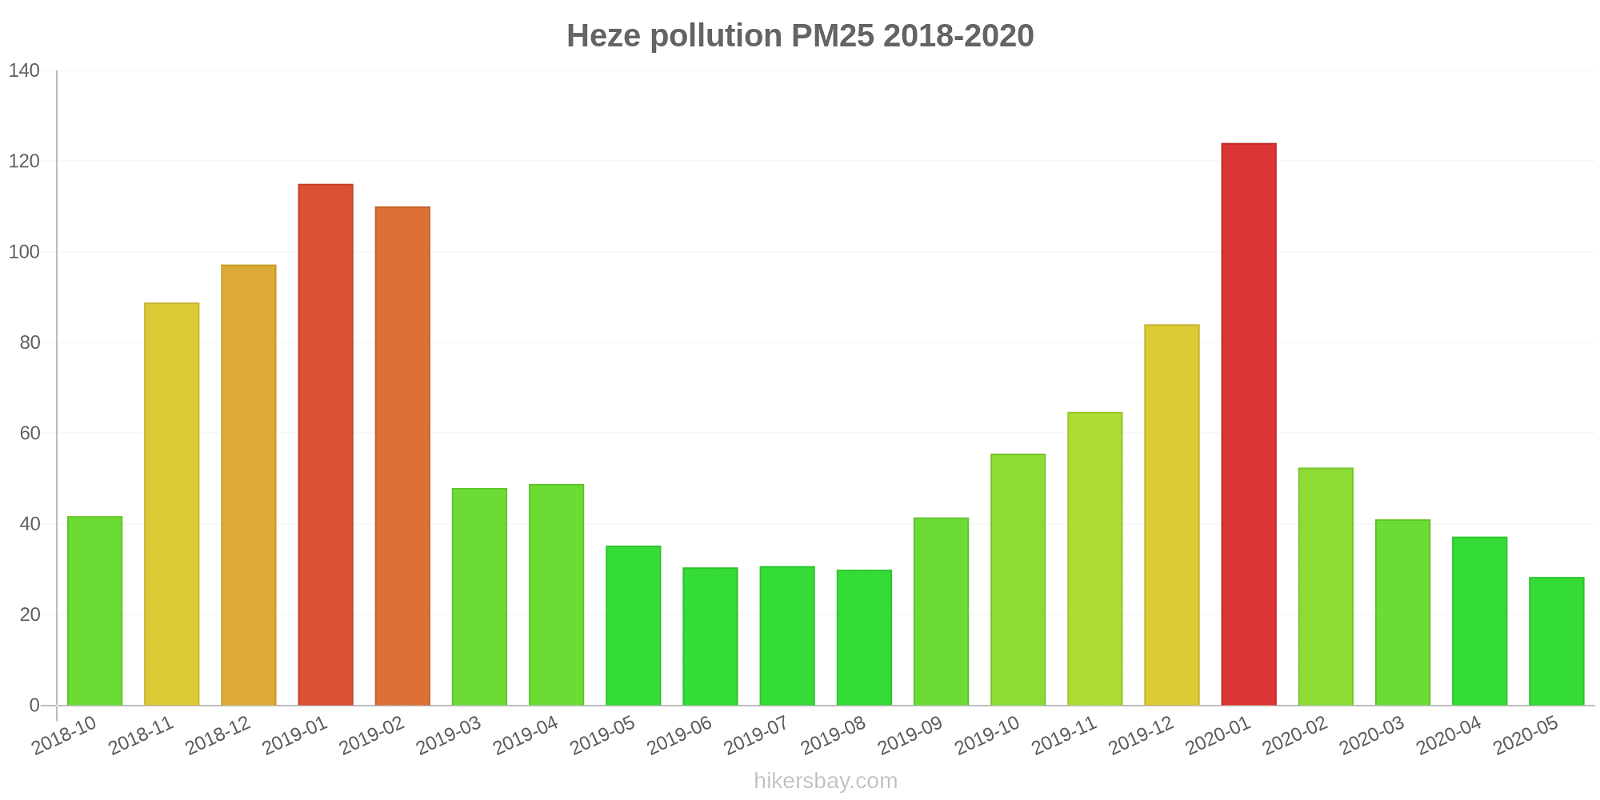
Air pollution in Heze from October 2018 to May 2020
index
2020-05
2020-04
2020-03
2020-02
2020-01
2019-12
2019-11
2019-10
2019-09
2019-08
2019-07
2019-06
2019-05
2019-04
2019-03
2019-02
2019-01
2018-12
2018-11
2018-10
pm25
28 (Moderate)
37 (Unhealthy for Sensitive Groups)
41 (Unhealthy for Sensitive Groups)
52 (Unhealthy for Sensitive Groups)
124 (Very bad Hazardous)
84 (Very Unhealthy)
65 (Unhealthy)
56 (Unhealthy)
41 (Unhealthy for Sensitive Groups)
30 (Moderate)
31 (Moderate)
30 (Moderate)
35 (Unhealthy for Sensitive Groups)
49 (Unhealthy for Sensitive Groups)
48 (Unhealthy for Sensitive Groups)
110 (Very bad Hazardous)
115 (Very bad Hazardous)
97 (Very Unhealthy)
89 (Very Unhealthy)
42 (Unhealthy for Sensitive Groups)
co
463 (Good)
446 (Good)
524 (Good)
607 (Good)
1 (Good)
889 (Good)
756 (Good)
717 (Good)
704 (Good)
768 (Good)
704 (Good)
626 (Good)
553 (Good)
769 (Good)
738 (Good)
1 (Good)
1 (Good)
1 (Good)
1 (Good)
899 (Good)
no2
19 (Good)
27 (Good)
23 (Good)
13 (Good)
39 (Good)
47 (Moderate)
44 (Moderate)
37 (Good)
31 (Good)
24 (Good)
20 (Good)
23 (Good)
27 (Good)
22 (Good)
27 (Good)
31 (Good)
46 (Moderate)
50 (Moderate)
42 (Moderate)
44 (Moderate)
o3
151 (Unhealthy)
141 (Unhealthy for Sensitive Groups)
114 (Moderate)
91 (Moderate)
75 (Moderate)
61 (Good)
99 (Moderate)
131 (Unhealthy for Sensitive Groups)
177 (Unhealthy)
155 (Unhealthy)
180 (Very Unhealthy)
185 (Very Unhealthy)
162 (Unhealthy)
123 (Unhealthy for Sensitive Groups)
126 (Unhealthy for Sensitive Groups)
98 (Moderate)
68 (Good)
50 (Good)
89 (Moderate)
116 (Moderate)
pm10
89 (Unhealthy)
101 (Unhealthy)
102 (Unhealthy)
83 (Unhealthy)
175 (Very bad Hazardous)
147 (Very Unhealthy)
155 (Very bad Hazardous)
132 (Very Unhealthy)
85 (Unhealthy)
54 (Unhealthy for Sensitive Groups)
59 (Unhealthy for Sensitive Groups)
81 (Unhealthy)
92 (Unhealthy)
106 (Unhealthy)
118 (Very Unhealthy)
154 (Very bad Hazardous)
174 (Very bad Hazardous)
171 (Very bad Hazardous)
156 (Very bad Hazardous)
109 (Unhealthy)
so2
9.9 (Good)
14 (Good)
12 (Good)
8.2 (Good)
15 (Good)
16 (Good)
19 (Good)
14 (Good)
15 (Good)
12 (Good)
9.1 (Good)
11 (Good)
13 (Good)
17 (Good)
14 (Good)
14 (Good)
18 (Good)
18 (Good)
13 (Good)
18 (Good)
data source »
市政协
Friday, May 27, 2022, 12:00 PM
PM10 179 (Very bad Hazardous)
particulate matter (PM10) suspended dust
PM2,5 35 (Unhealthy for Sensitive Groups)
particulate matter (PM2.5) dust
O3 0.04 (Good)
ozone (O3)
NO2 0 (Good)
nitrogen dioxide (NO2)
SO2 0 (Good)
sulfur dioxide (SO2)
市政协
index
2022-05-27
pm10
56
pm25
56
o3
0.03
no2
0
so2
0
市政协
2018-10 2020-05
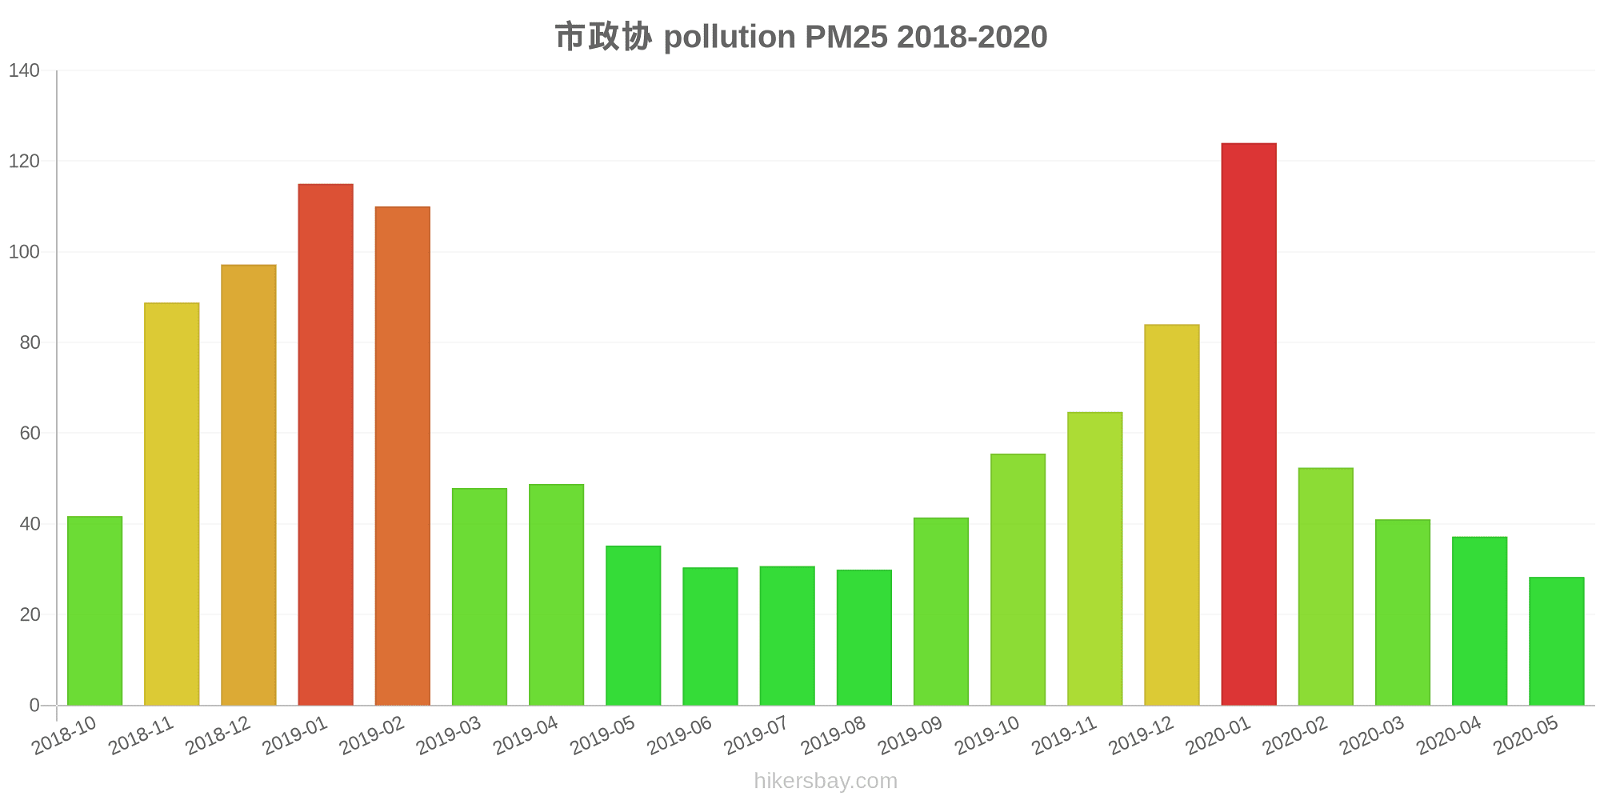
index
2020-05
2020-04
2020-03
2020-02
2020-01
2019-12
2019-11
2019-10
2019-09
2019-08
2019-07
2019-06
2019-05
2019-04
2019-03
2019-02
2019-01
2018-12
2018-11
2018-10
pm25
28
37
41
52
124
84
65
56
41
30
31
30
35
49
48
110
115
97
89
42
co
463
446
524
607
1
889
756
717
704
768
704
626
553
769
738
1
1
1
1
899
no2
19
27
23
13
39
47
44
37
31
24
20
23
27
22
27
31
46
50
42
44
o3
151
141
114
91
75
61
99
131
177
155
180
185
162
123
126
98
68
50
89
116
pm10
89
101
102
83
175
147
155
132
85
54
59
81
92
106
118
154
174
171
156
109
so2
9.9
14
12
8.2
15
16
19
14
15
12
9.1
11
13
17
14
14
18
18
13
18
* Pollution data source:
https://openaq.org
(ChinaAQIData)
The data is licensed under CC-By 4.0
PM10 179 (Very bad Hazardous)
PM2,5 35 (Unhealthy for Sensitive Groups)
O3 0 (Good)
NO2 0 (Good)
SO2 0 (Good)
Data on air pollution from recent days in Heze
| index | 2022-05-27 |
|---|---|
| pm10 | 56 Unhealthy for Sensitive Groups |
| pm25 | 56 Unhealthy |
| o3 | 0 Good |
| no2 | 0 Good |
| so2 | 0 Good |

| index | 2020-05 | 2020-04 | 2020-03 | 2020-02 | 2020-01 | 2019-12 | 2019-11 | 2019-10 | 2019-09 | 2019-08 | 2019-07 | 2019-06 | 2019-05 | 2019-04 | 2019-03 | 2019-02 | 2019-01 | 2018-12 | 2018-11 | 2018-10 |
|---|---|---|---|---|---|---|---|---|---|---|---|---|---|---|---|---|---|---|---|---|
| pm25 | 28 (Moderate) | 37 (Unhealthy for Sensitive Groups) | 41 (Unhealthy for Sensitive Groups) | 52 (Unhealthy for Sensitive Groups) | 124 (Very bad Hazardous) | 84 (Very Unhealthy) | 65 (Unhealthy) | 56 (Unhealthy) | 41 (Unhealthy for Sensitive Groups) | 30 (Moderate) | 31 (Moderate) | 30 (Moderate) | 35 (Unhealthy for Sensitive Groups) | 49 (Unhealthy for Sensitive Groups) | 48 (Unhealthy for Sensitive Groups) | 110 (Very bad Hazardous) | 115 (Very bad Hazardous) | 97 (Very Unhealthy) | 89 (Very Unhealthy) | 42 (Unhealthy for Sensitive Groups) |
| co | 463 (Good) | 446 (Good) | 524 (Good) | 607 (Good) | 1 (Good) | 889 (Good) | 756 (Good) | 717 (Good) | 704 (Good) | 768 (Good) | 704 (Good) | 626 (Good) | 553 (Good) | 769 (Good) | 738 (Good) | 1 (Good) | 1 (Good) | 1 (Good) | 1 (Good) | 899 (Good) |
| no2 | 19 (Good) | 27 (Good) | 23 (Good) | 13 (Good) | 39 (Good) | 47 (Moderate) | 44 (Moderate) | 37 (Good) | 31 (Good) | 24 (Good) | 20 (Good) | 23 (Good) | 27 (Good) | 22 (Good) | 27 (Good) | 31 (Good) | 46 (Moderate) | 50 (Moderate) | 42 (Moderate) | 44 (Moderate) |
| o3 | 151 (Unhealthy) | 141 (Unhealthy for Sensitive Groups) | 114 (Moderate) | 91 (Moderate) | 75 (Moderate) | 61 (Good) | 99 (Moderate) | 131 (Unhealthy for Sensitive Groups) | 177 (Unhealthy) | 155 (Unhealthy) | 180 (Very Unhealthy) | 185 (Very Unhealthy) | 162 (Unhealthy) | 123 (Unhealthy for Sensitive Groups) | 126 (Unhealthy for Sensitive Groups) | 98 (Moderate) | 68 (Good) | 50 (Good) | 89 (Moderate) | 116 (Moderate) |
| pm10 | 89 (Unhealthy) | 101 (Unhealthy) | 102 (Unhealthy) | 83 (Unhealthy) | 175 (Very bad Hazardous) | 147 (Very Unhealthy) | 155 (Very bad Hazardous) | 132 (Very Unhealthy) | 85 (Unhealthy) | 54 (Unhealthy for Sensitive Groups) | 59 (Unhealthy for Sensitive Groups) | 81 (Unhealthy) | 92 (Unhealthy) | 106 (Unhealthy) | 118 (Very Unhealthy) | 154 (Very bad Hazardous) | 174 (Very bad Hazardous) | 171 (Very bad Hazardous) | 156 (Very bad Hazardous) | 109 (Unhealthy) |
| so2 | 9.9 (Good) | 14 (Good) | 12 (Good) | 8.2 (Good) | 15 (Good) | 16 (Good) | 19 (Good) | 14 (Good) | 15 (Good) | 12 (Good) | 9.1 (Good) | 11 (Good) | 13 (Good) | 17 (Good) | 14 (Good) | 14 (Good) | 18 (Good) | 18 (Good) | 13 (Good) | 18 (Good) |
PM10 179 (Very bad Hazardous)
particulate matter (PM10) suspended dustPM2,5 35 (Unhealthy for Sensitive Groups)
particulate matter (PM2.5) dustO3 0.04 (Good)
ozone (O3)NO2 0 (Good)
nitrogen dioxide (NO2)SO2 0 (Good)
sulfur dioxide (SO2)市政协
| index | 2022-05-27 |
|---|---|
| pm10 | 56 |
| pm25 | 56 |
| o3 | 0.03 |
| no2 | 0 |
| so2 | 0 |
市政协

| index | 2020-05 | 2020-04 | 2020-03 | 2020-02 | 2020-01 | 2019-12 | 2019-11 | 2019-10 | 2019-09 | 2019-08 | 2019-07 | 2019-06 | 2019-05 | 2019-04 | 2019-03 | 2019-02 | 2019-01 | 2018-12 | 2018-11 | 2018-10 |
|---|---|---|---|---|---|---|---|---|---|---|---|---|---|---|---|---|---|---|---|---|
| pm25 | 28 | 37 | 41 | 52 | 124 | 84 | 65 | 56 | 41 | 30 | 31 | 30 | 35 | 49 | 48 | 110 | 115 | 97 | 89 | 42 |
| co | 463 | 446 | 524 | 607 | 1 | 889 | 756 | 717 | 704 | 768 | 704 | 626 | 553 | 769 | 738 | 1 | 1 | 1 | 1 | 899 |
| no2 | 19 | 27 | 23 | 13 | 39 | 47 | 44 | 37 | 31 | 24 | 20 | 23 | 27 | 22 | 27 | 31 | 46 | 50 | 42 | 44 |
| o3 | 151 | 141 | 114 | 91 | 75 | 61 | 99 | 131 | 177 | 155 | 180 | 185 | 162 | 123 | 126 | 98 | 68 | 50 | 89 | 116 |
| pm10 | 89 | 101 | 102 | 83 | 175 | 147 | 155 | 132 | 85 | 54 | 59 | 81 | 92 | 106 | 118 | 154 | 174 | 171 | 156 | 109 |
| so2 | 9.9 | 14 | 12 | 8.2 | 15 | 16 | 19 | 14 | 15 | 12 | 9.1 | 11 | 13 | 17 | 14 | 14 | 18 | 18 | 13 | 18 |