Air Pollution in Hongjialou: Real-time Air Quality Index and smog alert.
Pollution and air quality forecast for Hongjialou. Today is Tuesday, June 16, 2026. The following air pollution values have been recorded for Hongjialou:- particulate matter (PM10) suspended dust - 53 (Unhealthy for Sensitive Groups)
- ozone (O3) - 0 (Good)
- particulate matter (PM2.5) dust - 7 (Good)
- sulfur dioxide (SO2) - 18 (Good)
- nitrogen dioxide (NO2) - 3 (Good)
- carbon monoxide (CO) - 1 (Good)

What is the air quality in Hongjialou today? Is the air polluted in Hongjialou?. Is there smog?
What is the level of PM10 today in Hongjialou? (particulate matter (PM10) suspended dust)
The current level of particulate matter PM10 in Hongjialou is:
53 (Unhealthy for Sensitive Groups)
The highest PM10 values usually occur in month: 179 (January 2019).
The lowest value of particulate matter PM10 pollution in Hongjialou is usually recorded in: August (62).
How is the O3 level today in Hongjialou? (ozone (O3))
0 (Good)
What is the current level of PM2.5 in Hongjialou? (particulate matter (PM2.5) dust)
Today's PM2.5 level is:
7 (Good)
For comparison, the highest level of PM2.5 in Hongjialou in the last 7 days was: 21 (Friday, May 27, 2022) and the lowest: 21 (Friday, May 27, 2022).
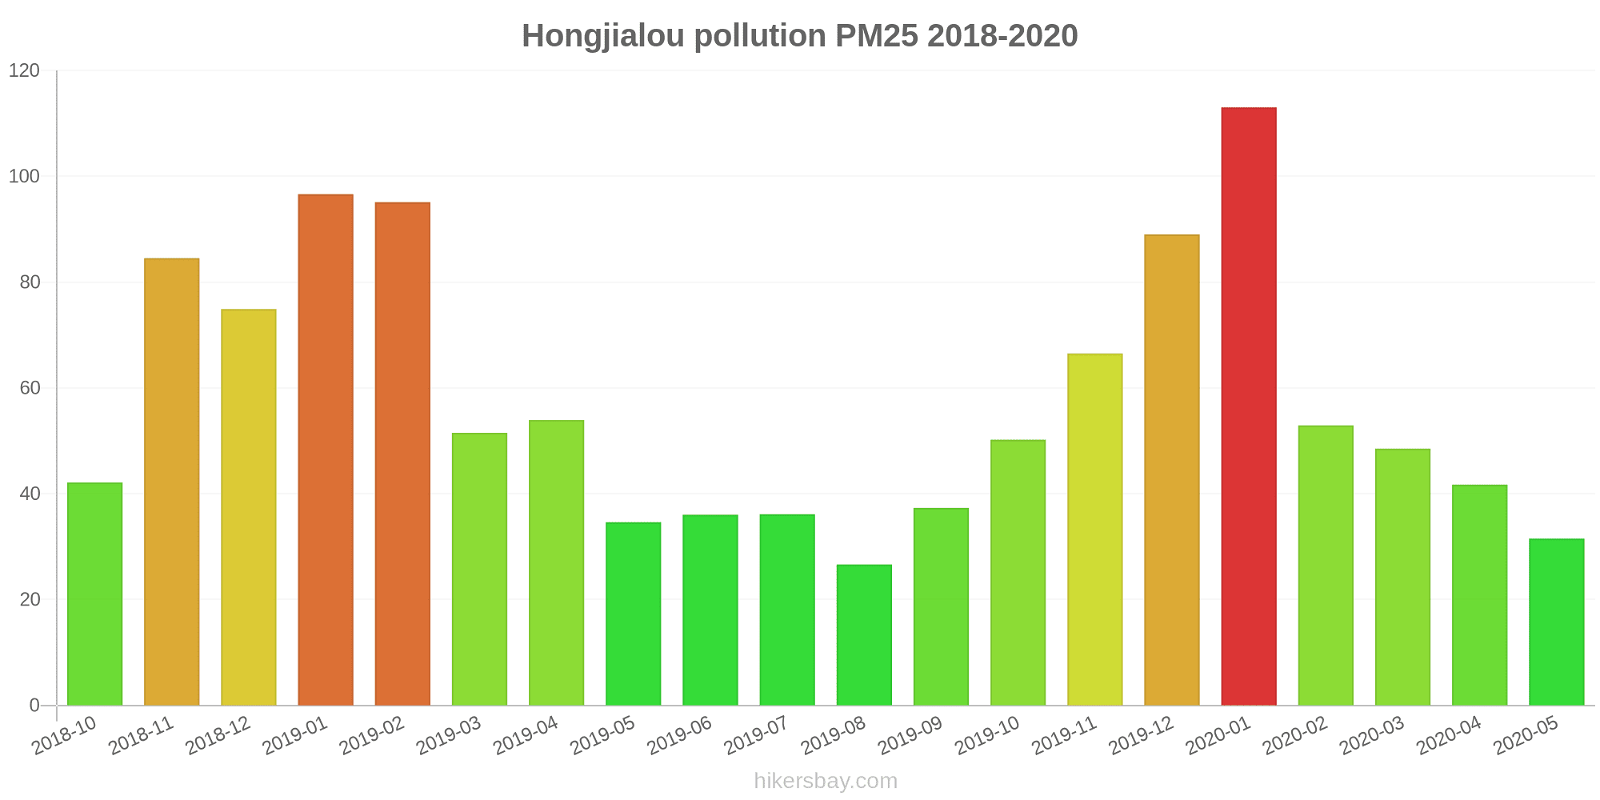
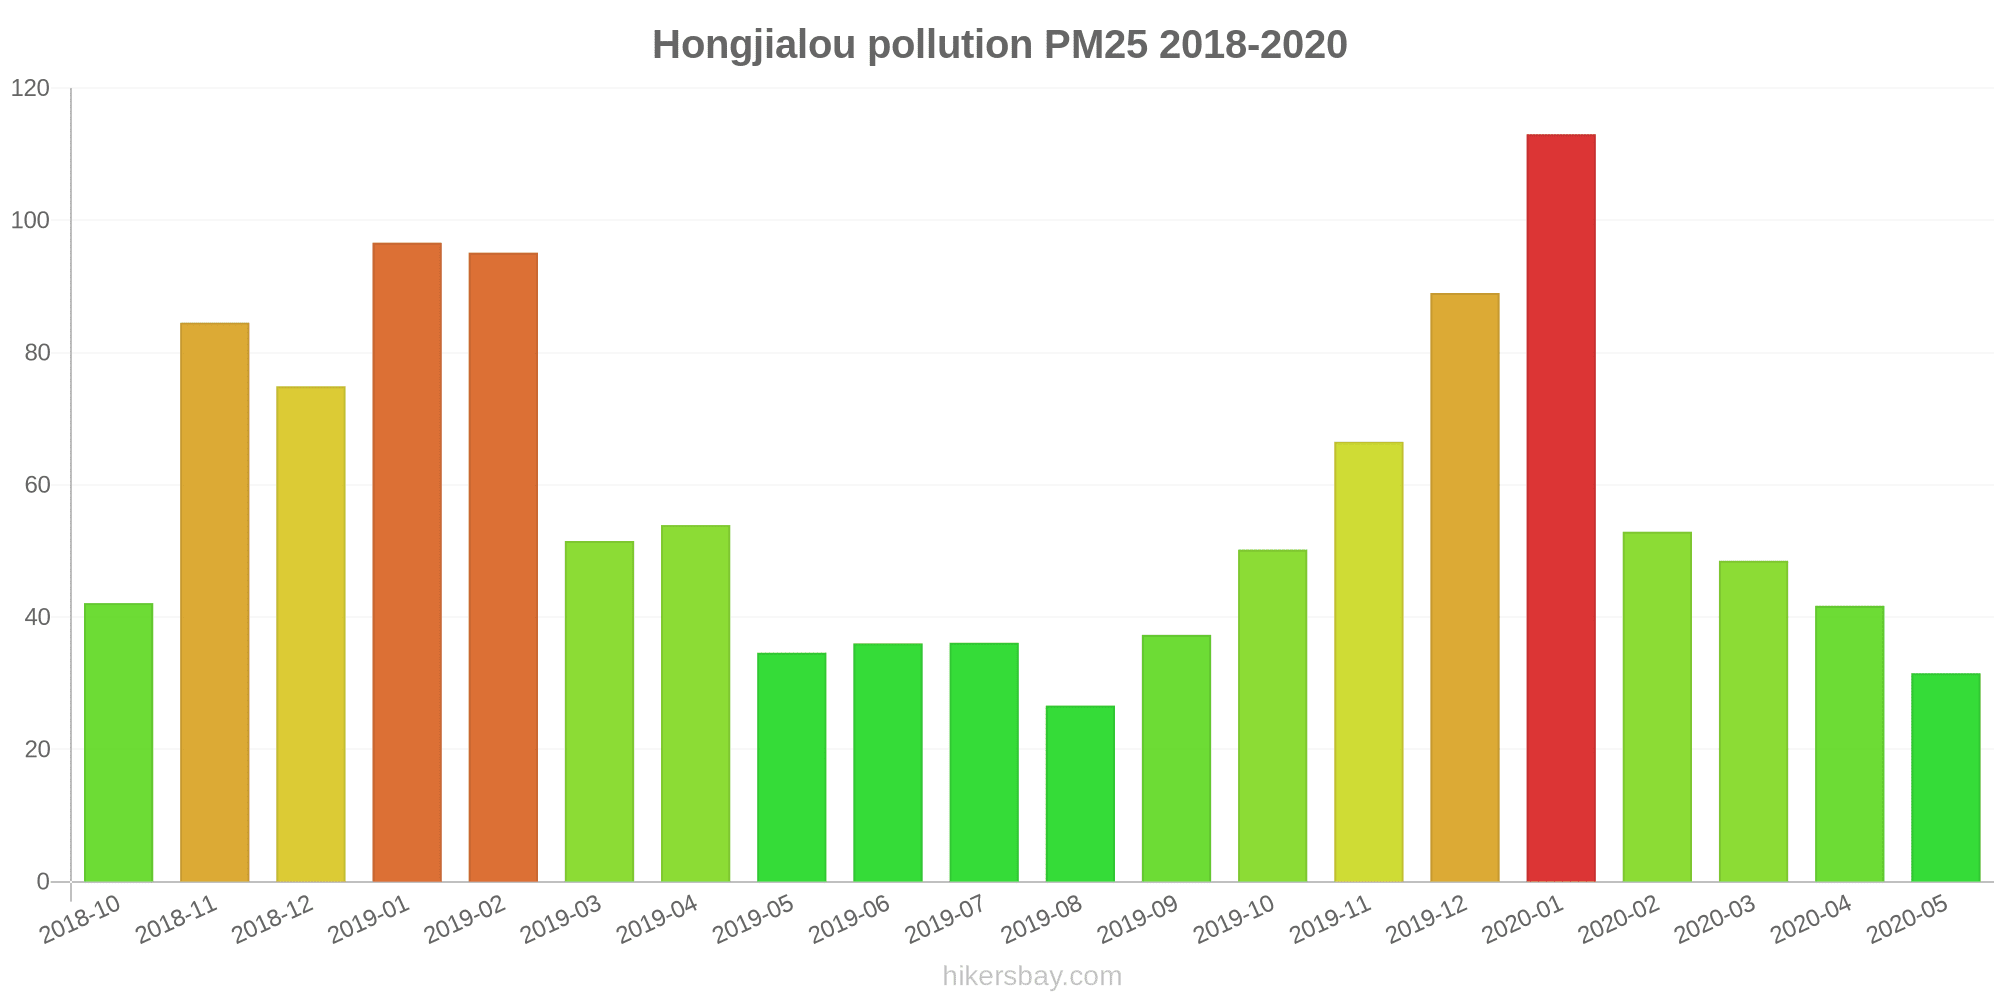
The highest PM2.5 values were recorded: 113 (January 2020).
The lowest level of particulate matter PM2.5 pollution occurs in month: August (27).
What is the level of SO2 pollution? (sulfur dioxide (SO2))
18 (Good)
How high is the level of NO2? (nitrogen dioxide (NO2))
3 (Good)
How high is the CO level? (carbon monoxide (CO))
1 (Good)
Current data Friday, May 27, 2022, 12:00 PM
PM10 53 (Unhealthy for Sensitive Groups)
O3 0 (Good)
PM2,5 7 (Good)
SO2 18 (Good)
NO2 3 (Good)
CO 1 (Good)
Data on air pollution from recent days in Hongjialou
index
2022-05-27
pm10
51
Unhealthy for Sensitive Groups
o3
0
Good
pm25
21
Moderate
so2
10
Good
no2
0
Good
co
1
Good
data source »
Air pollution in Hongjialou from October 2018 to May 2020
index
2020-05
2020-04
2020-03
2020-02
2020-01
2019-12
2019-11
2019-10
2019-09
2019-08
2019-07
2019-06
2019-05
2019-04
2019-03
2019-02
2019-01
2018-12
2018-11
2018-10
pm25
32 (Moderate)
42 (Unhealthy for Sensitive Groups)
49 (Unhealthy for Sensitive Groups)
53 (Unhealthy for Sensitive Groups)
113 (Very bad Hazardous)
89 (Very Unhealthy)
67 (Unhealthy)
50 (Unhealthy for Sensitive Groups)
37 (Unhealthy for Sensitive Groups)
27 (Moderate)
36 (Unhealthy for Sensitive Groups)
36 (Unhealthy for Sensitive Groups)
35 (Moderate)
54 (Unhealthy for Sensitive Groups)
52 (Unhealthy for Sensitive Groups)
95 (Very Unhealthy)
97 (Very Unhealthy)
75 (Unhealthy)
85 (Very Unhealthy)
42 (Unhealthy for Sensitive Groups)
co
734 (Good)
662 (Good)
620 (Good)
703 (Good)
1 (Good)
1 (Good)
1 (Good)
776 (Good)
916 (Good)
866 (Good)
709 (Good)
638 (Good)
672 (Good)
820 (Good)
562 (Good)
1 (Good)
1 (Good)
1 (Good)
1 (Good)
814 (Good)
no2
29 (Good)
36 (Good)
36 (Good)
26 (Good)
62 (Moderate)
57 (Moderate)
61 (Moderate)
60 (Moderate)
56 (Moderate)
42 (Moderate)
31 (Good)
29 (Good)
33 (Good)
49 (Moderate)
49 (Moderate)
58 (Moderate)
70 (Moderate)
61 (Moderate)
68 (Moderate)
65 (Moderate)
o3
173 (Unhealthy)
144 (Unhealthy for Sensitive Groups)
123 (Unhealthy for Sensitive Groups)
99 (Moderate)
73 (Moderate)
53 (Good)
75 (Moderate)
123 (Unhealthy for Sensitive Groups)
174 (Unhealthy)
162 (Unhealthy)
225 (Very Unhealthy)
236 (Very Unhealthy)
176 (Unhealthy)
138 (Unhealthy for Sensitive Groups)
118 (Moderate)
79 (Moderate)
59 (Good)
46 (Good)
81 (Moderate)
106 (Moderate)
pm10
81 (Unhealthy)
96 (Unhealthy)
101 (Unhealthy)
77 (Unhealthy for Sensitive Groups)
152 (Very bad Hazardous)
141 (Very Unhealthy)
146 (Very Unhealthy)
110 (Very Unhealthy)
92 (Unhealthy)
62 (Unhealthy for Sensitive Groups)
75 (Unhealthy for Sensitive Groups)
89 (Unhealthy)
101 (Unhealthy)
140 (Very Unhealthy)
138 (Very Unhealthy)
156 (Very bad Hazardous)
179 (Very bad Hazardous)
162 (Very bad Hazardous)
177 (Very bad Hazardous)
125 (Very Unhealthy)
so2
8.5 (Good)
8.8 (Good)
8.9 (Good)
9.5 (Good)
24 (Good)
17 (Good)
12 (Good)
9.8 (Good)
12 (Good)
8.7 (Good)
7.8 (Good)
11 (Good)
8.8 (Good)
13 (Good)
11 (Good)
18 (Good)
27 (Good)
22 (Good)
14 (Good)
11 (Good)
data source »
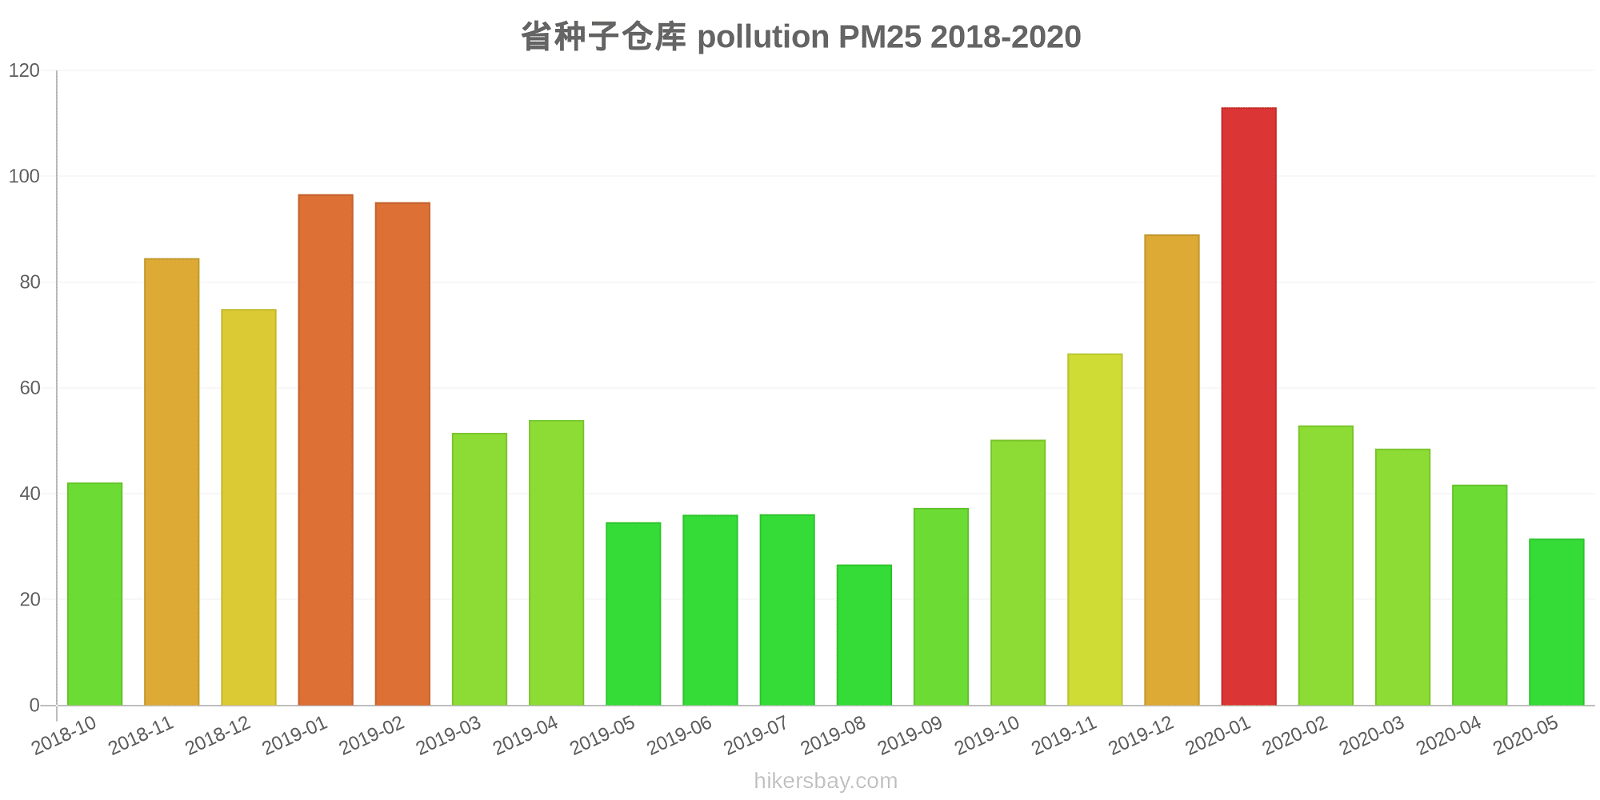
省种子仓库
Friday, May 27, 2022, 12:00 PM
PM10 53 (Unhealthy for Sensitive Groups)
particulate matter (PM10) suspended dust
O3 0.02 (Good)
ozone (O3)
PM2,5 6.6 (Good)
particulate matter (PM2.5) dust
SO2 18 (Good)
sulfur dioxide (SO2)
NO2 3 (Good)
nitrogen dioxide (NO2)
CO 1.3 (Good)
carbon monoxide (CO)
省种子仓库
index
2022-05-27
pm10
51
o3
0.02
pm25
21
so2
9.6
no2
0.38
co
0.64
省种子仓库
2018-10 2020-05
index
2020-05
2020-04
2020-03
2020-02
2020-01
2019-12
2019-11
2019-10
2019-09
2019-08
2019-07
2019-06
2019-05
2019-04
2019-03
2019-02
2019-01
2018-12
2018-11
2018-10
pm25
32
42
49
53
113
89
67
50
37
27
36
36
35
54
52
95
97
75
85
42
co
734
662
620
703
1
1
1
776
916
866
709
638
672
820
562
1
1
1
1
814
no2
29
36
36
26
62
57
61
60
56
42
31
29
33
49
49
58
70
61
68
65
o3
173
144
123
99
73
53
75
123
174
162
225
236
176
138
118
79
59
46
81
106
pm10
81
96
101
77
152
141
146
110
92
62
75
89
101
140
138
156
179
162
177
125
so2
8.5
8.8
8.9
9.5
24
17
12
9.8
12
8.7
7.8
11
8.8
13
11
18
27
22
14
11
* Pollution data source:
https://openaq.org
(ChinaAQIData)
The data is licensed under CC-By 4.0
PM10 53 (Unhealthy for Sensitive Groups)
O3 0 (Good)
PM2,5 7 (Good)
SO2 18 (Good)
NO2 3 (Good)
CO 1 (Good)
Data on air pollution from recent days in Hongjialou
| index | 2022-05-27 |
|---|---|
| pm10 | 51 Unhealthy for Sensitive Groups |
| o3 | 0 Good |
| pm25 | 21 Moderate |
| so2 | 10 Good |
| no2 | 0 Good |
| co | 1 Good |
| index | 2020-05 | 2020-04 | 2020-03 | 2020-02 | 2020-01 | 2019-12 | 2019-11 | 2019-10 | 2019-09 | 2019-08 | 2019-07 | 2019-06 | 2019-05 | 2019-04 | 2019-03 | 2019-02 | 2019-01 | 2018-12 | 2018-11 | 2018-10 |
|---|---|---|---|---|---|---|---|---|---|---|---|---|---|---|---|---|---|---|---|---|
| pm25 | 32 (Moderate) | 42 (Unhealthy for Sensitive Groups) | 49 (Unhealthy for Sensitive Groups) | 53 (Unhealthy for Sensitive Groups) | 113 (Very bad Hazardous) | 89 (Very Unhealthy) | 67 (Unhealthy) | 50 (Unhealthy for Sensitive Groups) | 37 (Unhealthy for Sensitive Groups) | 27 (Moderate) | 36 (Unhealthy for Sensitive Groups) | 36 (Unhealthy for Sensitive Groups) | 35 (Moderate) | 54 (Unhealthy for Sensitive Groups) | 52 (Unhealthy for Sensitive Groups) | 95 (Very Unhealthy) | 97 (Very Unhealthy) | 75 (Unhealthy) | 85 (Very Unhealthy) | 42 (Unhealthy for Sensitive Groups) |
| co | 734 (Good) | 662 (Good) | 620 (Good) | 703 (Good) | 1 (Good) | 1 (Good) | 1 (Good) | 776 (Good) | 916 (Good) | 866 (Good) | 709 (Good) | 638 (Good) | 672 (Good) | 820 (Good) | 562 (Good) | 1 (Good) | 1 (Good) | 1 (Good) | 1 (Good) | 814 (Good) |
| no2 | 29 (Good) | 36 (Good) | 36 (Good) | 26 (Good) | 62 (Moderate) | 57 (Moderate) | 61 (Moderate) | 60 (Moderate) | 56 (Moderate) | 42 (Moderate) | 31 (Good) | 29 (Good) | 33 (Good) | 49 (Moderate) | 49 (Moderate) | 58 (Moderate) | 70 (Moderate) | 61 (Moderate) | 68 (Moderate) | 65 (Moderate) |
| o3 | 173 (Unhealthy) | 144 (Unhealthy for Sensitive Groups) | 123 (Unhealthy for Sensitive Groups) | 99 (Moderate) | 73 (Moderate) | 53 (Good) | 75 (Moderate) | 123 (Unhealthy for Sensitive Groups) | 174 (Unhealthy) | 162 (Unhealthy) | 225 (Very Unhealthy) | 236 (Very Unhealthy) | 176 (Unhealthy) | 138 (Unhealthy for Sensitive Groups) | 118 (Moderate) | 79 (Moderate) | 59 (Good) | 46 (Good) | 81 (Moderate) | 106 (Moderate) |
| pm10 | 81 (Unhealthy) | 96 (Unhealthy) | 101 (Unhealthy) | 77 (Unhealthy for Sensitive Groups) | 152 (Very bad Hazardous) | 141 (Very Unhealthy) | 146 (Very Unhealthy) | 110 (Very Unhealthy) | 92 (Unhealthy) | 62 (Unhealthy for Sensitive Groups) | 75 (Unhealthy for Sensitive Groups) | 89 (Unhealthy) | 101 (Unhealthy) | 140 (Very Unhealthy) | 138 (Very Unhealthy) | 156 (Very bad Hazardous) | 179 (Very bad Hazardous) | 162 (Very bad Hazardous) | 177 (Very bad Hazardous) | 125 (Very Unhealthy) |
| so2 | 8.5 (Good) | 8.8 (Good) | 8.9 (Good) | 9.5 (Good) | 24 (Good) | 17 (Good) | 12 (Good) | 9.8 (Good) | 12 (Good) | 8.7 (Good) | 7.8 (Good) | 11 (Good) | 8.8 (Good) | 13 (Good) | 11 (Good) | 18 (Good) | 27 (Good) | 22 (Good) | 14 (Good) | 11 (Good) |
PM10 53 (Unhealthy for Sensitive Groups)
particulate matter (PM10) suspended dustO3 0.02 (Good)
ozone (O3)PM2,5 6.6 (Good)
particulate matter (PM2.5) dustSO2 18 (Good)
sulfur dioxide (SO2)NO2 3 (Good)
nitrogen dioxide (NO2)CO 1.3 (Good)
carbon monoxide (CO)省种子仓库
| index | 2022-05-27 |
|---|---|
| pm10 | 51 |
| o3 | 0.02 |
| pm25 | 21 |
| so2 | 9.6 |
| no2 | 0.38 |
| co | 0.64 |
省种子仓库

| index | 2020-05 | 2020-04 | 2020-03 | 2020-02 | 2020-01 | 2019-12 | 2019-11 | 2019-10 | 2019-09 | 2019-08 | 2019-07 | 2019-06 | 2019-05 | 2019-04 | 2019-03 | 2019-02 | 2019-01 | 2018-12 | 2018-11 | 2018-10 |
|---|---|---|---|---|---|---|---|---|---|---|---|---|---|---|---|---|---|---|---|---|
| pm25 | 32 | 42 | 49 | 53 | 113 | 89 | 67 | 50 | 37 | 27 | 36 | 36 | 35 | 54 | 52 | 95 | 97 | 75 | 85 | 42 |
| co | 734 | 662 | 620 | 703 | 1 | 1 | 1 | 776 | 916 | 866 | 709 | 638 | 672 | 820 | 562 | 1 | 1 | 1 | 1 | 814 |
| no2 | 29 | 36 | 36 | 26 | 62 | 57 | 61 | 60 | 56 | 42 | 31 | 29 | 33 | 49 | 49 | 58 | 70 | 61 | 68 | 65 |
| o3 | 173 | 144 | 123 | 99 | 73 | 53 | 75 | 123 | 174 | 162 | 225 | 236 | 176 | 138 | 118 | 79 | 59 | 46 | 81 | 106 |
| pm10 | 81 | 96 | 101 | 77 | 152 | 141 | 146 | 110 | 92 | 62 | 75 | 89 | 101 | 140 | 138 | 156 | 179 | 162 | 177 | 125 |
| so2 | 8.5 | 8.8 | 8.9 | 9.5 | 24 | 17 | 12 | 9.8 | 12 | 8.7 | 7.8 | 11 | 8.8 | 13 | 11 | 18 | 27 | 22 | 14 | 11 |