Air Pollution in Houchawancun: Real-time Air Quality Index and smog alert.
Pollution and air quality forecast for Houchawancun. Today is Tuesday, June 16, 2026. The following air pollution values have been recorded for Houchawancun:- particulate matter (PM10) suspended dust - 53 (Unhealthy for Sensitive Groups)
- ozone (O3) - 0 (Good)
- particulate matter (PM2.5) dust - 7 (Good)
- sulfur dioxide (SO2) - 18 (Good)
- nitrogen dioxide (NO2) - 3 (Good)
- carbon monoxide (CO) - 1 (Good)

What is the air quality in Houchawancun today? Is the air polluted in Houchawancun?. Is there smog?
What is the level of PM10 today in Houchawancun? (particulate matter (PM10) suspended dust)
The current level of particulate matter PM10 in Houchawancun is:
53 (Unhealthy for Sensitive Groups)
The highest PM10 values usually occur in month: 132 (January 2019).
The lowest value of particulate matter PM10 pollution in Houchawancun is usually recorded in: August (35).
How is the O3 level today in Houchawancun? (ozone (O3))
0 (Good)
What is the current level of PM2.5 in Houchawancun? (particulate matter (PM2.5) dust)
Today's PM2.5 level is:
7 (Good)
For comparison, the highest level of PM2.5 in Houchawancun in the last 7 days was: 21 (Friday, May 27, 2022) and the lowest: 21 (Friday, May 27, 2022).
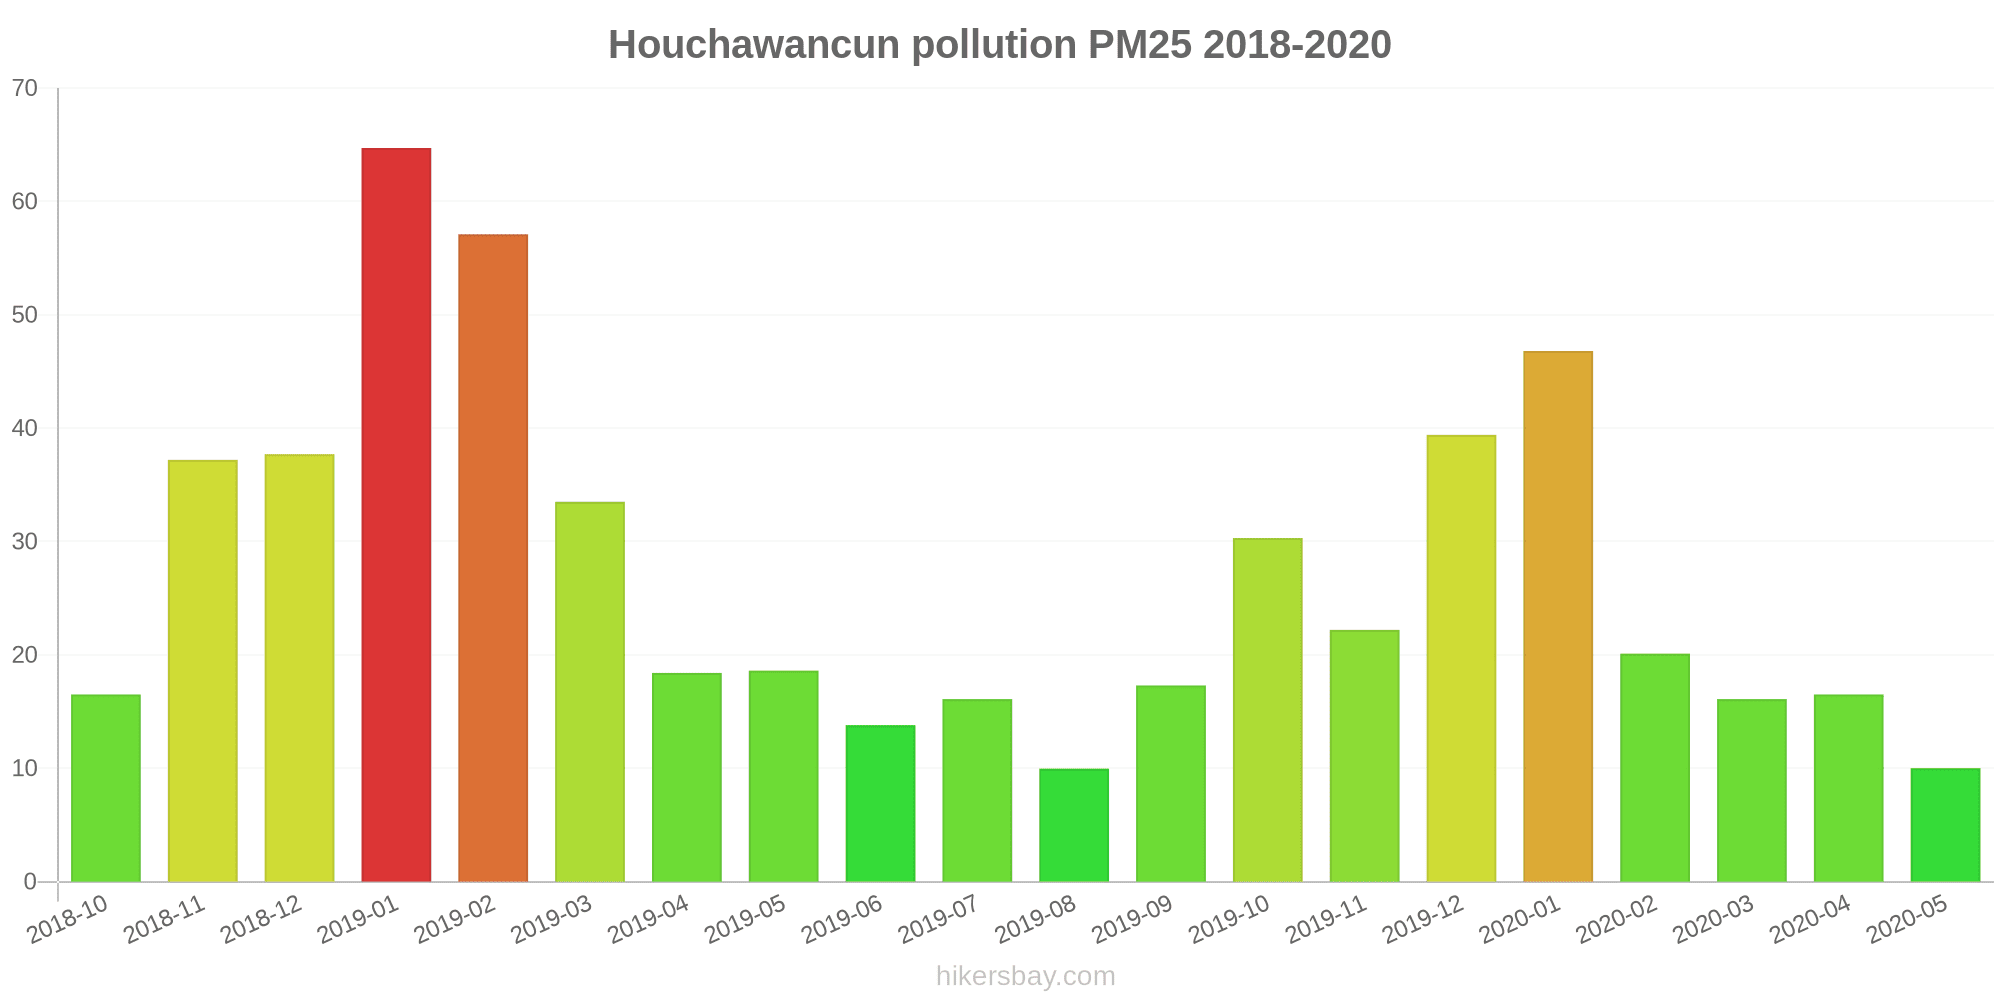
The highest PM2.5 values were recorded: 65 (January 2019).
The lowest level of particulate matter PM2.5 pollution occurs in month: August (10).
What is the level of SO2 pollution? (sulfur dioxide (SO2))
18 (Good)
How high is the level of NO2? (nitrogen dioxide (NO2))
3 (Good)
How high is the CO level? (carbon monoxide (CO))
1 (Good)
Current data Friday, May 27, 2022, 12:00 PM
PM10 53 (Unhealthy for Sensitive Groups)
O3 0 (Good)
PM2,5 7 (Good)
SO2 18 (Good)
NO2 3 (Good)
CO 1 (Good)
Data on air pollution from recent days in Houchawancun
index
2022-05-27
pm10
51
Unhealthy for Sensitive Groups
o3
0
Good
pm25
21
Moderate
so2
10
Good
no2
0
Good
co
1
Good
data source »
Air pollution in Houchawancun from October 2018 to May 2020

index
2020-05
2020-04
2020-03
2020-02
2020-01
2019-12
2019-11
2019-10
2019-09
2019-08
2019-07
2019-06
2019-05
2019-04
2019-03
2019-02
2019-01
2018-12
2018-11
2018-10
pm25
10 (Good)
17 (Moderate)
16 (Moderate)
20 (Moderate)
47 (Unhealthy for Sensitive Groups)
39 (Unhealthy for Sensitive Groups)
22 (Moderate)
30 (Moderate)
17 (Moderate)
10 (Good)
16 (Moderate)
14 (Moderate)
19 (Moderate)
18 (Moderate)
34 (Moderate)
57 (Unhealthy)
65 (Unhealthy)
38 (Unhealthy for Sensitive Groups)
37 (Unhealthy for Sensitive Groups)
17 (Moderate)
co
556 (Good)
643 (Good)
593 (Good)
789 (Good)
979 (Good)
892 (Good)
677 (Good)
803 (Good)
614 (Good)
474 (Good)
634 (Good)
560 (Good)
620 (Good)
584 (Good)
806 (Good)
1 (Good)
1 (Good)
996 (Good)
877 (Good)
583 (Good)
no2
23 (Good)
35 (Good)
28 (Good)
21 (Good)
45 (Moderate)
40 (Moderate)
32 (Good)
38 (Good)
22 (Good)
19 (Good)
22 (Good)
16 (Good)
28 (Good)
25 (Good)
37 (Good)
36 (Good)
53 (Moderate)
41 (Moderate)
40 (Moderate)
37 (Good)
o3
131 (Unhealthy for Sensitive Groups)
138 (Unhealthy for Sensitive Groups)
106 (Moderate)
89 (Moderate)
75 (Moderate)
65 (Good)
87 (Moderate)
127 (Unhealthy for Sensitive Groups)
164 (Unhealthy)
130 (Unhealthy for Sensitive Groups)
139 (Unhealthy for Sensitive Groups)
136 (Unhealthy for Sensitive Groups)
159 (Unhealthy)
120 (Unhealthy for Sensitive Groups)
104 (Moderate)
86 (Moderate)
72 (Moderate)
66 (Good)
101 (Moderate)
115 (Moderate)
pm10
49 (Moderate)
74 (Unhealthy for Sensitive Groups)
65 (Unhealthy for Sensitive Groups)
48 (Moderate)
105 (Unhealthy)
88 (Unhealthy)
78 (Unhealthy for Sensitive Groups)
96 (Unhealthy)
50 (Unhealthy for Sensitive Groups)
35 (Moderate)
40 (Moderate)
36 (Moderate)
67 (Unhealthy for Sensitive Groups)
58 (Unhealthy for Sensitive Groups)
86 (Unhealthy)
109 (Unhealthy)
132 (Very Unhealthy)
95 (Unhealthy)
100 (Unhealthy)
55 (Unhealthy for Sensitive Groups)
so2
5.2 (Good)
7.3 (Good)
5.6 (Good)
4.4 (Good)
10 (Good)
8.1 (Good)
6.5 (Good)
6.9 (Good)
8.2 (Good)
7.4 (Good)
6.2 (Good)
5.8 (Good)
8.1 (Good)
5.6 (Good)
8 (Good)
10 (Good)
16 (Good)
15 (Good)
13 (Good)
12 (Good)
data source »
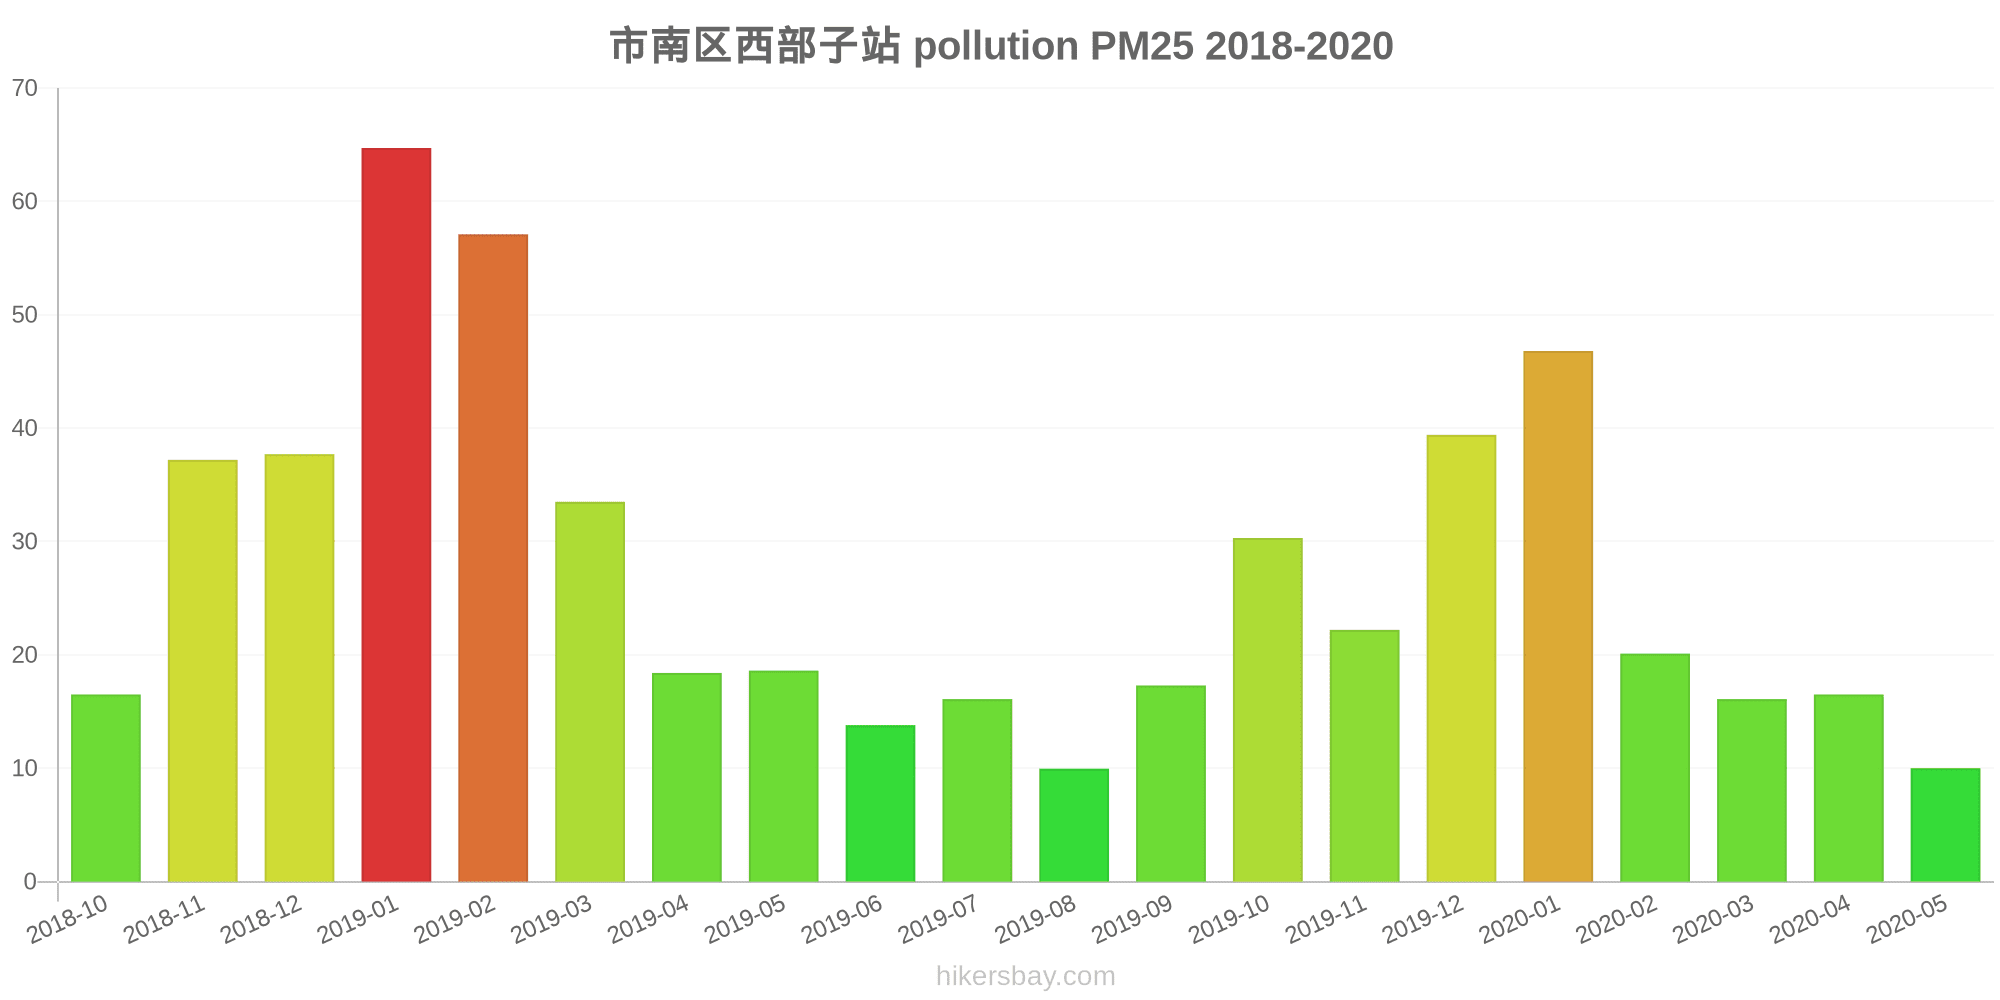
市南区西部子站
Friday, May 27, 2022, 12:00 PM
PM10 53 (Unhealthy for Sensitive Groups)
particulate matter (PM10) suspended dust
O3 0.02 (Good)
ozone (O3)
PM2,5 6.6 (Good)
particulate matter (PM2.5) dust
SO2 18 (Good)
sulfur dioxide (SO2)
NO2 3 (Good)
nitrogen dioxide (NO2)
CO 1.3 (Good)
carbon monoxide (CO)
市南区西部子站
index
2022-05-27
pm10
51
o3
0.02
pm25
21
so2
9.6
no2
0.38
co
0.64
市南区西部子站
2018-10 2020-05

index
2020-05
2020-04
2020-03
2020-02
2020-01
2019-12
2019-11
2019-10
2019-09
2019-08
2019-07
2019-06
2019-05
2019-04
2019-03
2019-02
2019-01
2018-12
2018-11
2018-10
pm25
10
17
16
20
47
39
22
30
17
10
16
14
19
18
34
57
65
38
37
17
co
556
643
593
789
979
892
677
803
614
474
634
560
620
584
806
1
1
996
877
583
no2
23
35
28
21
45
40
32
38
22
19
22
16
28
25
37
36
53
41
40
37
o3
131
138
106
89
75
65
87
127
164
130
139
136
159
120
104
86
72
66
101
115
pm10
49
74
65
48
105
88
78
96
50
35
40
36
67
58
86
109
132
95
100
55
so2
5.2
7.3
5.6
4.4
10
8.1
6.5
6.9
8.2
7.4
6.2
5.8
8.1
5.6
8
10
16
15
13
12
* Pollution data source:
https://openaq.org
(ChinaAQIData)
The data is licensed under CC-By 4.0
PM10 53 (Unhealthy for Sensitive Groups)
O3 0 (Good)
PM2,5 7 (Good)
SO2 18 (Good)
NO2 3 (Good)
CO 1 (Good)
Data on air pollution from recent days in Houchawancun
| index | 2022-05-27 |
|---|---|
| pm10 | 51 Unhealthy for Sensitive Groups |
| o3 | 0 Good |
| pm25 | 21 Moderate |
| so2 | 10 Good |
| no2 | 0 Good |
| co | 1 Good |
| index | 2020-05 | 2020-04 | 2020-03 | 2020-02 | 2020-01 | 2019-12 | 2019-11 | 2019-10 | 2019-09 | 2019-08 | 2019-07 | 2019-06 | 2019-05 | 2019-04 | 2019-03 | 2019-02 | 2019-01 | 2018-12 | 2018-11 | 2018-10 |
|---|---|---|---|---|---|---|---|---|---|---|---|---|---|---|---|---|---|---|---|---|
| pm25 | 10 (Good) | 17 (Moderate) | 16 (Moderate) | 20 (Moderate) | 47 (Unhealthy for Sensitive Groups) | 39 (Unhealthy for Sensitive Groups) | 22 (Moderate) | 30 (Moderate) | 17 (Moderate) | 10 (Good) | 16 (Moderate) | 14 (Moderate) | 19 (Moderate) | 18 (Moderate) | 34 (Moderate) | 57 (Unhealthy) | 65 (Unhealthy) | 38 (Unhealthy for Sensitive Groups) | 37 (Unhealthy for Sensitive Groups) | 17 (Moderate) |
| co | 556 (Good) | 643 (Good) | 593 (Good) | 789 (Good) | 979 (Good) | 892 (Good) | 677 (Good) | 803 (Good) | 614 (Good) | 474 (Good) | 634 (Good) | 560 (Good) | 620 (Good) | 584 (Good) | 806 (Good) | 1 (Good) | 1 (Good) | 996 (Good) | 877 (Good) | 583 (Good) |
| no2 | 23 (Good) | 35 (Good) | 28 (Good) | 21 (Good) | 45 (Moderate) | 40 (Moderate) | 32 (Good) | 38 (Good) | 22 (Good) | 19 (Good) | 22 (Good) | 16 (Good) | 28 (Good) | 25 (Good) | 37 (Good) | 36 (Good) | 53 (Moderate) | 41 (Moderate) | 40 (Moderate) | 37 (Good) |
| o3 | 131 (Unhealthy for Sensitive Groups) | 138 (Unhealthy for Sensitive Groups) | 106 (Moderate) | 89 (Moderate) | 75 (Moderate) | 65 (Good) | 87 (Moderate) | 127 (Unhealthy for Sensitive Groups) | 164 (Unhealthy) | 130 (Unhealthy for Sensitive Groups) | 139 (Unhealthy for Sensitive Groups) | 136 (Unhealthy for Sensitive Groups) | 159 (Unhealthy) | 120 (Unhealthy for Sensitive Groups) | 104 (Moderate) | 86 (Moderate) | 72 (Moderate) | 66 (Good) | 101 (Moderate) | 115 (Moderate) |
| pm10 | 49 (Moderate) | 74 (Unhealthy for Sensitive Groups) | 65 (Unhealthy for Sensitive Groups) | 48 (Moderate) | 105 (Unhealthy) | 88 (Unhealthy) | 78 (Unhealthy for Sensitive Groups) | 96 (Unhealthy) | 50 (Unhealthy for Sensitive Groups) | 35 (Moderate) | 40 (Moderate) | 36 (Moderate) | 67 (Unhealthy for Sensitive Groups) | 58 (Unhealthy for Sensitive Groups) | 86 (Unhealthy) | 109 (Unhealthy) | 132 (Very Unhealthy) | 95 (Unhealthy) | 100 (Unhealthy) | 55 (Unhealthy for Sensitive Groups) |
| so2 | 5.2 (Good) | 7.3 (Good) | 5.6 (Good) | 4.4 (Good) | 10 (Good) | 8.1 (Good) | 6.5 (Good) | 6.9 (Good) | 8.2 (Good) | 7.4 (Good) | 6.2 (Good) | 5.8 (Good) | 8.1 (Good) | 5.6 (Good) | 8 (Good) | 10 (Good) | 16 (Good) | 15 (Good) | 13 (Good) | 12 (Good) |
PM10 53 (Unhealthy for Sensitive Groups)
particulate matter (PM10) suspended dustO3 0.02 (Good)
ozone (O3)PM2,5 6.6 (Good)
particulate matter (PM2.5) dustSO2 18 (Good)
sulfur dioxide (SO2)NO2 3 (Good)
nitrogen dioxide (NO2)CO 1.3 (Good)
carbon monoxide (CO)市南区西部子站
| index | 2022-05-27 |
|---|---|
| pm10 | 51 |
| o3 | 0.02 |
| pm25 | 21 |
| so2 | 9.6 |
| no2 | 0.38 |
| co | 0.64 |
市南区西部子站
| index | 2020-05 | 2020-04 | 2020-03 | 2020-02 | 2020-01 | 2019-12 | 2019-11 | 2019-10 | 2019-09 | 2019-08 | 2019-07 | 2019-06 | 2019-05 | 2019-04 | 2019-03 | 2019-02 | 2019-01 | 2018-12 | 2018-11 | 2018-10 |
|---|---|---|---|---|---|---|---|---|---|---|---|---|---|---|---|---|---|---|---|---|
| pm25 | 10 | 17 | 16 | 20 | 47 | 39 | 22 | 30 | 17 | 10 | 16 | 14 | 19 | 18 | 34 | 57 | 65 | 38 | 37 | 17 |
| co | 556 | 643 | 593 | 789 | 979 | 892 | 677 | 803 | 614 | 474 | 634 | 560 | 620 | 584 | 806 | 1 | 1 | 996 | 877 | 583 |
| no2 | 23 | 35 | 28 | 21 | 45 | 40 | 32 | 38 | 22 | 19 | 22 | 16 | 28 | 25 | 37 | 36 | 53 | 41 | 40 | 37 |
| o3 | 131 | 138 | 106 | 89 | 75 | 65 | 87 | 127 | 164 | 130 | 139 | 136 | 159 | 120 | 104 | 86 | 72 | 66 | 101 | 115 |
| pm10 | 49 | 74 | 65 | 48 | 105 | 88 | 78 | 96 | 50 | 35 | 40 | 36 | 67 | 58 | 86 | 109 | 132 | 95 | 100 | 55 |
| so2 | 5.2 | 7.3 | 5.6 | 4.4 | 10 | 8.1 | 6.5 | 6.9 | 8.2 | 7.4 | 6.2 | 5.8 | 8.1 | 5.6 | 8 | 10 | 16 | 15 | 13 | 12 |