Air Pollution in Huxi: Real-time Air Quality Index and smog alert.
Pollution and air quality forecast for Huxi. Today is Tuesday, June 16, 2026. The following air pollution values have been recorded for Huxi:- particulate matter (PM10) suspended dust - 179 (Very bad Hazardous)
- particulate matter (PM2.5) dust - 35 (Unhealthy for Sensitive Groups)
- ozone (O3) - 0 (Good)
- nitrogen dioxide (NO2) - 0 (Good)
- sulfur dioxide (SO2) - 0 (Good)

What is the air quality in Huxi today? Is the air polluted in Huxi?. Is there smog?
What is the level of PM10 today in Huxi? (particulate matter (PM10) suspended dust)
The current level of particulate matter PM10 in Huxi is:
179 (Very bad Hazardous)
The highest PM10 values usually occur in month: 110 (January 2019).
The lowest value of particulate matter PM10 pollution in Huxi is usually recorded in: July (31).
What is the current level of PM2.5 in Huxi? (particulate matter (PM2.5) dust)
Today's PM2.5 level is:
35 (Unhealthy for Sensitive Groups)
For comparison, the highest level of PM2.5 in Huxi in the last 7 days was: 56 (Friday, May 27, 2022) and the lowest: 56 (Friday, May 27, 2022).
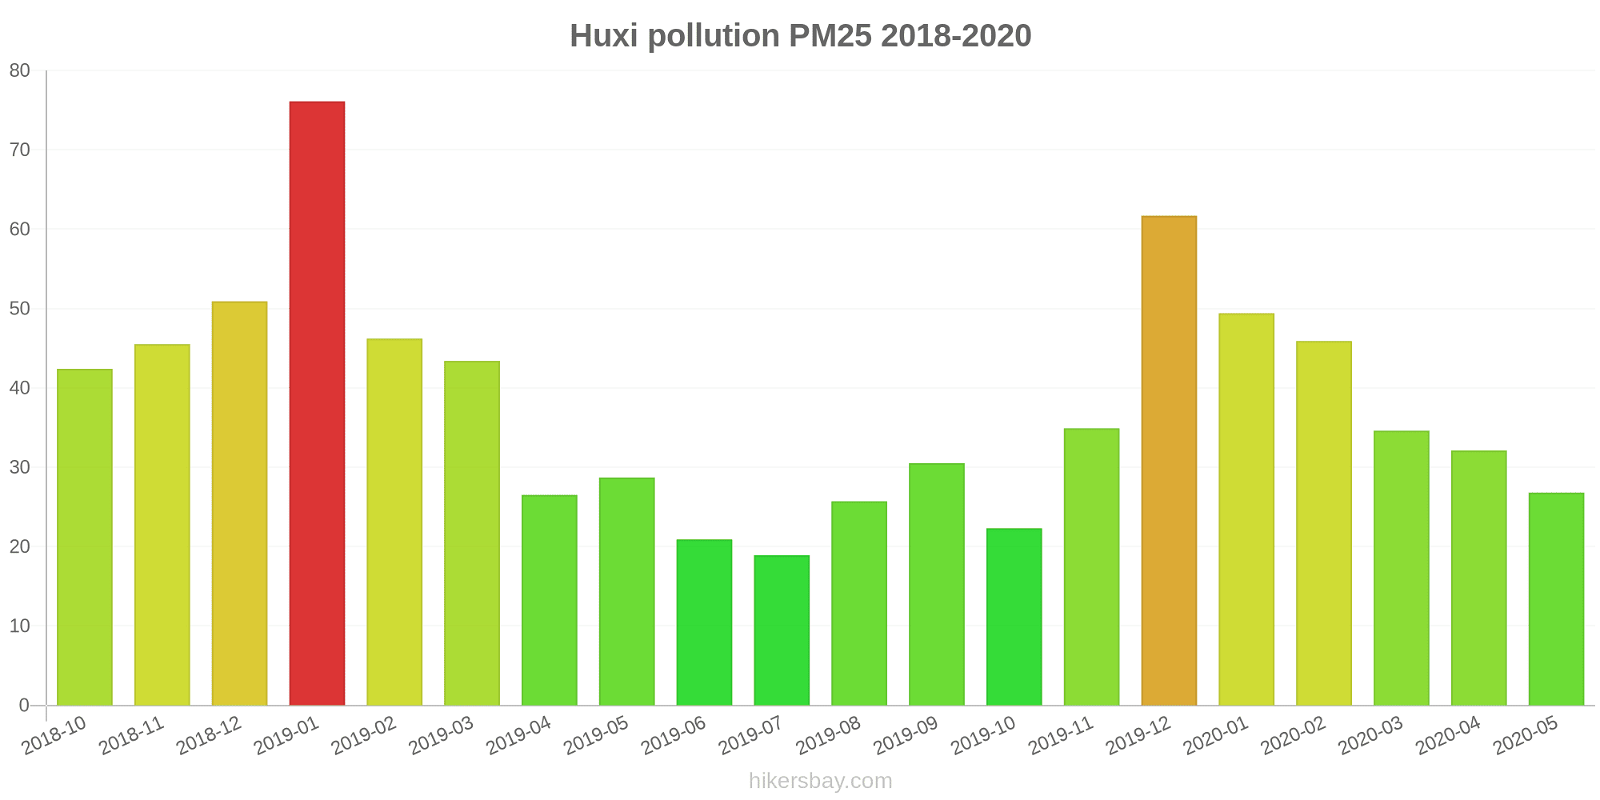
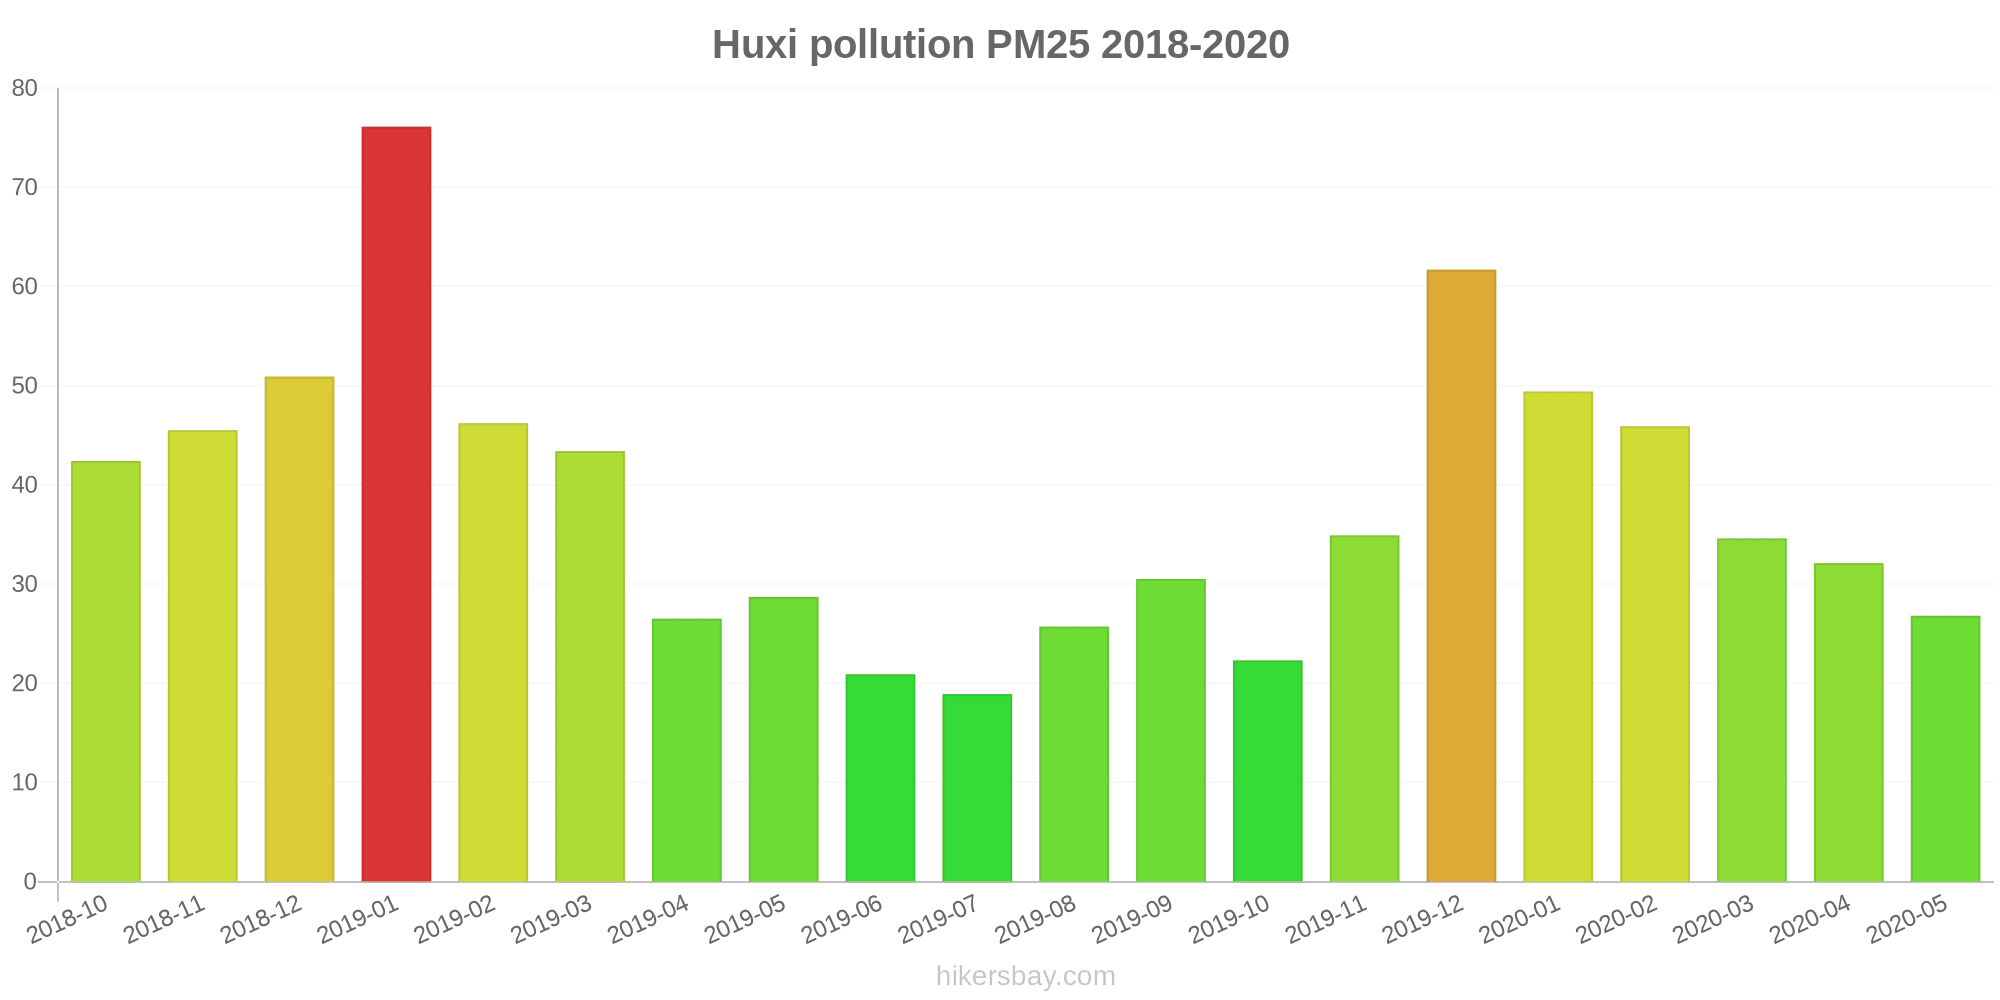
The highest PM2.5 values were recorded: 76 (January 2019).
The lowest level of particulate matter PM2.5 pollution occurs in month: July (19).
How is the O3 level today in Huxi? (ozone (O3))
0 (Good)
How high is the level of NO2? (nitrogen dioxide (NO2))
0 (Good)
What is the level of SO2 pollution? (sulfur dioxide (SO2))
0 (Good)
Current data Friday, May 27, 2022, 12:00 PM
PM10 179 (Very bad Hazardous)
PM2,5 35 (Unhealthy for Sensitive Groups)
O3 0 (Good)
NO2 0 (Good)
SO2 0 (Good)
Data on air pollution from recent days in Huxi
index
2022-05-27
pm10
56
Unhealthy for Sensitive Groups
pm25
56
Unhealthy
o3
0
Good
no2
0
Good
so2
0
Good
data source »
Air pollution in Huxi from October 2018 to May 2020
index
2020-05
2020-04
2020-03
2020-02
2020-01
2019-12
2019-11
2019-10
2019-09
2019-08
2019-07
2019-06
2019-05
2019-04
2019-03
2019-02
2019-01
2018-12
2018-11
2018-10
pm25
27 (Moderate)
32 (Moderate)
35 (Moderate)
46 (Unhealthy for Sensitive Groups)
49 (Unhealthy for Sensitive Groups)
62 (Unhealthy)
35 (Moderate)
22 (Moderate)
31 (Moderate)
26 (Moderate)
19 (Moderate)
21 (Moderate)
29 (Moderate)
27 (Moderate)
43 (Unhealthy for Sensitive Groups)
46 (Unhealthy for Sensitive Groups)
76 (Very Unhealthy)
51 (Unhealthy for Sensitive Groups)
46 (Unhealthy for Sensitive Groups)
42 (Unhealthy for Sensitive Groups)
co
855 (Good)
835 (Good)
764 (Good)
663 (Good)
736 (Good)
846 (Good)
809 (Good)
830 (Good)
742 (Good)
636 (Good)
722 (Good)
876 (Good)
727 (Good)
774 (Good)
735 (Good)
710 (Good)
1 (Good)
900 (Good)
904 (Good)
923 (Good)
no2
38 (Good)
44 (Moderate)
36 (Good)
21 (Good)
35 (Good)
44 (Moderate)
40 (Good)
33 (Good)
36 (Good)
31 (Good)
30 (Good)
29 (Good)
31 (Good)
38 (Good)
46 (Moderate)
32 (Good)
49 (Moderate)
46 (Moderate)
39 (Good)
40 (Good)
o3
198 (Very Unhealthy)
109 (Moderate)
89 (Moderate)
66 (Good)
47 (Good)
37 (Good)
43 (Good)
76 (Moderate)
140 (Unhealthy for Sensitive Groups)
203 (Very Unhealthy)
152 (Unhealthy)
126 (Unhealthy for Sensitive Groups)
117 (Moderate)
150 (Unhealthy)
90 (Moderate)
64 (Good)
37 (Good)
23 (Good)
43 (Good)
42 (Good)
pm10
50 (Unhealthy for Sensitive Groups)
53 (Unhealthy for Sensitive Groups)
54 (Unhealthy for Sensitive Groups)
59 (Unhealthy for Sensitive Groups)
71 (Unhealthy for Sensitive Groups)
84 (Unhealthy)
52 (Unhealthy for Sensitive Groups)
32 (Moderate)
43 (Moderate)
37 (Moderate)
31 (Moderate)
37 (Moderate)
54 (Unhealthy for Sensitive Groups)
59 (Unhealthy for Sensitive Groups)
76 (Unhealthy for Sensitive Groups)
66 (Unhealthy for Sensitive Groups)
110 (Very Unhealthy)
76 (Unhealthy for Sensitive Groups)
70 (Unhealthy for Sensitive Groups)
67 (Unhealthy for Sensitive Groups)
so2
8.2 (Good)
8.6 (Good)
7.7 (Good)
5.8 (Good)
8.1 (Good)
8.6 (Good)
7.2 (Good)
6 (Good)
7.1 (Good)
7.4 (Good)
5.8 (Good)
5.8 (Good)
5.9 (Good)
7.1 (Good)
8.6 (Good)
7.1 (Good)
8.7 (Good)
8.1 (Good)
8.3 (Good)
7.5 (Good)
data source »
虎溪
Friday, May 27, 2022, 12:00 PM
PM10 179 (Very bad Hazardous)
particulate matter (PM10) suspended dust
PM2,5 35 (Unhealthy for Sensitive Groups)
particulate matter (PM2.5) dust
O3 0.04 (Good)
ozone (O3)
NO2 0 (Good)
nitrogen dioxide (NO2)
SO2 0 (Good)
sulfur dioxide (SO2)
虎溪
index
2022-05-27
pm10
56
pm25
56
o3
0.03
no2
0
so2
0
虎溪
2018-10 2020-05

index
2020-05
2020-04
2020-03
2020-02
2020-01
2019-12
2019-11
2019-10
2019-09
2019-08
2019-07
2019-06
2019-05
2019-04
2019-03
2019-02
2019-01
2018-12
2018-11
2018-10
pm25
27
32
35
46
49
62
35
22
31
26
19
21
29
27
43
46
76
51
46
42
co
855
835
764
663
736
846
809
830
742
636
722
876
727
774
735
710
1
900
904
923
no2
38
44
36
21
35
44
40
33
36
31
30
29
31
38
46
32
49
46
39
40
o3
198
109
89
66
47
37
43
76
140
203
152
126
117
150
90
64
37
23
43
42
pm10
50
53
54
59
71
84
52
32
43
37
31
37
54
59
76
66
110
76
70
67
so2
8.2
8.6
7.7
5.8
8.1
8.6
7.2
6
7.1
7.4
5.8
5.8
5.9
7.1
8.6
7.1
8.7
8.1
8.3
7.5
* Pollution data source:
https://openaq.org
(ChinaAQIData)
The data is licensed under CC-By 4.0
PM10 179 (Very bad Hazardous)
PM2,5 35 (Unhealthy for Sensitive Groups)
O3 0 (Good)
NO2 0 (Good)
SO2 0 (Good)
Data on air pollution from recent days in Huxi
| index | 2022-05-27 |
|---|---|
| pm10 | 56 Unhealthy for Sensitive Groups |
| pm25 | 56 Unhealthy |
| o3 | 0 Good |
| no2 | 0 Good |
| so2 | 0 Good |
| index | 2020-05 | 2020-04 | 2020-03 | 2020-02 | 2020-01 | 2019-12 | 2019-11 | 2019-10 | 2019-09 | 2019-08 | 2019-07 | 2019-06 | 2019-05 | 2019-04 | 2019-03 | 2019-02 | 2019-01 | 2018-12 | 2018-11 | 2018-10 |
|---|---|---|---|---|---|---|---|---|---|---|---|---|---|---|---|---|---|---|---|---|
| pm25 | 27 (Moderate) | 32 (Moderate) | 35 (Moderate) | 46 (Unhealthy for Sensitive Groups) | 49 (Unhealthy for Sensitive Groups) | 62 (Unhealthy) | 35 (Moderate) | 22 (Moderate) | 31 (Moderate) | 26 (Moderate) | 19 (Moderate) | 21 (Moderate) | 29 (Moderate) | 27 (Moderate) | 43 (Unhealthy for Sensitive Groups) | 46 (Unhealthy for Sensitive Groups) | 76 (Very Unhealthy) | 51 (Unhealthy for Sensitive Groups) | 46 (Unhealthy for Sensitive Groups) | 42 (Unhealthy for Sensitive Groups) |
| co | 855 (Good) | 835 (Good) | 764 (Good) | 663 (Good) | 736 (Good) | 846 (Good) | 809 (Good) | 830 (Good) | 742 (Good) | 636 (Good) | 722 (Good) | 876 (Good) | 727 (Good) | 774 (Good) | 735 (Good) | 710 (Good) | 1 (Good) | 900 (Good) | 904 (Good) | 923 (Good) |
| no2 | 38 (Good) | 44 (Moderate) | 36 (Good) | 21 (Good) | 35 (Good) | 44 (Moderate) | 40 (Good) | 33 (Good) | 36 (Good) | 31 (Good) | 30 (Good) | 29 (Good) | 31 (Good) | 38 (Good) | 46 (Moderate) | 32 (Good) | 49 (Moderate) | 46 (Moderate) | 39 (Good) | 40 (Good) |
| o3 | 198 (Very Unhealthy) | 109 (Moderate) | 89 (Moderate) | 66 (Good) | 47 (Good) | 37 (Good) | 43 (Good) | 76 (Moderate) | 140 (Unhealthy for Sensitive Groups) | 203 (Very Unhealthy) | 152 (Unhealthy) | 126 (Unhealthy for Sensitive Groups) | 117 (Moderate) | 150 (Unhealthy) | 90 (Moderate) | 64 (Good) | 37 (Good) | 23 (Good) | 43 (Good) | 42 (Good) |
| pm10 | 50 (Unhealthy for Sensitive Groups) | 53 (Unhealthy for Sensitive Groups) | 54 (Unhealthy for Sensitive Groups) | 59 (Unhealthy for Sensitive Groups) | 71 (Unhealthy for Sensitive Groups) | 84 (Unhealthy) | 52 (Unhealthy for Sensitive Groups) | 32 (Moderate) | 43 (Moderate) | 37 (Moderate) | 31 (Moderate) | 37 (Moderate) | 54 (Unhealthy for Sensitive Groups) | 59 (Unhealthy for Sensitive Groups) | 76 (Unhealthy for Sensitive Groups) | 66 (Unhealthy for Sensitive Groups) | 110 (Very Unhealthy) | 76 (Unhealthy for Sensitive Groups) | 70 (Unhealthy for Sensitive Groups) | 67 (Unhealthy for Sensitive Groups) |
| so2 | 8.2 (Good) | 8.6 (Good) | 7.7 (Good) | 5.8 (Good) | 8.1 (Good) | 8.6 (Good) | 7.2 (Good) | 6 (Good) | 7.1 (Good) | 7.4 (Good) | 5.8 (Good) | 5.8 (Good) | 5.9 (Good) | 7.1 (Good) | 8.6 (Good) | 7.1 (Good) | 8.7 (Good) | 8.1 (Good) | 8.3 (Good) | 7.5 (Good) |
PM10 179 (Very bad Hazardous)
particulate matter (PM10) suspended dustPM2,5 35 (Unhealthy for Sensitive Groups)
particulate matter (PM2.5) dustO3 0.04 (Good)
ozone (O3)NO2 0 (Good)
nitrogen dioxide (NO2)SO2 0 (Good)
sulfur dioxide (SO2)虎溪
| index | 2022-05-27 |
|---|---|
| pm10 | 56 |
| pm25 | 56 |
| o3 | 0.03 |
| no2 | 0 |
| so2 | 0 |
虎溪

| index | 2020-05 | 2020-04 | 2020-03 | 2020-02 | 2020-01 | 2019-12 | 2019-11 | 2019-10 | 2019-09 | 2019-08 | 2019-07 | 2019-06 | 2019-05 | 2019-04 | 2019-03 | 2019-02 | 2019-01 | 2018-12 | 2018-11 | 2018-10 |
|---|---|---|---|---|---|---|---|---|---|---|---|---|---|---|---|---|---|---|---|---|
| pm25 | 27 | 32 | 35 | 46 | 49 | 62 | 35 | 22 | 31 | 26 | 19 | 21 | 29 | 27 | 43 | 46 | 76 | 51 | 46 | 42 |
| co | 855 | 835 | 764 | 663 | 736 | 846 | 809 | 830 | 742 | 636 | 722 | 876 | 727 | 774 | 735 | 710 | 1 | 900 | 904 | 923 |
| no2 | 38 | 44 | 36 | 21 | 35 | 44 | 40 | 33 | 36 | 31 | 30 | 29 | 31 | 38 | 46 | 32 | 49 | 46 | 39 | 40 |
| o3 | 198 | 109 | 89 | 66 | 47 | 37 | 43 | 76 | 140 | 203 | 152 | 126 | 117 | 150 | 90 | 64 | 37 | 23 | 43 | 42 |
| pm10 | 50 | 53 | 54 | 59 | 71 | 84 | 52 | 32 | 43 | 37 | 31 | 37 | 54 | 59 | 76 | 66 | 110 | 76 | 70 | 67 |
| so2 | 8.2 | 8.6 | 7.7 | 5.8 | 8.1 | 8.6 | 7.2 | 6 | 7.1 | 7.4 | 5.8 | 5.8 | 5.9 | 7.1 | 8.6 | 7.1 | 8.7 | 8.1 | 8.3 | 7.5 |