Air Pollution in Jinsheng: Real-time Air Quality Index and smog alert.
Pollution and air quality forecast for Jinsheng. Today is Tuesday, June 16, 2026. The following air pollution values have been recorded for Jinsheng:- particulate matter (PM2.5) dust - 61 (Unhealthy)
- nitrogen dioxide (NO2) - 22 (Good)
- particulate matter (PM10) suspended dust - 69 (Unhealthy for Sensitive Groups)
- carbon monoxide (CO) - 219 (Good)
- ozone (O3) - 0 (Good)
- sulfur dioxide (SO2) - 8 (Good)

What is the air quality in Jinsheng today? Is the air polluted in Jinsheng?. Is there smog?
What is the current level of PM2.5 in Jinsheng? (particulate matter (PM2.5) dust)
Today's PM2.5 level is:
61 (Unhealthy)
For comparison, the highest level of PM2.5 in Jinsheng in the last 7 days was: 28 (Friday, May 27, 2022) and the lowest: 28 (Friday, May 27, 2022).
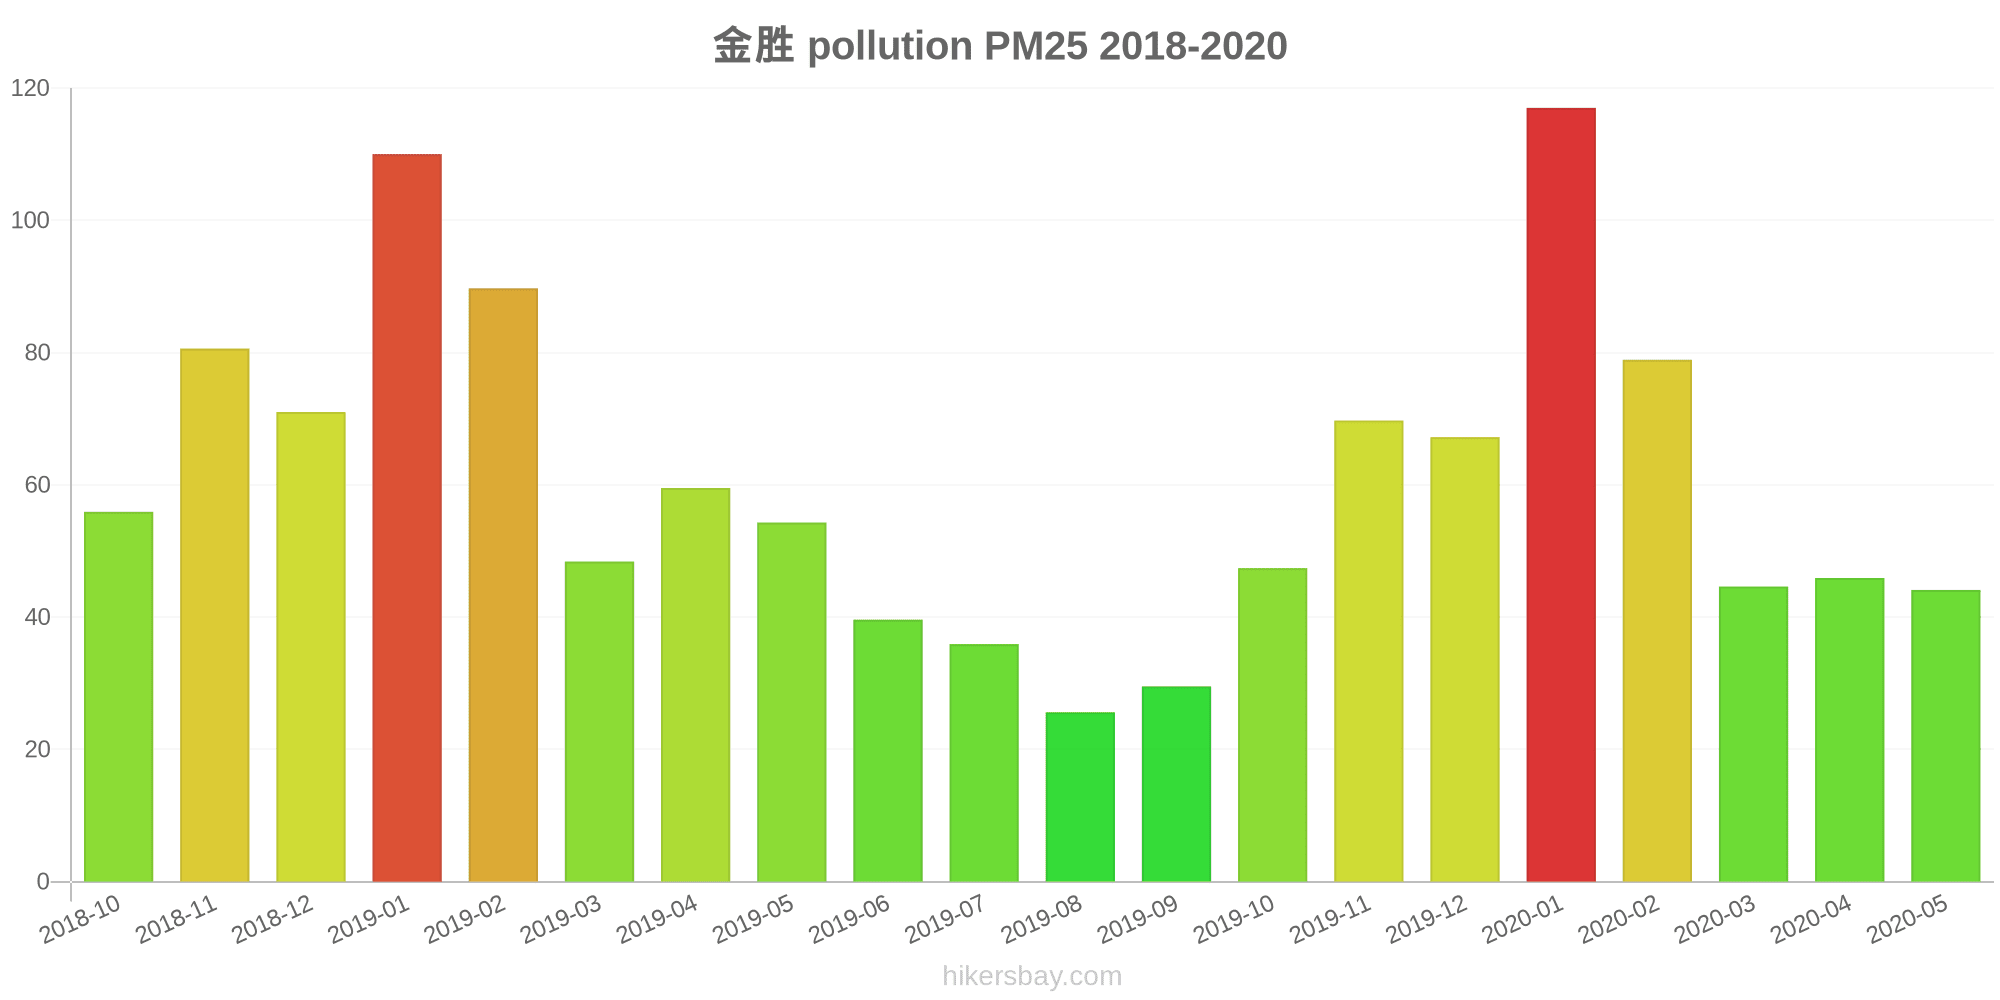
The highest PM2.5 values were recorded: 117 (January 2020).
The lowest level of particulate matter PM2.5 pollution occurs in month: August (26).
How high is the level of NO2? (nitrogen dioxide (NO2))
22 (Good)
What is the level of PM10 today in Jinsheng? (particulate matter (PM10) suspended dust)
The current level of particulate matter PM10 in Jinsheng is:
69 (Unhealthy for Sensitive Groups)
The highest PM10 values usually occur in month: 206 (November 2018).
The lowest value of particulate matter PM10 pollution in Jinsheng is usually recorded in: August (48).
How high is the CO level? (carbon monoxide (CO))
219 (Good)
How is the O3 level today in Jinsheng? (ozone (O3))
0 (Good)
What is the level of SO2 pollution? (sulfur dioxide (SO2))
8 (Good)
Current data Friday, May 27, 2022, 3:00 PM
PM2,5 61 (Unhealthy)
NO2 22 (Good)
PM10 69 (Unhealthy for Sensitive Groups)
CO 219 (Good)
O3 0 (Good)
SO2 8 (Good)
Data on air pollution from recent days in Jinsheng
index
2022-05-27
pm25
28
Moderate
no2
22
Good
pm10
35
Moderate
co
579
Good
o3
22
Good
so2
5
Good
data source »
Air pollution in Jinsheng from October 2018 to May 2020

index
2020-05
2020-04
2020-03
2020-02
2020-01
2019-12
2019-11
2019-10
2019-09
2019-08
2019-07
2019-06
2019-05
2019-04
2019-03
2019-02
2019-01
2018-12
2018-11
2018-10
pm25
44 (Unhealthy for Sensitive Groups)
46 (Unhealthy for Sensitive Groups)
45 (Unhealthy for Sensitive Groups)
79 (Very Unhealthy)
117 (Very bad Hazardous)
67 (Unhealthy)
70 (Unhealthy)
47 (Unhealthy for Sensitive Groups)
30 (Moderate)
26 (Moderate)
36 (Unhealthy for Sensitive Groups)
40 (Unhealthy for Sensitive Groups)
54 (Unhealthy for Sensitive Groups)
60 (Unhealthy)
48 (Unhealthy for Sensitive Groups)
90 (Very Unhealthy)
110 (Very bad Hazardous)
71 (Unhealthy)
81 (Very Unhealthy)
56 (Unhealthy)
co
634 (Good)
651 (Good)
704 (Good)
1 (Good)
1 (Good)
1 (Good)
1 (Good)
990 (Good)
850 (Good)
721 (Good)
884 (Good)
844 (Good)
837 (Good)
949 (Good)
973 (Good)
1 (Good)
2 (Good)
1 (Good)
1 (Good)
1 (Good)
no2
41 (Moderate)
47 (Moderate)
40 (Moderate)
36 (Good)
56 (Moderate)
56 (Moderate)
59 (Moderate)
53 (Moderate)
46 (Moderate)
33 (Good)
35 (Good)
43 (Moderate)
52 (Moderate)
51 (Moderate)
44 (Moderate)
45 (Moderate)
75 (Moderate)
63 (Moderate)
70 (Moderate)
57 (Moderate)
o3
163 (Unhealthy)
134 (Unhealthy for Sensitive Groups)
109 (Moderate)
92 (Moderate)
69 (Good)
53 (Good)
64 (Good)
96 (Moderate)
149 (Unhealthy for Sensitive Groups)
153 (Unhealthy)
204 (Very Unhealthy)
215 (Very Unhealthy)
162 (Unhealthy)
126 (Unhealthy for Sensitive Groups)
115 (Moderate)
91 (Moderate)
48 (Good)
45 (Good)
63 (Good)
94 (Moderate)
pm10
104 (Unhealthy)
97 (Unhealthy)
89 (Unhealthy)
109 (Unhealthy)
154 (Very bad Hazardous)
108 (Unhealthy)
122 (Very Unhealthy)
99 (Unhealthy)
62 (Unhealthy for Sensitive Groups)
48 (Moderate)
55 (Unhealthy for Sensitive Groups)
71 (Unhealthy for Sensitive Groups)
147 (Very Unhealthy)
157 (Very bad Hazardous)
128 (Very Unhealthy)
148 (Very Unhealthy)
202 (Very bad Hazardous)
203 (Very bad Hazardous)
206 (Very bad Hazardous)
153 (Very bad Hazardous)
so2
12 (Good)
12 (Good)
17 (Good)
26 (Good)
31 (Good)
30 (Good)
22 (Good)
12 (Good)
9.5 (Good)
7.5 (Good)
7.5 (Good)
12 (Good)
15 (Good)
16 (Good)
22 (Good)
39 (Good)
64 (Moderate)
47 (Good)
34 (Good)
17 (Good)
data source »
金胜
Friday, May 27, 2022, 3:00 PM
PM2,5 61 (Unhealthy)
particulate matter (PM2.5) dust
NO2 22 (Good)
nitrogen dioxide (NO2)
PM10 69 (Unhealthy for Sensitive Groups)
particulate matter (PM10) suspended dust
CO 219 (Good)
carbon monoxide (CO)
O3 0.05 (Good)
ozone (O3)
SO2 7.7 (Good)
sulfur dioxide (SO2)
金胜
index
2022-05-27
pm25
28
no2
22
pm10
35
co
579
o3
22
so2
4.6
金胜
2018-10 2020-05

index
2020-05
2020-04
2020-03
2020-02
2020-01
2019-12
2019-11
2019-10
2019-09
2019-08
2019-07
2019-06
2019-05
2019-04
2019-03
2019-02
2019-01
2018-12
2018-11
2018-10
pm25
44
46
45
79
117
67
70
47
30
26
36
40
54
60
48
90
110
71
81
56
co
634
651
704
1
1
1
1
990
850
721
884
844
837
949
973
1
2
1
1
1
no2
41
47
40
36
56
56
59
53
46
33
35
43
52
51
44
45
75
63
70
57
o3
163
134
109
92
69
53
64
96
149
153
204
215
162
126
115
91
48
45
63
94
pm10
104
97
89
109
154
108
122
99
62
48
55
71
147
157
128
148
202
203
206
153
so2
12
12
17
26
31
30
22
12
9.5
7.5
7.5
12
15
16
22
39
64
47
34
17
* Pollution data source:
https://openaq.org
(ChinaAQIData)
The data is licensed under CC-By 4.0
PM2,5 61 (Unhealthy)
NO2 22 (Good)
PM10 69 (Unhealthy for Sensitive Groups)
CO 219 (Good)
O3 0 (Good)
SO2 8 (Good)
Data on air pollution from recent days in Jinsheng
| index | 2022-05-27 |
|---|---|
| pm25 | 28 Moderate |
| no2 | 22 Good |
| pm10 | 35 Moderate |
| co | 579 Good |
| o3 | 22 Good |
| so2 | 5 Good |

| index | 2020-05 | 2020-04 | 2020-03 | 2020-02 | 2020-01 | 2019-12 | 2019-11 | 2019-10 | 2019-09 | 2019-08 | 2019-07 | 2019-06 | 2019-05 | 2019-04 | 2019-03 | 2019-02 | 2019-01 | 2018-12 | 2018-11 | 2018-10 |
|---|---|---|---|---|---|---|---|---|---|---|---|---|---|---|---|---|---|---|---|---|
| pm25 | 44 (Unhealthy for Sensitive Groups) | 46 (Unhealthy for Sensitive Groups) | 45 (Unhealthy for Sensitive Groups) | 79 (Very Unhealthy) | 117 (Very bad Hazardous) | 67 (Unhealthy) | 70 (Unhealthy) | 47 (Unhealthy for Sensitive Groups) | 30 (Moderate) | 26 (Moderate) | 36 (Unhealthy for Sensitive Groups) | 40 (Unhealthy for Sensitive Groups) | 54 (Unhealthy for Sensitive Groups) | 60 (Unhealthy) | 48 (Unhealthy for Sensitive Groups) | 90 (Very Unhealthy) | 110 (Very bad Hazardous) | 71 (Unhealthy) | 81 (Very Unhealthy) | 56 (Unhealthy) |
| co | 634 (Good) | 651 (Good) | 704 (Good) | 1 (Good) | 1 (Good) | 1 (Good) | 1 (Good) | 990 (Good) | 850 (Good) | 721 (Good) | 884 (Good) | 844 (Good) | 837 (Good) | 949 (Good) | 973 (Good) | 1 (Good) | 2 (Good) | 1 (Good) | 1 (Good) | 1 (Good) |
| no2 | 41 (Moderate) | 47 (Moderate) | 40 (Moderate) | 36 (Good) | 56 (Moderate) | 56 (Moderate) | 59 (Moderate) | 53 (Moderate) | 46 (Moderate) | 33 (Good) | 35 (Good) | 43 (Moderate) | 52 (Moderate) | 51 (Moderate) | 44 (Moderate) | 45 (Moderate) | 75 (Moderate) | 63 (Moderate) | 70 (Moderate) | 57 (Moderate) |
| o3 | 163 (Unhealthy) | 134 (Unhealthy for Sensitive Groups) | 109 (Moderate) | 92 (Moderate) | 69 (Good) | 53 (Good) | 64 (Good) | 96 (Moderate) | 149 (Unhealthy for Sensitive Groups) | 153 (Unhealthy) | 204 (Very Unhealthy) | 215 (Very Unhealthy) | 162 (Unhealthy) | 126 (Unhealthy for Sensitive Groups) | 115 (Moderate) | 91 (Moderate) | 48 (Good) | 45 (Good) | 63 (Good) | 94 (Moderate) |
| pm10 | 104 (Unhealthy) | 97 (Unhealthy) | 89 (Unhealthy) | 109 (Unhealthy) | 154 (Very bad Hazardous) | 108 (Unhealthy) | 122 (Very Unhealthy) | 99 (Unhealthy) | 62 (Unhealthy for Sensitive Groups) | 48 (Moderate) | 55 (Unhealthy for Sensitive Groups) | 71 (Unhealthy for Sensitive Groups) | 147 (Very Unhealthy) | 157 (Very bad Hazardous) | 128 (Very Unhealthy) | 148 (Very Unhealthy) | 202 (Very bad Hazardous) | 203 (Very bad Hazardous) | 206 (Very bad Hazardous) | 153 (Very bad Hazardous) |
| so2 | 12 (Good) | 12 (Good) | 17 (Good) | 26 (Good) | 31 (Good) | 30 (Good) | 22 (Good) | 12 (Good) | 9.5 (Good) | 7.5 (Good) | 7.5 (Good) | 12 (Good) | 15 (Good) | 16 (Good) | 22 (Good) | 39 (Good) | 64 (Moderate) | 47 (Good) | 34 (Good) | 17 (Good) |
PM2,5 61 (Unhealthy)
particulate matter (PM2.5) dustNO2 22 (Good)
nitrogen dioxide (NO2)PM10 69 (Unhealthy for Sensitive Groups)
particulate matter (PM10) suspended dustCO 219 (Good)
carbon monoxide (CO)O3 0.05 (Good)
ozone (O3)SO2 7.7 (Good)
sulfur dioxide (SO2)金胜
| index | 2022-05-27 |
|---|---|
| pm25 | 28 |
| no2 | 22 |
| pm10 | 35 |
| co | 579 |
| o3 | 22 |
| so2 | 4.6 |
金胜
| index | 2020-05 | 2020-04 | 2020-03 | 2020-02 | 2020-01 | 2019-12 | 2019-11 | 2019-10 | 2019-09 | 2019-08 | 2019-07 | 2019-06 | 2019-05 | 2019-04 | 2019-03 | 2019-02 | 2019-01 | 2018-12 | 2018-11 | 2018-10 |
|---|---|---|---|---|---|---|---|---|---|---|---|---|---|---|---|---|---|---|---|---|
| pm25 | 44 | 46 | 45 | 79 | 117 | 67 | 70 | 47 | 30 | 26 | 36 | 40 | 54 | 60 | 48 | 90 | 110 | 71 | 81 | 56 |
| co | 634 | 651 | 704 | 1 | 1 | 1 | 1 | 990 | 850 | 721 | 884 | 844 | 837 | 949 | 973 | 1 | 2 | 1 | 1 | 1 |
| no2 | 41 | 47 | 40 | 36 | 56 | 56 | 59 | 53 | 46 | 33 | 35 | 43 | 52 | 51 | 44 | 45 | 75 | 63 | 70 | 57 |
| o3 | 163 | 134 | 109 | 92 | 69 | 53 | 64 | 96 | 149 | 153 | 204 | 215 | 162 | 126 | 115 | 91 | 48 | 45 | 63 | 94 |
| pm10 | 104 | 97 | 89 | 109 | 154 | 108 | 122 | 99 | 62 | 48 | 55 | 71 | 147 | 157 | 128 | 148 | 202 | 203 | 206 | 153 |
| so2 | 12 | 12 | 17 | 26 | 31 | 30 | 22 | 12 | 9.5 | 7.5 | 7.5 | 12 | 15 | 16 | 22 | 39 | 64 | 47 | 34 | 17 |