Air Pollution in Jintan: Real-time Air Quality Index and smog alert.
Pollution and air quality forecast for Jintan. Today is Tuesday, June 2, 2026. The following air pollution values have been recorded for Jintan:- particulate matter (PM10) suspended dust - 179 (Very bad Hazardous)
- particulate matter (PM2.5) dust - 35 (Unhealthy for Sensitive Groups)
- ozone (O3) - 0 (Good)
- nitrogen dioxide (NO2) - 0 (Good)
- sulfur dioxide (SO2) - 0 (Good)

What is the air quality in Jintan today? Is the air polluted in Jintan?. Is there smog?
What is the level of PM10 today in Jintan? (particulate matter (PM10) suspended dust)
The current level of particulate matter PM10 in Jintan is:
179 (Very bad Hazardous)
The highest PM10 values usually occur in month: 101 (January 2019).
The lowest value of particulate matter PM10 pollution in Jintan is usually recorded in: September (41).
What is the current level of PM2.5 in Jintan? (particulate matter (PM2.5) dust)
Today's PM2.5 level is:
35 (Unhealthy for Sensitive Groups)
For comparison, the highest level of PM2.5 in Jintan in the last 7 days was: 56 (Friday, May 27, 2022) and the lowest: 56 (Friday, May 27, 2022).
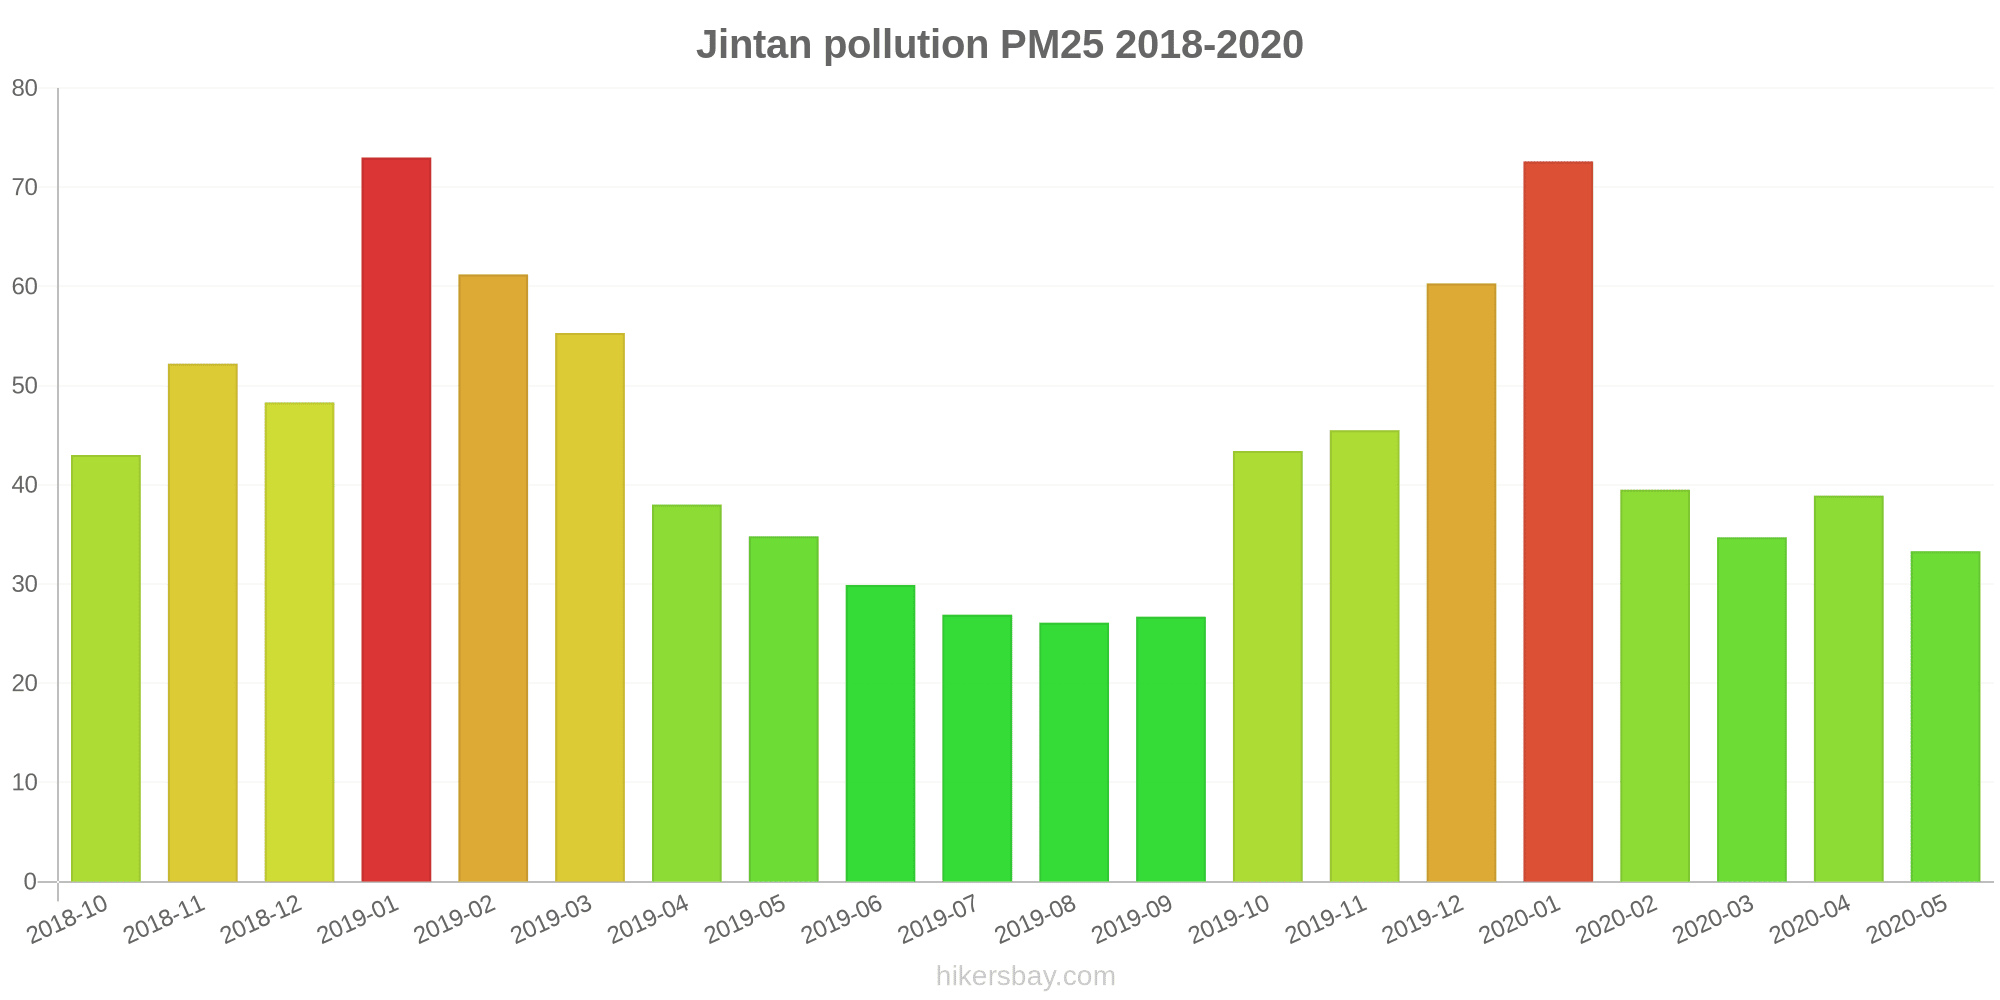
The highest PM2.5 values were recorded: 73 (January 2019).
The lowest level of particulate matter PM2.5 pollution occurs in month: August (26).
How is the O3 level today in Jintan? (ozone (O3))
0 (Good)
How high is the level of NO2? (nitrogen dioxide (NO2))
0 (Good)
What is the level of SO2 pollution? (sulfur dioxide (SO2))
0 (Good)
Current data Friday, May 27, 2022, 12:00 PM
PM10 179 (Very bad Hazardous)
PM2,5 35 (Unhealthy for Sensitive Groups)
O3 0 (Good)
NO2 0 (Good)
SO2 0 (Good)
Data on air pollution from recent days in Jintan
index
2022-05-27
pm10
56
Unhealthy for Sensitive Groups
pm25
56
Unhealthy
o3
0
Good
no2
0
Good
so2
0
Good
data source »
Air pollution in Jintan from October 2018 to May 2020

index
2020-05
2020-04
2020-03
2020-02
2020-01
2019-12
2019-11
2019-10
2019-09
2019-08
2019-07
2019-06
2019-05
2019-04
2019-03
2019-02
2019-01
2018-12
2018-11
2018-10
pm25
33 (Moderate)
39 (Unhealthy for Sensitive Groups)
35 (Moderate)
40 (Unhealthy for Sensitive Groups)
73 (Unhealthy)
60 (Unhealthy)
46 (Unhealthy for Sensitive Groups)
43 (Unhealthy for Sensitive Groups)
27 (Moderate)
26 (Moderate)
27 (Moderate)
30 (Moderate)
35 (Moderate)
38 (Unhealthy for Sensitive Groups)
55 (Unhealthy)
61 (Unhealthy)
73 (Unhealthy)
48 (Unhealthy for Sensitive Groups)
52 (Unhealthy for Sensitive Groups)
43 (Unhealthy for Sensitive Groups)
co
964 (Good)
890 (Good)
881 (Good)
923 (Good)
1 (Good)
1 (Good)
1 (Good)
992 (Good)
1 (Good)
1 (Good)
1 (Good)
929 (Good)
790 (Good)
1 (Good)
984 (Good)
1 (Good)
1 (Good)
1 (Good)
1 (Good)
908 (Good)
no2
30 (Good)
43 (Moderate)
32 (Good)
15 (Good)
25 (Good)
41 (Moderate)
40 (Good)
33 (Good)
26 (Good)
24 (Good)
23 (Good)
26 (Good)
29 (Good)
33 (Good)
38 (Good)
27 (Good)
55 (Moderate)
49 (Moderate)
51 (Moderate)
44 (Moderate)
o3
163 (Unhealthy)
124 (Unhealthy for Sensitive Groups)
94 (Moderate)
71 (Moderate)
49 (Good)
56 (Good)
80 (Moderate)
108 (Moderate)
145 (Unhealthy for Sensitive Groups)
161 (Unhealthy)
148 (Unhealthy for Sensitive Groups)
153 (Unhealthy)
152 (Unhealthy)
133 (Unhealthy for Sensitive Groups)
122 (Unhealthy for Sensitive Groups)
88 (Moderate)
73 (Moderate)
67 (Good)
108 (Moderate)
156 (Unhealthy)
pm10
56 (Unhealthy for Sensitive Groups)
73 (Unhealthy for Sensitive Groups)
58 (Unhealthy for Sensitive Groups)
56 (Unhealthy for Sensitive Groups)
91 (Unhealthy)
89 (Unhealthy)
100 (Unhealthy)
85 (Unhealthy)
41 (Moderate)
43 (Moderate)
44 (Moderate)
50 (Moderate)
64 (Unhealthy for Sensitive Groups)
66 (Unhealthy for Sensitive Groups)
89 (Unhealthy)
82 (Unhealthy)
101 (Unhealthy)
83 (Unhealthy)
83 (Unhealthy)
78 (Unhealthy for Sensitive Groups)
so2
11 (Good)
11 (Good)
8.6 (Good)
6.7 (Good)
7.2 (Good)
9.6 (Good)
10 (Good)
10 (Good)
15 (Good)
14 (Good)
11 (Good)
9.3 (Good)
13 (Good)
11 (Good)
13 (Good)
11 (Good)
14 (Good)
15 (Good)
12 (Good)
14 (Good)
data source »
金坛市环境监测站
Friday, May 27, 2022, 12:00 PM
PM10 179 (Very bad Hazardous)
particulate matter (PM10) suspended dust
PM2,5 35 (Unhealthy for Sensitive Groups)
particulate matter (PM2.5) dust
O3 0.04 (Good)
ozone (O3)
NO2 0 (Good)
nitrogen dioxide (NO2)
SO2 0 (Good)
sulfur dioxide (SO2)
金坛市环境监测站
index
2022-05-27
pm10
56
pm25
56
o3
0.03
no2
0
so2
0
金坛市环境监测站
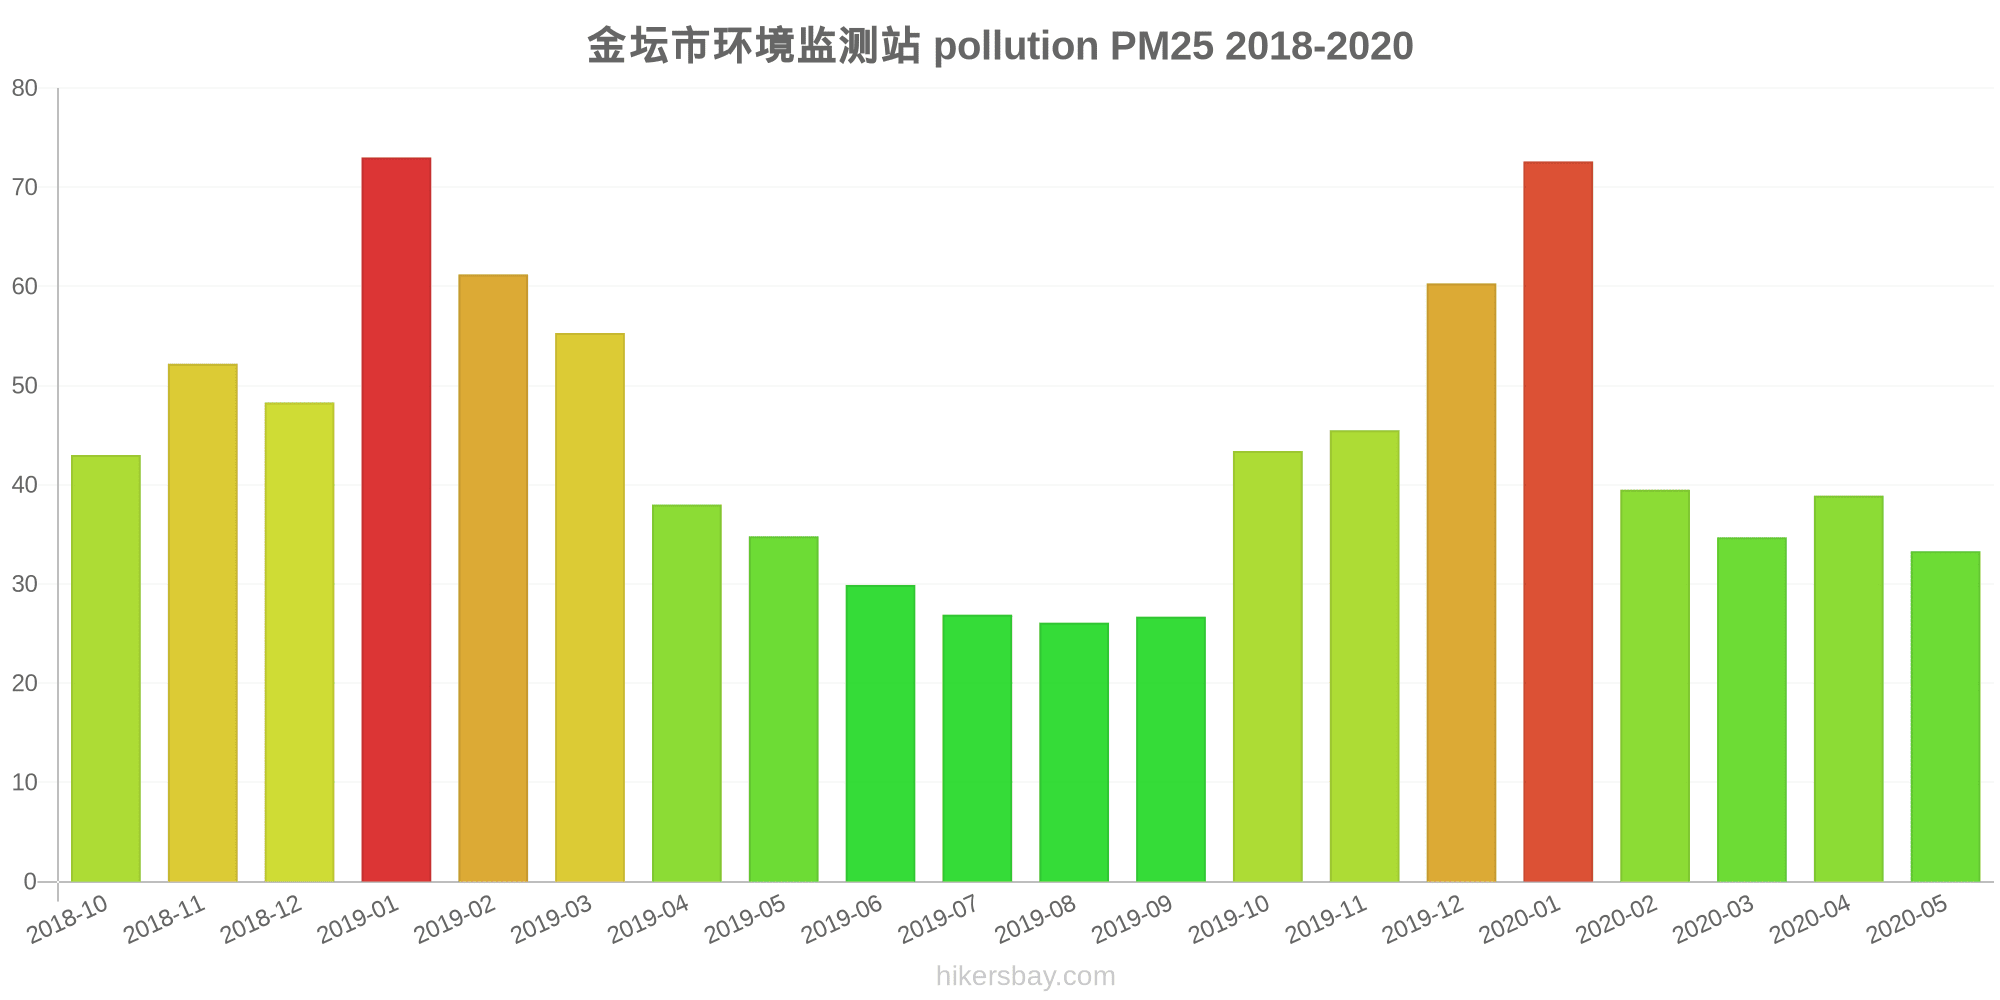
2018-10 2020-05

index
2020-05
2020-04
2020-03
2020-02
2020-01
2019-12
2019-11
2019-10
2019-09
2019-08
2019-07
2019-06
2019-05
2019-04
2019-03
2019-02
2019-01
2018-12
2018-11
2018-10
pm25
33
39
35
40
73
60
46
43
27
26
27
30
35
38
55
61
73
48
52
43
co
964
890
881
923
1
1
1
992
1
1
1
929
790
1
984
1
1
1
1
908
no2
30
43
32
15
25
41
40
33
26
24
23
26
29
33
38
27
55
49
51
44
o3
163
124
94
71
49
56
80
108
145
161
148
153
152
133
122
88
73
67
108
156
pm10
56
73
58
56
91
89
100
85
41
43
44
50
64
66
89
82
101
83
83
78
so2
11
11
8.6
6.7
7.2
9.6
10
10
15
14
11
9.3
13
11
13
11
14
15
12
14
* Pollution data source:
https://openaq.org
(ChinaAQIData)
The data is licensed under CC-By 4.0
PM10 179 (Very bad Hazardous)
PM2,5 35 (Unhealthy for Sensitive Groups)
O3 0 (Good)
NO2 0 (Good)
SO2 0 (Good)
Data on air pollution from recent days in Jintan
| index | 2022-05-27 |
|---|---|
| pm10 | 56 Unhealthy for Sensitive Groups |
| pm25 | 56 Unhealthy |
| o3 | 0 Good |
| no2 | 0 Good |
| so2 | 0 Good |
| index | 2020-05 | 2020-04 | 2020-03 | 2020-02 | 2020-01 | 2019-12 | 2019-11 | 2019-10 | 2019-09 | 2019-08 | 2019-07 | 2019-06 | 2019-05 | 2019-04 | 2019-03 | 2019-02 | 2019-01 | 2018-12 | 2018-11 | 2018-10 |
|---|---|---|---|---|---|---|---|---|---|---|---|---|---|---|---|---|---|---|---|---|
| pm25 | 33 (Moderate) | 39 (Unhealthy for Sensitive Groups) | 35 (Moderate) | 40 (Unhealthy for Sensitive Groups) | 73 (Unhealthy) | 60 (Unhealthy) | 46 (Unhealthy for Sensitive Groups) | 43 (Unhealthy for Sensitive Groups) | 27 (Moderate) | 26 (Moderate) | 27 (Moderate) | 30 (Moderate) | 35 (Moderate) | 38 (Unhealthy for Sensitive Groups) | 55 (Unhealthy) | 61 (Unhealthy) | 73 (Unhealthy) | 48 (Unhealthy for Sensitive Groups) | 52 (Unhealthy for Sensitive Groups) | 43 (Unhealthy for Sensitive Groups) |
| co | 964 (Good) | 890 (Good) | 881 (Good) | 923 (Good) | 1 (Good) | 1 (Good) | 1 (Good) | 992 (Good) | 1 (Good) | 1 (Good) | 1 (Good) | 929 (Good) | 790 (Good) | 1 (Good) | 984 (Good) | 1 (Good) | 1 (Good) | 1 (Good) | 1 (Good) | 908 (Good) |
| no2 | 30 (Good) | 43 (Moderate) | 32 (Good) | 15 (Good) | 25 (Good) | 41 (Moderate) | 40 (Good) | 33 (Good) | 26 (Good) | 24 (Good) | 23 (Good) | 26 (Good) | 29 (Good) | 33 (Good) | 38 (Good) | 27 (Good) | 55 (Moderate) | 49 (Moderate) | 51 (Moderate) | 44 (Moderate) |
| o3 | 163 (Unhealthy) | 124 (Unhealthy for Sensitive Groups) | 94 (Moderate) | 71 (Moderate) | 49 (Good) | 56 (Good) | 80 (Moderate) | 108 (Moderate) | 145 (Unhealthy for Sensitive Groups) | 161 (Unhealthy) | 148 (Unhealthy for Sensitive Groups) | 153 (Unhealthy) | 152 (Unhealthy) | 133 (Unhealthy for Sensitive Groups) | 122 (Unhealthy for Sensitive Groups) | 88 (Moderate) | 73 (Moderate) | 67 (Good) | 108 (Moderate) | 156 (Unhealthy) |
| pm10 | 56 (Unhealthy for Sensitive Groups) | 73 (Unhealthy for Sensitive Groups) | 58 (Unhealthy for Sensitive Groups) | 56 (Unhealthy for Sensitive Groups) | 91 (Unhealthy) | 89 (Unhealthy) | 100 (Unhealthy) | 85 (Unhealthy) | 41 (Moderate) | 43 (Moderate) | 44 (Moderate) | 50 (Moderate) | 64 (Unhealthy for Sensitive Groups) | 66 (Unhealthy for Sensitive Groups) | 89 (Unhealthy) | 82 (Unhealthy) | 101 (Unhealthy) | 83 (Unhealthy) | 83 (Unhealthy) | 78 (Unhealthy for Sensitive Groups) |
| so2 | 11 (Good) | 11 (Good) | 8.6 (Good) | 6.7 (Good) | 7.2 (Good) | 9.6 (Good) | 10 (Good) | 10 (Good) | 15 (Good) | 14 (Good) | 11 (Good) | 9.3 (Good) | 13 (Good) | 11 (Good) | 13 (Good) | 11 (Good) | 14 (Good) | 15 (Good) | 12 (Good) | 14 (Good) |
PM10 179 (Very bad Hazardous)
particulate matter (PM10) suspended dustPM2,5 35 (Unhealthy for Sensitive Groups)
particulate matter (PM2.5) dustO3 0.04 (Good)
ozone (O3)NO2 0 (Good)
nitrogen dioxide (NO2)SO2 0 (Good)
sulfur dioxide (SO2)金坛市环境监测站
| index | 2022-05-27 |
|---|---|
| pm10 | 56 |
| pm25 | 56 |
| o3 | 0.03 |
| no2 | 0 |
| so2 | 0 |
金坛市环境监测站
| index | 2020-05 | 2020-04 | 2020-03 | 2020-02 | 2020-01 | 2019-12 | 2019-11 | 2019-10 | 2019-09 | 2019-08 | 2019-07 | 2019-06 | 2019-05 | 2019-04 | 2019-03 | 2019-02 | 2019-01 | 2018-12 | 2018-11 | 2018-10 |
|---|---|---|---|---|---|---|---|---|---|---|---|---|---|---|---|---|---|---|---|---|
| pm25 | 33 | 39 | 35 | 40 | 73 | 60 | 46 | 43 | 27 | 26 | 27 | 30 | 35 | 38 | 55 | 61 | 73 | 48 | 52 | 43 |
| co | 964 | 890 | 881 | 923 | 1 | 1 | 1 | 992 | 1 | 1 | 1 | 929 | 790 | 1 | 984 | 1 | 1 | 1 | 1 | 908 |
| no2 | 30 | 43 | 32 | 15 | 25 | 41 | 40 | 33 | 26 | 24 | 23 | 26 | 29 | 33 | 38 | 27 | 55 | 49 | 51 | 44 |
| o3 | 163 | 124 | 94 | 71 | 49 | 56 | 80 | 108 | 145 | 161 | 148 | 153 | 152 | 133 | 122 | 88 | 73 | 67 | 108 | 156 |
| pm10 | 56 | 73 | 58 | 56 | 91 | 89 | 100 | 85 | 41 | 43 | 44 | 50 | 64 | 66 | 89 | 82 | 101 | 83 | 83 | 78 |
| so2 | 11 | 11 | 8.6 | 6.7 | 7.2 | 9.6 | 10 | 10 | 15 | 14 | 11 | 9.3 | 13 | 11 | 13 | 11 | 14 | 15 | 12 | 14 |