Air Pollution in Jinyuan: Real-time Air Quality Index and smog alert.
Pollution and air quality forecast for Jinyuan. Today is Tuesday, June 16, 2026. The following air pollution values have been recorded for Jinyuan:- particulate matter (PM2.5) dust - 61 (Unhealthy)
- nitrogen dioxide (NO2) - 22 (Good)
- particulate matter (PM10) suspended dust - 69 (Unhealthy for Sensitive Groups)
- carbon monoxide (CO) - 219 (Good)
- ozone (O3) - 0 (Good)
- sulfur dioxide (SO2) - 8 (Good)

What is the air quality in Jinyuan today? Is the air polluted in Jinyuan?. Is there smog?
What is the current level of PM2.5 in Jinyuan? (particulate matter (PM2.5) dust)
Today's PM2.5 level is:
61 (Unhealthy)
For comparison, the highest level of PM2.5 in Jinyuan in the last 7 days was: 28 (Friday, May 27, 2022) and the lowest: 28 (Friday, May 27, 2022).
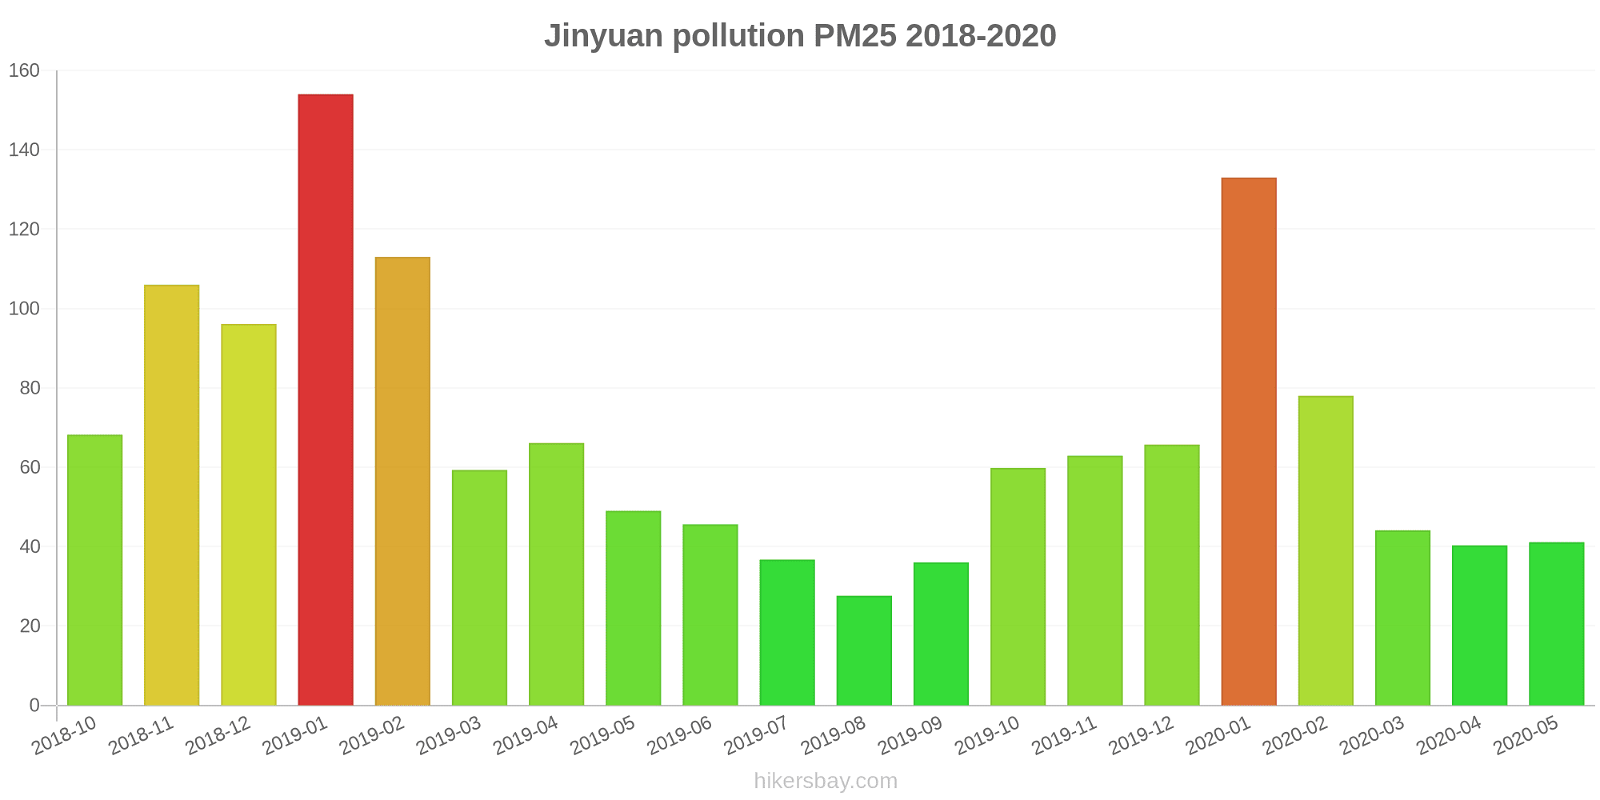
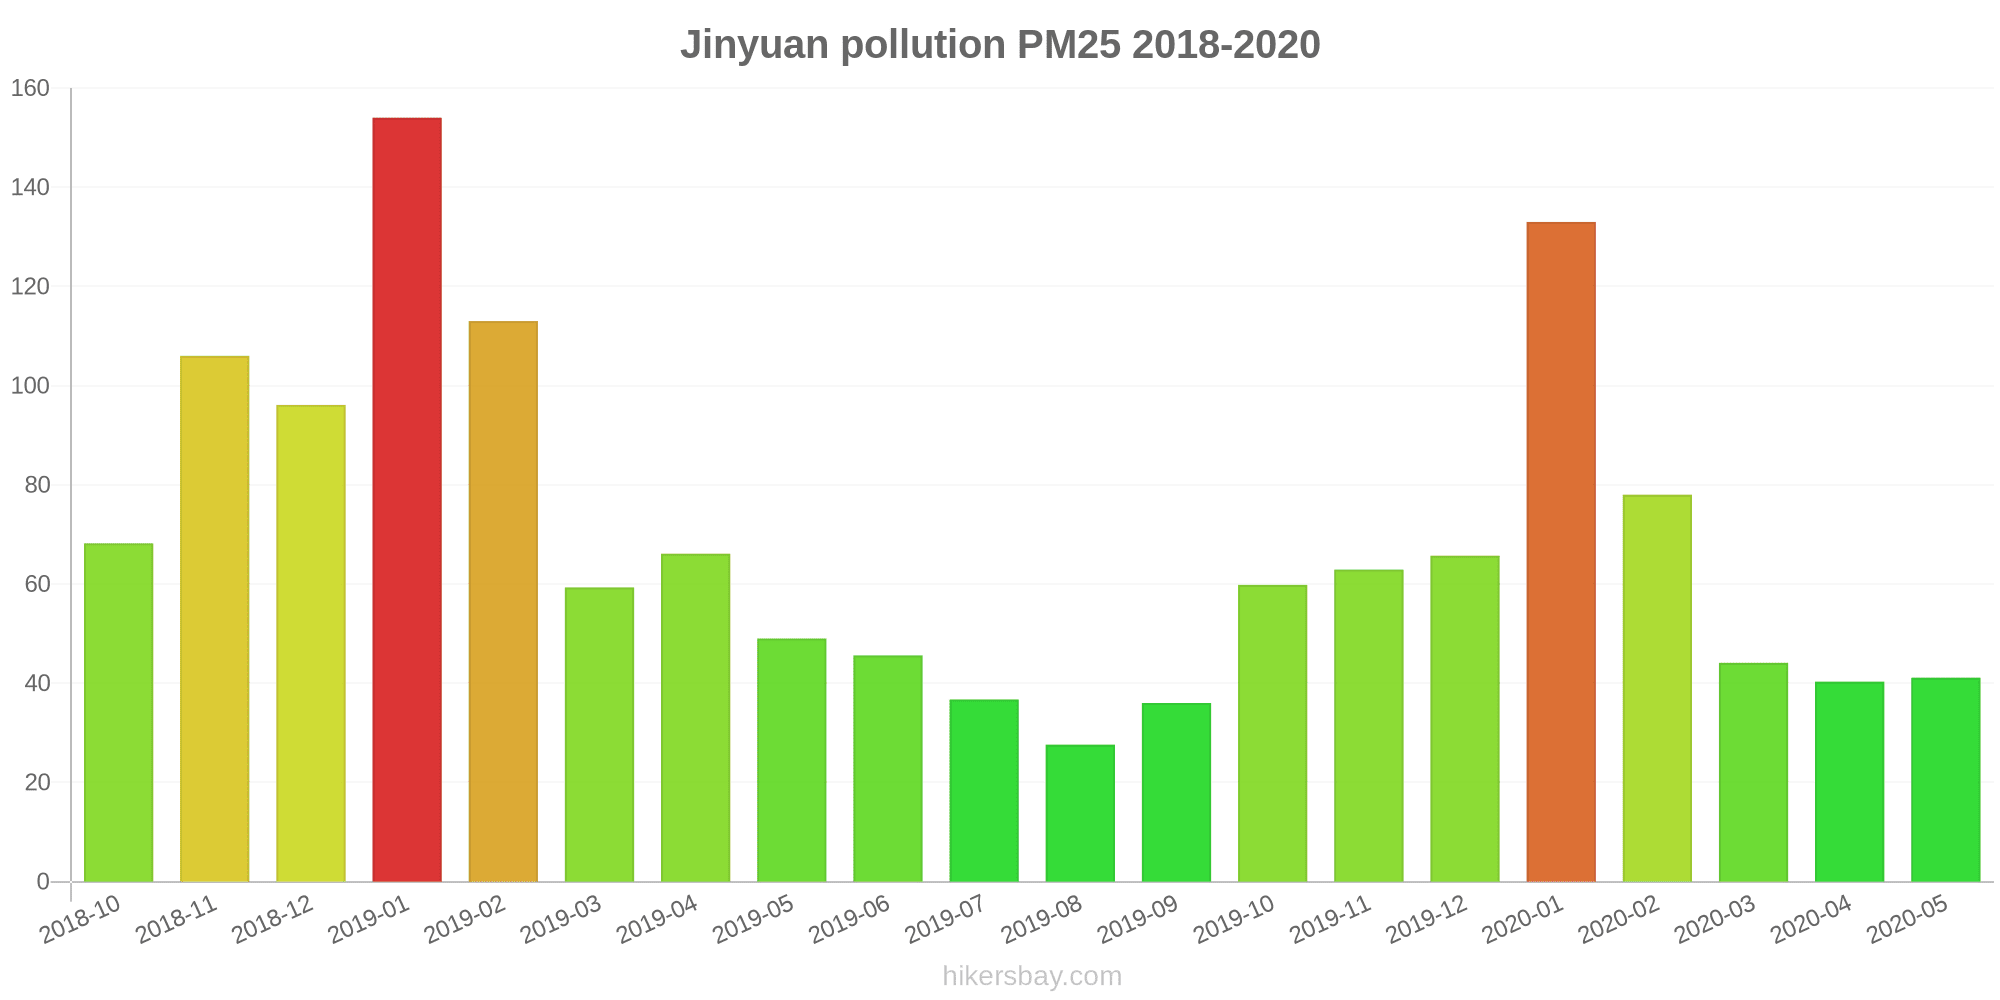
The highest PM2.5 values were recorded: 154 (January 2019).
The lowest level of particulate matter PM2.5 pollution occurs in month: August (28).
How high is the level of NO2? (nitrogen dioxide (NO2))
22 (Good)
What is the level of PM10 today in Jinyuan? (particulate matter (PM10) suspended dust)
The current level of particulate matter PM10 in Jinyuan is:
69 (Unhealthy for Sensitive Groups)
The highest PM10 values usually occur in month: 227 (January 2019).
The lowest value of particulate matter PM10 pollution in Jinyuan is usually recorded in: August (48).
How high is the CO level? (carbon monoxide (CO))
219 (Good)
How is the O3 level today in Jinyuan? (ozone (O3))
0 (Good)
What is the level of SO2 pollution? (sulfur dioxide (SO2))
8 (Good)
Current data Friday, May 27, 2022, 3:00 PM
PM2,5 61 (Unhealthy)
NO2 22 (Good)
PM10 69 (Unhealthy for Sensitive Groups)
CO 219 (Good)
O3 0 (Good)
SO2 8 (Good)
Data on air pollution from recent days in Jinyuan
index
2022-05-27
pm25
28
Moderate
no2
22
Good
pm10
35
Moderate
co
579
Good
o3
22
Good
so2
5
Good
data source »
Air pollution in Jinyuan from October 2018 to May 2020
index
2020-05
2020-04
2020-03
2020-02
2020-01
2019-12
2019-11
2019-10
2019-09
2019-08
2019-07
2019-06
2019-05
2019-04
2019-03
2019-02
2019-01
2018-12
2018-11
2018-10
pm25
41 (Unhealthy for Sensitive Groups)
40 (Unhealthy for Sensitive Groups)
44 (Unhealthy for Sensitive Groups)
78 (Very Unhealthy)
133 (Very bad Hazardous)
66 (Unhealthy)
63 (Unhealthy)
60 (Unhealthy)
36 (Unhealthy for Sensitive Groups)
28 (Moderate)
37 (Unhealthy for Sensitive Groups)
46 (Unhealthy for Sensitive Groups)
49 (Unhealthy for Sensitive Groups)
66 (Unhealthy)
59 (Unhealthy)
113 (Very bad Hazardous)
154 (Very bad Hazardous)
96 (Very Unhealthy)
106 (Very Unhealthy)
68 (Unhealthy)
co
632 (Good)
658 (Good)
730 (Good)
1 (Good)
1 (Good)
1 (Good)
1 (Good)
963 (Good)
715 (Good)
702 (Good)
690 (Good)
685 (Good)
680 (Good)
906 (Good)
932 (Good)
1 (Good)
2 (Good)
1 (Good)
1 (Good)
931 (Good)
no2
37 (Good)
47 (Moderate)
46 (Moderate)
39 (Good)
60 (Moderate)
59 (Moderate)
59 (Moderate)
50 (Moderate)
41 (Moderate)
32 (Good)
29 (Good)
34 (Good)
45 (Moderate)
51 (Moderate)
55 (Moderate)
51 (Moderate)
85 (Moderate)
69 (Moderate)
75 (Moderate)
64 (Moderate)
o3
161 (Unhealthy)
133 (Unhealthy for Sensitive Groups)
109 (Moderate)
87 (Moderate)
59 (Good)
49 (Good)
65 (Good)
98 (Moderate)
146 (Unhealthy for Sensitive Groups)
157 (Unhealthy)
201 (Very Unhealthy)
206 (Very Unhealthy)
161 (Unhealthy)
126 (Unhealthy for Sensitive Groups)
113 (Moderate)
88 (Moderate)
46 (Good)
45 (Good)
64 (Good)
85 (Moderate)
pm10
86 (Unhealthy)
93 (Unhealthy)
92 (Unhealthy)
115 (Very Unhealthy)
177 (Very bad Hazardous)
115 (Very Unhealthy)
125 (Very Unhealthy)
103 (Unhealthy)
67 (Unhealthy for Sensitive Groups)
48 (Moderate)
63 (Unhealthy for Sensitive Groups)
78 (Unhealthy for Sensitive Groups)
117 (Very Unhealthy)
126 (Very Unhealthy)
117 (Very Unhealthy)
142 (Very Unhealthy)
227 (Very bad Hazardous)
178 (Very bad Hazardous)
196 (Very bad Hazardous)
142 (Very Unhealthy)
so2
12 (Good)
12 (Good)
18 (Good)
28 (Good)
35 (Good)
31 (Good)
23 (Good)
17 (Good)
12 (Good)
9.4 (Good)
10 (Good)
15 (Good)
17 (Good)
17 (Good)
22 (Good)
44 (Good)
69 (Moderate)
52 (Moderate)
36 (Good)
16 (Good)
data source »
晋源
Friday, May 27, 2022, 3:00 PM
PM2,5 61 (Unhealthy)
particulate matter (PM2.5) dust
NO2 22 (Good)
nitrogen dioxide (NO2)
PM10 69 (Unhealthy for Sensitive Groups)
particulate matter (PM10) suspended dust
CO 219 (Good)
carbon monoxide (CO)
O3 0.05 (Good)
ozone (O3)
SO2 7.7 (Good)
sulfur dioxide (SO2)
晋源
index
2022-05-27
pm25
28
no2
22
pm10
35
co
579
o3
22
so2
4.6
晋源
2018-10 2020-05
index
2020-05
2020-04
2020-03
2020-02
2020-01
2019-12
2019-11
2019-10
2019-09
2019-08
2019-07
2019-06
2019-05
2019-04
2019-03
2019-02
2019-01
2018-12
2018-11
2018-10
pm25
41
40
44
78
133
66
63
60
36
28
37
46
49
66
59
113
154
96
106
68
co
632
658
730
1
1
1
1
963
715
702
690
685
680
906
932
1
2
1
1
931
no2
37
47
46
39
60
59
59
50
41
32
29
34
45
51
55
51
85
69
75
64
o3
161
133
109
87
59
49
65
98
146
157
201
206
161
126
113
88
46
45
64
85
pm10
86
93
92
115
177
115
125
103
67
48
63
78
117
126
117
142
227
178
196
142
so2
12
12
18
28
35
31
23
17
12
9.4
10
15
17
17
22
44
69
52
36
16
* Pollution data source:
https://openaq.org
(ChinaAQIData)
The data is licensed under CC-By 4.0
PM2,5 61 (Unhealthy)
NO2 22 (Good)
PM10 69 (Unhealthy for Sensitive Groups)
CO 219 (Good)
O3 0 (Good)
SO2 8 (Good)
Data on air pollution from recent days in Jinyuan
| index | 2022-05-27 |
|---|---|
| pm25 | 28 Moderate |
| no2 | 22 Good |
| pm10 | 35 Moderate |
| co | 579 Good |
| o3 | 22 Good |
| so2 | 5 Good |
| index | 2020-05 | 2020-04 | 2020-03 | 2020-02 | 2020-01 | 2019-12 | 2019-11 | 2019-10 | 2019-09 | 2019-08 | 2019-07 | 2019-06 | 2019-05 | 2019-04 | 2019-03 | 2019-02 | 2019-01 | 2018-12 | 2018-11 | 2018-10 |
|---|---|---|---|---|---|---|---|---|---|---|---|---|---|---|---|---|---|---|---|---|
| pm25 | 41 (Unhealthy for Sensitive Groups) | 40 (Unhealthy for Sensitive Groups) | 44 (Unhealthy for Sensitive Groups) | 78 (Very Unhealthy) | 133 (Very bad Hazardous) | 66 (Unhealthy) | 63 (Unhealthy) | 60 (Unhealthy) | 36 (Unhealthy for Sensitive Groups) | 28 (Moderate) | 37 (Unhealthy for Sensitive Groups) | 46 (Unhealthy for Sensitive Groups) | 49 (Unhealthy for Sensitive Groups) | 66 (Unhealthy) | 59 (Unhealthy) | 113 (Very bad Hazardous) | 154 (Very bad Hazardous) | 96 (Very Unhealthy) | 106 (Very Unhealthy) | 68 (Unhealthy) |
| co | 632 (Good) | 658 (Good) | 730 (Good) | 1 (Good) | 1 (Good) | 1 (Good) | 1 (Good) | 963 (Good) | 715 (Good) | 702 (Good) | 690 (Good) | 685 (Good) | 680 (Good) | 906 (Good) | 932 (Good) | 1 (Good) | 2 (Good) | 1 (Good) | 1 (Good) | 931 (Good) |
| no2 | 37 (Good) | 47 (Moderate) | 46 (Moderate) | 39 (Good) | 60 (Moderate) | 59 (Moderate) | 59 (Moderate) | 50 (Moderate) | 41 (Moderate) | 32 (Good) | 29 (Good) | 34 (Good) | 45 (Moderate) | 51 (Moderate) | 55 (Moderate) | 51 (Moderate) | 85 (Moderate) | 69 (Moderate) | 75 (Moderate) | 64 (Moderate) |
| o3 | 161 (Unhealthy) | 133 (Unhealthy for Sensitive Groups) | 109 (Moderate) | 87 (Moderate) | 59 (Good) | 49 (Good) | 65 (Good) | 98 (Moderate) | 146 (Unhealthy for Sensitive Groups) | 157 (Unhealthy) | 201 (Very Unhealthy) | 206 (Very Unhealthy) | 161 (Unhealthy) | 126 (Unhealthy for Sensitive Groups) | 113 (Moderate) | 88 (Moderate) | 46 (Good) | 45 (Good) | 64 (Good) | 85 (Moderate) |
| pm10 | 86 (Unhealthy) | 93 (Unhealthy) | 92 (Unhealthy) | 115 (Very Unhealthy) | 177 (Very bad Hazardous) | 115 (Very Unhealthy) | 125 (Very Unhealthy) | 103 (Unhealthy) | 67 (Unhealthy for Sensitive Groups) | 48 (Moderate) | 63 (Unhealthy for Sensitive Groups) | 78 (Unhealthy for Sensitive Groups) | 117 (Very Unhealthy) | 126 (Very Unhealthy) | 117 (Very Unhealthy) | 142 (Very Unhealthy) | 227 (Very bad Hazardous) | 178 (Very bad Hazardous) | 196 (Very bad Hazardous) | 142 (Very Unhealthy) |
| so2 | 12 (Good) | 12 (Good) | 18 (Good) | 28 (Good) | 35 (Good) | 31 (Good) | 23 (Good) | 17 (Good) | 12 (Good) | 9.4 (Good) | 10 (Good) | 15 (Good) | 17 (Good) | 17 (Good) | 22 (Good) | 44 (Good) | 69 (Moderate) | 52 (Moderate) | 36 (Good) | 16 (Good) |
PM2,5 61 (Unhealthy)
particulate matter (PM2.5) dustNO2 22 (Good)
nitrogen dioxide (NO2)PM10 69 (Unhealthy for Sensitive Groups)
particulate matter (PM10) suspended dustCO 219 (Good)
carbon monoxide (CO)O3 0.05 (Good)
ozone (O3)SO2 7.7 (Good)
sulfur dioxide (SO2)晋源
| index | 2022-05-27 |
|---|---|
| pm25 | 28 |
| no2 | 22 |
| pm10 | 35 |
| co | 579 |
| o3 | 22 |
| so2 | 4.6 |
晋源

| index | 2020-05 | 2020-04 | 2020-03 | 2020-02 | 2020-01 | 2019-12 | 2019-11 | 2019-10 | 2019-09 | 2019-08 | 2019-07 | 2019-06 | 2019-05 | 2019-04 | 2019-03 | 2019-02 | 2019-01 | 2018-12 | 2018-11 | 2018-10 |
|---|---|---|---|---|---|---|---|---|---|---|---|---|---|---|---|---|---|---|---|---|
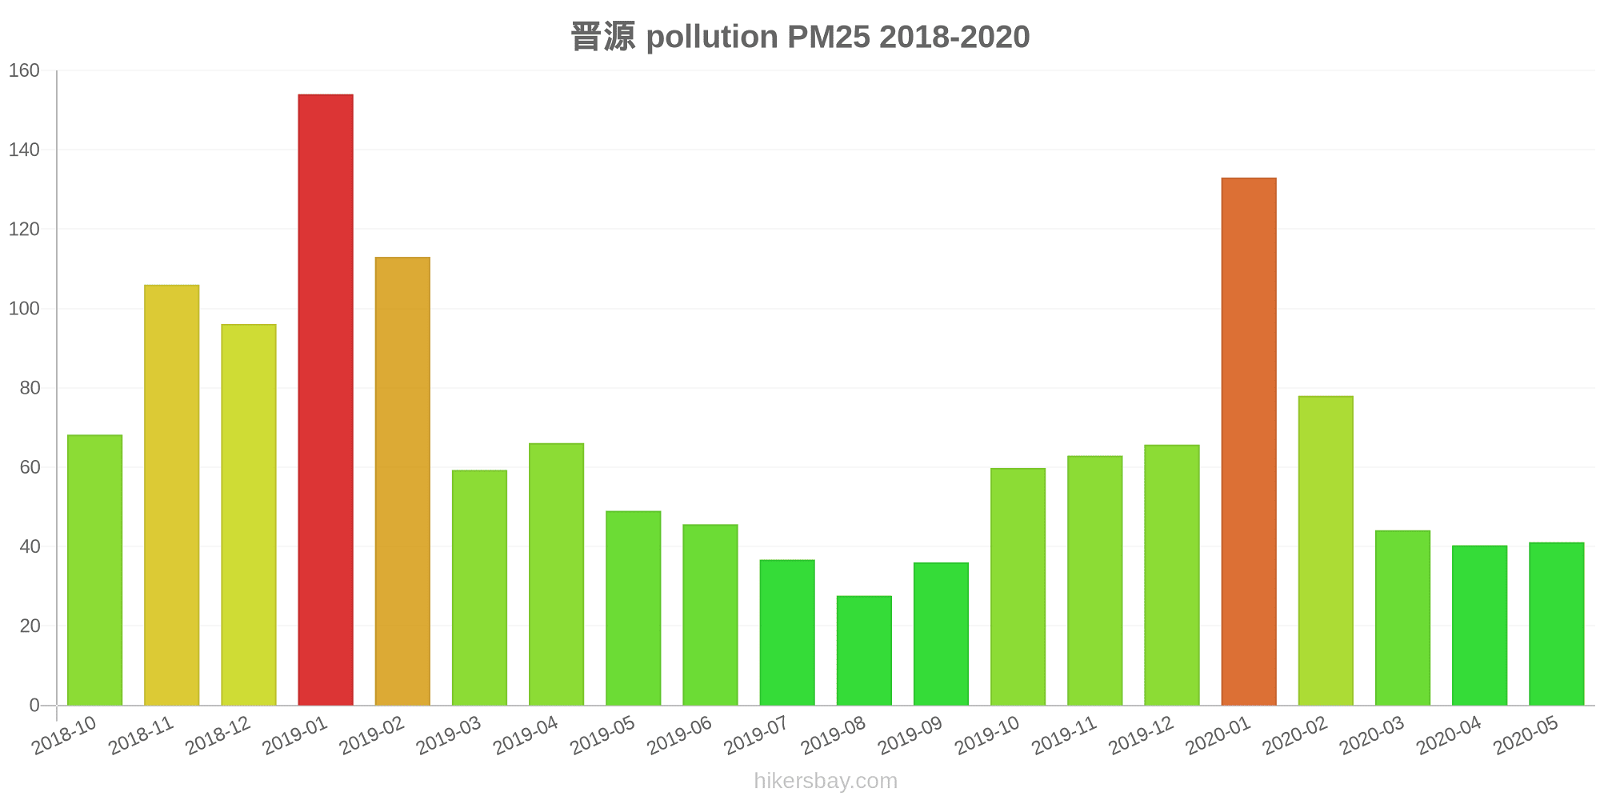
| pm25 | 41 | 40 | 44 | 78 | 133 | 66 | 63 | 60 | 36 | 28 | 37 | 46 | 49 | 66 | 59 | 113 | 154 | 96 | 106 | 68 |
| co | 632 | 658 | 730 | 1 | 1 | 1 | 1 | 963 | 715 | 702 | 690 | 685 | 680 | 906 | 932 | 1 | 2 | 1 | 1 | 931 |
| no2 | 37 | 47 | 46 | 39 | 60 | 59 | 59 | 50 | 41 | 32 | 29 | 34 | 45 | 51 | 55 | 51 | 85 | 69 | 75 | 64 |
| o3 | 161 | 133 | 109 | 87 | 59 | 49 | 65 | 98 | 146 | 157 | 201 | 206 | 161 | 126 | 113 | 88 | 46 | 45 | 64 | 85 |
| pm10 | 86 | 93 | 92 | 115 | 177 | 115 | 125 | 103 | 67 | 48 | 63 | 78 | 117 | 126 | 117 | 142 | 227 | 178 | 196 | 142 |
| so2 | 12 | 12 | 18 | 28 | 35 | 31 | 23 | 17 | 12 | 9.4 | 10 | 15 | 17 | 17 | 22 | 44 | 69 | 52 | 36 | 16 |