Air Pollution in Xixiang: Real-time Air Quality Index and smog alert.
Pollution and air quality forecast for Xixiang. Today is Tuesday, June 16, 2026. The following air pollution values have been recorded for Xixiang:- particulate matter (PM10) suspended dust - 179 (Very bad Hazardous)
- particulate matter (PM2.5) dust - 35 (Unhealthy for Sensitive Groups)
- ozone (O3) - 0 (Good)
- nitrogen dioxide (NO2) - 0 (Good)
- sulfur dioxide (SO2) - 0 (Good)

What is the air quality in Xixiang today? Is the air polluted in Xixiang?. Is there smog?
What is the level of PM10 today in Xixiang? (particulate matter (PM10) suspended dust)
The current level of particulate matter PM10 in Xixiang is:
179 (Very bad Hazardous)
The highest PM10 values usually occur in month: 95 (December 2019).
The lowest value of particulate matter PM10 pollution in Xixiang is usually recorded in: June (22).
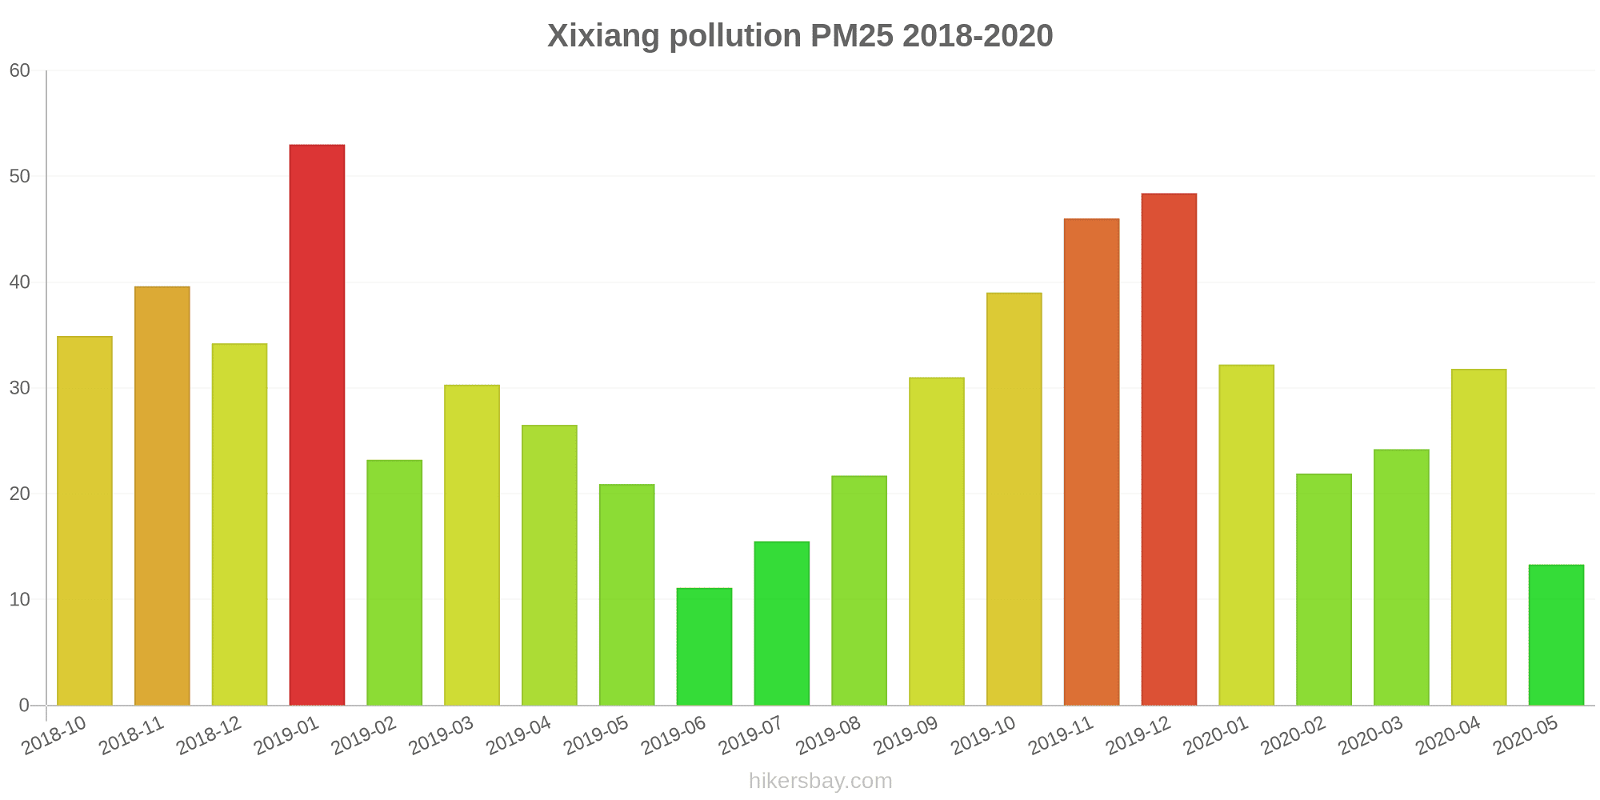
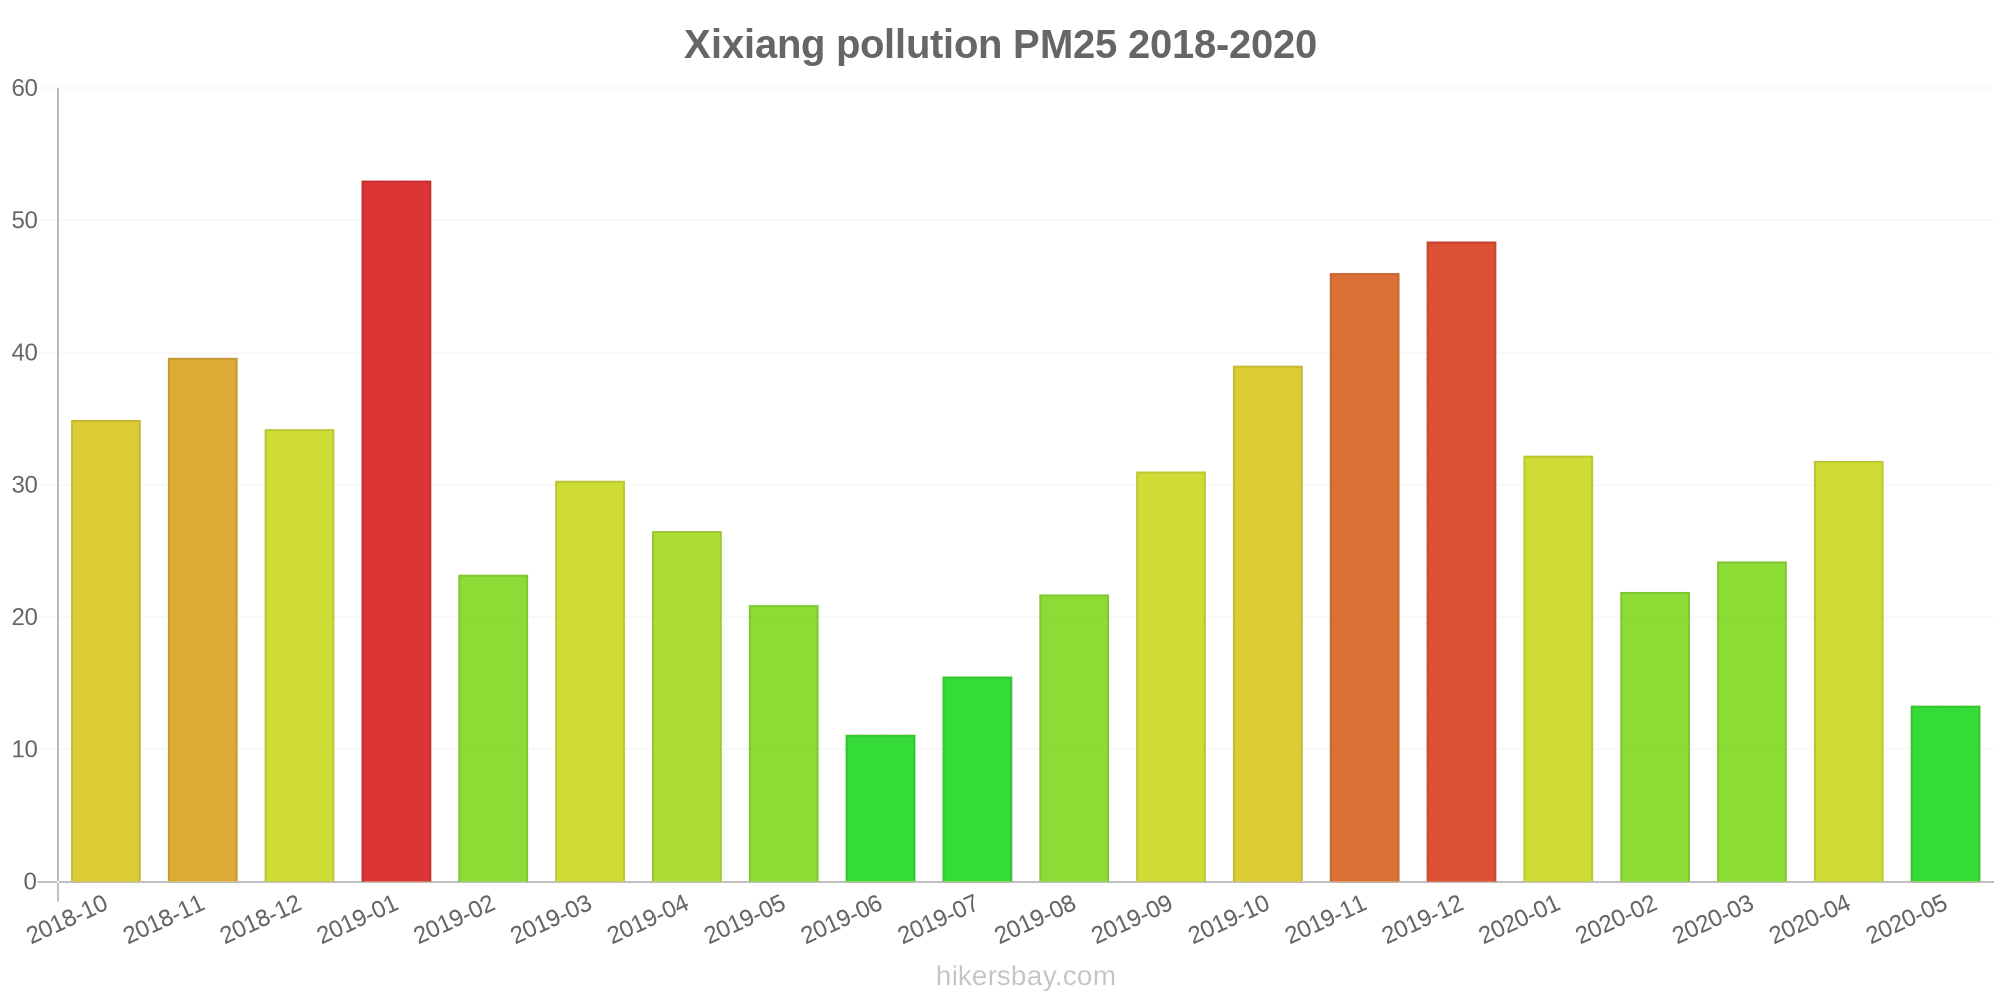
What is the current level of PM2.5 in Xixiang? (particulate matter (PM2.5) dust)
Today's PM2.5 level is:
35 (Unhealthy for Sensitive Groups)
For comparison, the highest level of PM2.5 in Xixiang in the last 7 days was: 56 (Friday, May 27, 2022) and the lowest: 56 (Friday, May 27, 2022).
The highest PM2.5 values were recorded: 53 (January 2019).
The lowest level of particulate matter PM2.5 pollution occurs in month: June (11).
How is the O3 level today in Xixiang? (ozone (O3))
0 (Good)
How high is the level of NO2? (nitrogen dioxide (NO2))
0 (Good)
What is the level of SO2 pollution? (sulfur dioxide (SO2))
0 (Good)
Current data Friday, May 27, 2022, 12:00 PM
PM10 179 (Very bad Hazardous)
PM2,5 35 (Unhealthy for Sensitive Groups)
O3 0 (Good)
NO2 0 (Good)
SO2 0 (Good)
Data on air pollution from recent days in Xixiang
index
2022-05-27
pm10
56
Unhealthy for Sensitive Groups
pm25
56
Unhealthy
o3
0
Good
no2
0
Good
so2
0
Good
data source »
Air pollution in Xixiang from October 2018 to May 2020
index
2020-05
2020-04
2020-03
2020-02
2020-01
2019-12
2019-11
2019-10
2019-09
2019-08
2019-07
2019-06
2019-05
2019-04
2019-03
2019-02
2019-01
2018-12
2018-11
2018-10
pm25
13 (Moderate)
32 (Moderate)
24 (Moderate)
22 (Moderate)
32 (Moderate)
48 (Unhealthy for Sensitive Groups)
46 (Unhealthy for Sensitive Groups)
39 (Unhealthy for Sensitive Groups)
31 (Moderate)
22 (Moderate)
16 (Moderate)
11 (Good)
21 (Moderate)
27 (Moderate)
30 (Moderate)
23 (Moderate)
53 (Unhealthy for Sensitive Groups)
34 (Moderate)
40 (Unhealthy for Sensitive Groups)
35 (Moderate)
co
560 (Good)
596 (Good)
614 (Good)
583 (Good)
746 (Good)
760 (Good)
632 (Good)
721 (Good)
652 (Good)
597 (Good)
597 (Good)
540 (Good)
609 (Good)
525 (Good)
632 (Good)
655 (Good)
866 (Good)
694 (Good)
596 (Good)
611 (Good)
no2
25 (Good)
44 (Moderate)
32 (Good)
24 (Good)
39 (Good)
68 (Moderate)
57 (Moderate)
39 (Good)
41 (Moderate)
36 (Good)
28 (Good)
25 (Good)
34 (Good)
34 (Good)
39 (Good)
28 (Good)
52 (Moderate)
44 (Moderate)
43 (Moderate)
38 (Good)
o3
73 (Moderate)
103 (Moderate)
81 (Moderate)
96 (Moderate)
97 (Moderate)
103 (Moderate)
177 (Unhealthy)
172 (Unhealthy)
173 (Unhealthy)
132 (Unhealthy for Sensitive Groups)
83 (Moderate)
77 (Moderate)
89 (Moderate)
86 (Moderate)
76 (Moderate)
81 (Moderate)
92 (Moderate)
75 (Moderate)
103 (Moderate)
110 (Moderate)
pm10
30 (Moderate)
58 (Unhealthy for Sensitive Groups)
45 (Moderate)
36 (Moderate)
60 (Unhealthy for Sensitive Groups)
95 (Unhealthy)
95 (Unhealthy)
69 (Unhealthy for Sensitive Groups)
55 (Unhealthy for Sensitive Groups)
39 (Moderate)
31 (Moderate)
22 (Moderate)
39 (Moderate)
37 (Moderate)
46 (Moderate)
37 (Moderate)
89 (Unhealthy)
63 (Unhealthy for Sensitive Groups)
67 (Unhealthy for Sensitive Groups)
58 (Unhealthy for Sensitive Groups)
so2
4.8 (Good)
7.8 (Good)
6.6 (Good)
6.3 (Good)
6.4 (Good)
9.3 (Good)
8.3 (Good)
7.2 (Good)
6.7 (Good)
5.5 (Good)
4.7 (Good)
4 (Good)
4.1 (Good)
4.4 (Good)
4.3 (Good)
4.2 (Good)
7.5 (Good)
7 (Good)
6.5 (Good)
8 (Good)
data source »
西乡
Friday, May 27, 2022, 12:00 PM
PM10 179 (Very bad Hazardous)
particulate matter (PM10) suspended dust
PM2,5 35 (Unhealthy for Sensitive Groups)
particulate matter (PM2.5) dust
O3 0.04 (Good)
ozone (O3)
NO2 0 (Good)
nitrogen dioxide (NO2)
SO2 0 (Good)
sulfur dioxide (SO2)
西乡
index
2022-05-27
pm10
56
pm25
56
o3
0.03
no2
0
so2
0
西乡
2018-10 2020-05

index
2020-05
2020-04
2020-03
2020-02
2020-01
2019-12
2019-11
2019-10
2019-09
2019-08
2019-07
2019-06
2019-05
2019-04
2019-03
2019-02
2019-01
2018-12
2018-11
2018-10
pm25
13
32
24
22
32
48
46
39
31
22
16
11
21
27
30
23
53
34
40
35
co
560
596
614
583
746
760
632
721
652
597
597
540
609
525
632
655
866
694
596
611
no2
25
44
32
24
39
68
57
39
41
36
28
25
34
34
39
28
52
44
43
38
o3
73
103
81
96
97
103
177
172
173
132
83
77
89
86
76
81
92
75
103
110
pm10
30
58
45
36
60
95
95
69
55
39
31
22
39
37
46
37
89
63
67
58
so2
4.8
7.8
6.6
6.3
6.4
9.3
8.3
7.2
6.7
5.5
4.7
4
4.1
4.4
4.3
4.2
7.5
7
6.5
8
* Pollution data source:
https://openaq.org
(ChinaAQIData)
The data is licensed under CC-By 4.0
PM10 179 (Very bad Hazardous)
PM2,5 35 (Unhealthy for Sensitive Groups)
O3 0 (Good)
NO2 0 (Good)
SO2 0 (Good)
Data on air pollution from recent days in Xixiang
| index | 2022-05-27 |
|---|---|
| pm10 | 56 Unhealthy for Sensitive Groups |
| pm25 | 56 Unhealthy |
| o3 | 0 Good |
| no2 | 0 Good |
| so2 | 0 Good |
| index | 2020-05 | 2020-04 | 2020-03 | 2020-02 | 2020-01 | 2019-12 | 2019-11 | 2019-10 | 2019-09 | 2019-08 | 2019-07 | 2019-06 | 2019-05 | 2019-04 | 2019-03 | 2019-02 | 2019-01 | 2018-12 | 2018-11 | 2018-10 |
|---|---|---|---|---|---|---|---|---|---|---|---|---|---|---|---|---|---|---|---|---|
| pm25 | 13 (Moderate) | 32 (Moderate) | 24 (Moderate) | 22 (Moderate) | 32 (Moderate) | 48 (Unhealthy for Sensitive Groups) | 46 (Unhealthy for Sensitive Groups) | 39 (Unhealthy for Sensitive Groups) | 31 (Moderate) | 22 (Moderate) | 16 (Moderate) | 11 (Good) | 21 (Moderate) | 27 (Moderate) | 30 (Moderate) | 23 (Moderate) | 53 (Unhealthy for Sensitive Groups) | 34 (Moderate) | 40 (Unhealthy for Sensitive Groups) | 35 (Moderate) |
| co | 560 (Good) | 596 (Good) | 614 (Good) | 583 (Good) | 746 (Good) | 760 (Good) | 632 (Good) | 721 (Good) | 652 (Good) | 597 (Good) | 597 (Good) | 540 (Good) | 609 (Good) | 525 (Good) | 632 (Good) | 655 (Good) | 866 (Good) | 694 (Good) | 596 (Good) | 611 (Good) |
| no2 | 25 (Good) | 44 (Moderate) | 32 (Good) | 24 (Good) | 39 (Good) | 68 (Moderate) | 57 (Moderate) | 39 (Good) | 41 (Moderate) | 36 (Good) | 28 (Good) | 25 (Good) | 34 (Good) | 34 (Good) | 39 (Good) | 28 (Good) | 52 (Moderate) | 44 (Moderate) | 43 (Moderate) | 38 (Good) |
| o3 | 73 (Moderate) | 103 (Moderate) | 81 (Moderate) | 96 (Moderate) | 97 (Moderate) | 103 (Moderate) | 177 (Unhealthy) | 172 (Unhealthy) | 173 (Unhealthy) | 132 (Unhealthy for Sensitive Groups) | 83 (Moderate) | 77 (Moderate) | 89 (Moderate) | 86 (Moderate) | 76 (Moderate) | 81 (Moderate) | 92 (Moderate) | 75 (Moderate) | 103 (Moderate) | 110 (Moderate) |
| pm10 | 30 (Moderate) | 58 (Unhealthy for Sensitive Groups) | 45 (Moderate) | 36 (Moderate) | 60 (Unhealthy for Sensitive Groups) | 95 (Unhealthy) | 95 (Unhealthy) | 69 (Unhealthy for Sensitive Groups) | 55 (Unhealthy for Sensitive Groups) | 39 (Moderate) | 31 (Moderate) | 22 (Moderate) | 39 (Moderate) | 37 (Moderate) | 46 (Moderate) | 37 (Moderate) | 89 (Unhealthy) | 63 (Unhealthy for Sensitive Groups) | 67 (Unhealthy for Sensitive Groups) | 58 (Unhealthy for Sensitive Groups) |
| so2 | 4.8 (Good) | 7.8 (Good) | 6.6 (Good) | 6.3 (Good) | 6.4 (Good) | 9.3 (Good) | 8.3 (Good) | 7.2 (Good) | 6.7 (Good) | 5.5 (Good) | 4.7 (Good) | 4 (Good) | 4.1 (Good) | 4.4 (Good) | 4.3 (Good) | 4.2 (Good) | 7.5 (Good) | 7 (Good) | 6.5 (Good) | 8 (Good) |
PM10 179 (Very bad Hazardous)
particulate matter (PM10) suspended dustPM2,5 35 (Unhealthy for Sensitive Groups)
particulate matter (PM2.5) dustO3 0.04 (Good)
ozone (O3)NO2 0 (Good)
nitrogen dioxide (NO2)SO2 0 (Good)
sulfur dioxide (SO2)西乡
| index | 2022-05-27 |
|---|---|
| pm10 | 56 |
| pm25 | 56 |
| o3 | 0.03 |
| no2 | 0 |
| so2 | 0 |
西乡

| index | 2020-05 | 2020-04 | 2020-03 | 2020-02 | 2020-01 | 2019-12 | 2019-11 | 2019-10 | 2019-09 | 2019-08 | 2019-07 | 2019-06 | 2019-05 | 2019-04 | 2019-03 | 2019-02 | 2019-01 | 2018-12 | 2018-11 | 2018-10 |
|---|---|---|---|---|---|---|---|---|---|---|---|---|---|---|---|---|---|---|---|---|
| pm25 | 13 | 32 | 24 | 22 | 32 | 48 | 46 | 39 | 31 | 22 | 16 | 11 | 21 | 27 | 30 | 23 | 53 | 34 | 40 | 35 |
| co | 560 | 596 | 614 | 583 | 746 | 760 | 632 | 721 | 652 | 597 | 597 | 540 | 609 | 525 | 632 | 655 | 866 | 694 | 596 | 611 |
| no2 | 25 | 44 | 32 | 24 | 39 | 68 | 57 | 39 | 41 | 36 | 28 | 25 | 34 | 34 | 39 | 28 | 52 | 44 | 43 | 38 |
| o3 | 73 | 103 | 81 | 96 | 97 | 103 | 177 | 172 | 173 | 132 | 83 | 77 | 89 | 86 | 76 | 81 | 92 | 75 | 103 | 110 |
| pm10 | 30 | 58 | 45 | 36 | 60 | 95 | 95 | 69 | 55 | 39 | 31 | 22 | 39 | 37 | 46 | 37 | 89 | 63 | 67 | 58 |
| so2 | 4.8 | 7.8 | 6.6 | 6.3 | 6.4 | 9.3 | 8.3 | 7.2 | 6.7 | 5.5 | 4.7 | 4 | 4.1 | 4.4 | 4.3 | 4.2 | 7.5 | 7 | 6.5 | 8 |