Air Pollution in Kuishan: Real-time Air Quality Index and smog alert.
Pollution and air quality forecast for Kuishan. Today is Tuesday, June 2, 2026. The following air pollution values have been recorded for Kuishan:- particulate matter (PM10) suspended dust - 179 (Very bad Hazardous)
- particulate matter (PM2.5) dust - 35 (Unhealthy for Sensitive Groups)
- ozone (O3) - 0 (Good)
- nitrogen dioxide (NO2) - 0 (Good)
- sulfur dioxide (SO2) - 0 (Good)

What is the air quality in Kuishan today? Is the air polluted in Kuishan?. Is there smog?
What is the level of PM10 today in Kuishan? (particulate matter (PM10) suspended dust)
The current level of particulate matter PM10 in Kuishan is:
179 (Very bad Hazardous)
The highest PM10 values usually occur in month: 124 (January 2019).
The lowest value of particulate matter PM10 pollution in Kuishan is usually recorded in: August (43).
What is the current level of PM2.5 in Kuishan? (particulate matter (PM2.5) dust)
Today's PM2.5 level is:
35 (Unhealthy for Sensitive Groups)
For comparison, the highest level of PM2.5 in Kuishan in the last 7 days was: 56 (Friday, May 27, 2022) and the lowest: 56 (Friday, May 27, 2022).
The highest PM2.5 values were recorded: 111 (January 2020).
The lowest level of particulate matter PM2.5 pollution occurs in month: August (25).
How is the O3 level today in Kuishan? (ozone (O3))
0 (Good)
How high is the level of NO2? (nitrogen dioxide (NO2))
0 (Good)
What is the level of SO2 pollution? (sulfur dioxide (SO2))
0 (Good)
Current data Friday, May 27, 2022, 12:00 PM
PM10 179 (Very bad Hazardous)
PM2,5 35 (Unhealthy for Sensitive Groups)
O3 0 (Good)
NO2 0 (Good)
SO2 0 (Good)
Data on air pollution from recent days in Kuishan
index
2022-05-27
pm10
56
Unhealthy for Sensitive Groups
pm25
56
Unhealthy
o3
0
Good
no2
0
Good
so2
0
Good
data source »
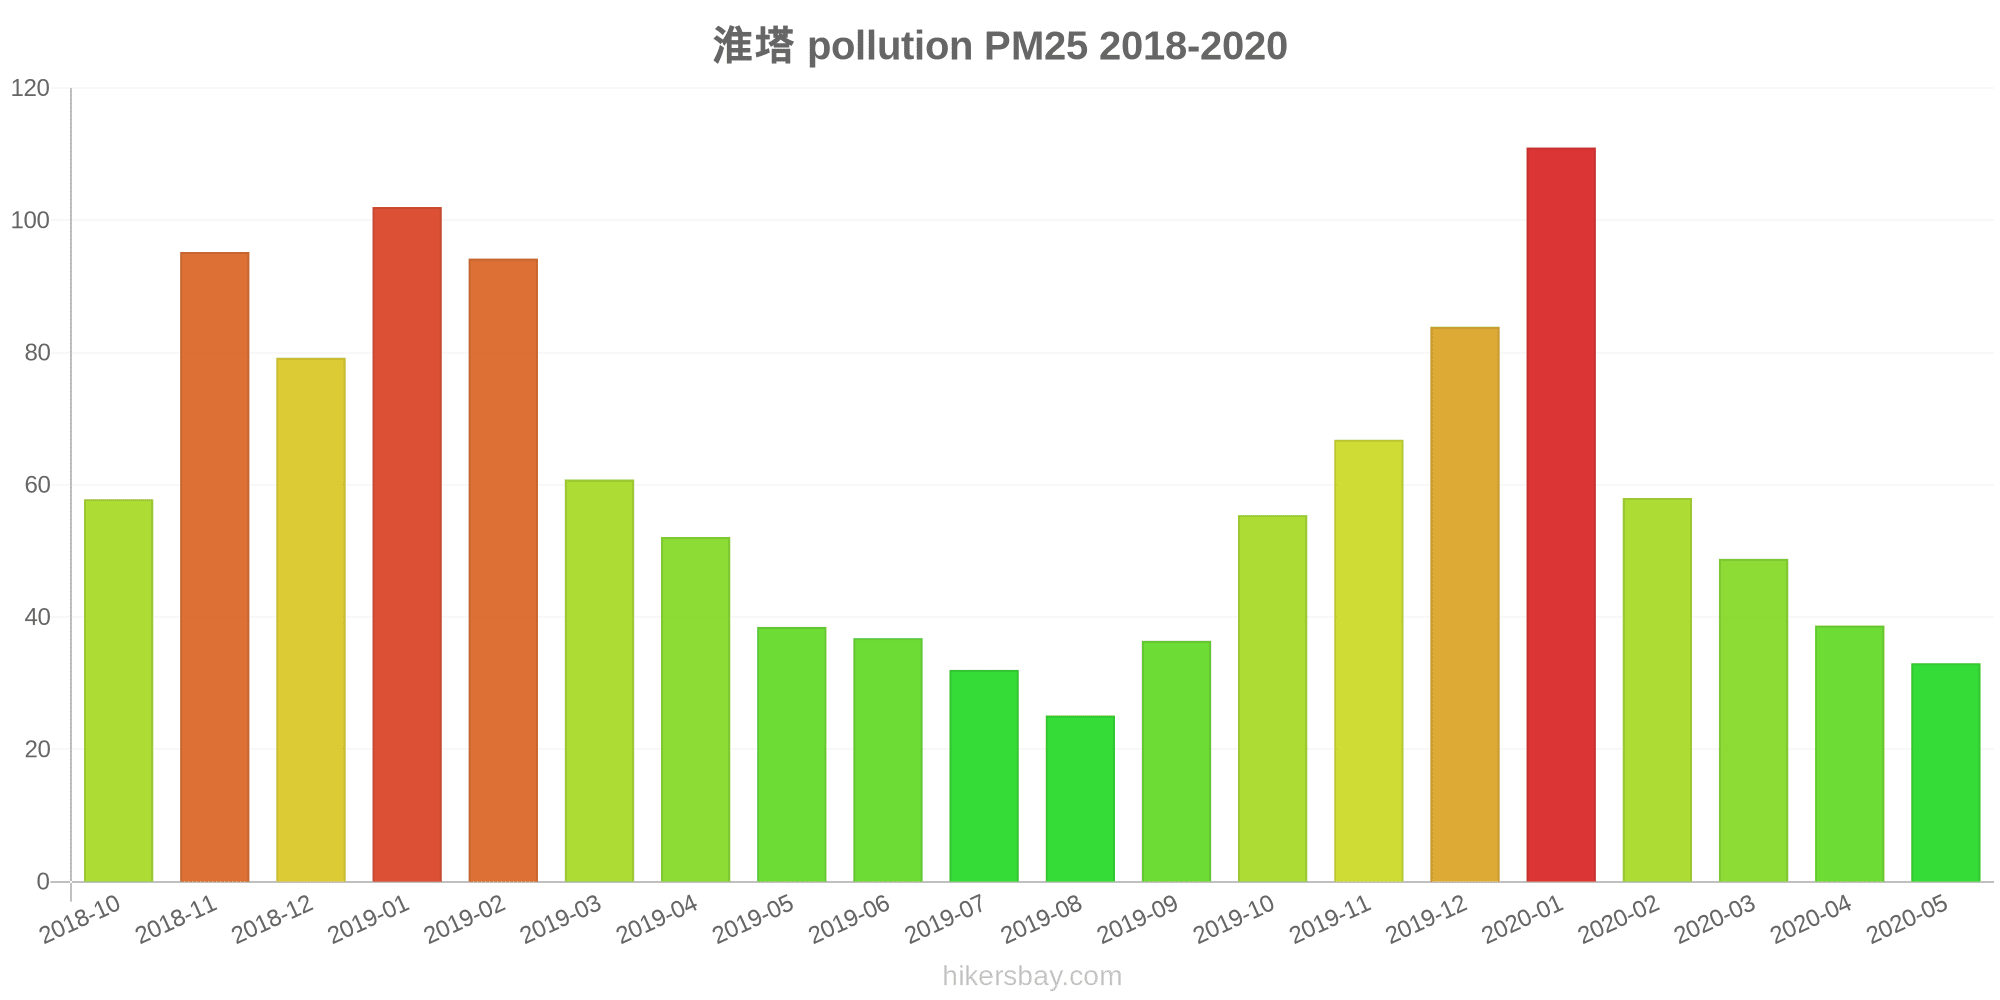
Air pollution in Kuishan from October 2018 to May 2020

index
2020-05
2020-04
2020-03
2020-02
2020-01
2019-12
2019-11
2019-10
2019-09
2019-08
2019-07
2019-06
2019-05
2019-04
2019-03
2019-02
2019-01
2018-12
2018-11
2018-10
pm25
33 (Moderate)
39 (Unhealthy for Sensitive Groups)
49 (Unhealthy for Sensitive Groups)
58 (Unhealthy)
111 (Very bad Hazardous)
84 (Very Unhealthy)
67 (Unhealthy)
55 (Unhealthy)
36 (Unhealthy for Sensitive Groups)
25 (Moderate)
32 (Moderate)
37 (Unhealthy for Sensitive Groups)
39 (Unhealthy for Sensitive Groups)
52 (Unhealthy for Sensitive Groups)
61 (Unhealthy)
94 (Very Unhealthy)
102 (Very Unhealthy)
79 (Very Unhealthy)
95 (Very Unhealthy)
58 (Unhealthy)
co
726 (Good)
715 (Good)
828 (Good)
844 (Good)
1 (Good)
1 (Good)
892 (Good)
929 (Good)
834 (Good)
773 (Good)
725 (Good)
634 (Good)
609 (Good)
708 (Good)
661 (Good)
929 (Good)
1 (Good)
831 (Good)
878 (Good)
610 (Good)
no2
21 (Good)
32 (Good)
33 (Good)
18 (Good)
35 (Good)
46 (Moderate)
45 (Moderate)
39 (Good)
29 (Good)
22 (Good)
20 (Good)
20 (Good)
26 (Good)
32 (Good)
38 (Good)
31 (Good)
54 (Moderate)
48 (Moderate)
50 (Moderate)
55 (Moderate)
o3
133 (Unhealthy for Sensitive Groups)
144 (Unhealthy for Sensitive Groups)
109 (Moderate)
94 (Moderate)
77 (Moderate)
62 (Good)
99 (Moderate)
125 (Unhealthy for Sensitive Groups)
172 (Unhealthy)
140 (Unhealthy for Sensitive Groups)
172 (Unhealthy)
195 (Very Unhealthy)
169 (Unhealthy)
141 (Unhealthy for Sensitive Groups)
125 (Unhealthy for Sensitive Groups)
100 (Moderate)
67 (Good)
48 (Good)
88 (Moderate)
106 (Moderate)
pm10
58 (Unhealthy for Sensitive Groups)
66 (Unhealthy for Sensitive Groups)
70 (Unhealthy for Sensitive Groups)
61 (Unhealthy for Sensitive Groups)
110 (Very Unhealthy)
90 (Unhealthy)
103 (Unhealthy)
92 (Unhealthy)
59 (Unhealthy for Sensitive Groups)
43 (Moderate)
48 (Moderate)
65 (Unhealthy for Sensitive Groups)
75 (Unhealthy for Sensitive Groups)
72 (Unhealthy for Sensitive Groups)
91 (Unhealthy)
110 (Very Unhealthy)
124 (Very Unhealthy)
111 (Very Unhealthy)
116 (Very Unhealthy)
90 (Unhealthy)
so2
8.7 (Good)
9.3 (Good)
9.9 (Good)
6.9 (Good)
6.8 (Good)
7.8 (Good)
9.9 (Good)
8.3 (Good)
7.7 (Good)
7.6 (Good)
6.8 (Good)
8.4 (Good)
13 (Good)
12 (Good)
12 (Good)
10 (Good)
12 (Good)
9.6 (Good)
5.5 (Good)
11 (Good)
data source »
淮塔
Friday, May 27, 2022, 12:00 PM
PM10 179 (Very bad Hazardous)
particulate matter (PM10) suspended dust
PM2,5 35 (Unhealthy for Sensitive Groups)
particulate matter (PM2.5) dust
O3 0.04 (Good)
ozone (O3)
NO2 0 (Good)
nitrogen dioxide (NO2)
SO2 0 (Good)
sulfur dioxide (SO2)
淮塔
index
2022-05-27
pm10
56
pm25
56
o3
0.03
no2
0
so2
0
淮塔
2018-10 2020-05

index
2020-05
2020-04
2020-03
2020-02
2020-01
2019-12
2019-11
2019-10
2019-09
2019-08
2019-07
2019-06
2019-05
2019-04
2019-03
2019-02
2019-01
2018-12
2018-11
2018-10
pm25
33
39
49
58
111
84
67
55
36
25
32
37
39
52
61
94
102
79
95
58
co
726
715
828
844
1
1
892
929
834
773
725
634
609
708
661
929
1
831
878
610
no2
21
32
33
18
35
46
45
39
29
22
20
20
26
32
38
31
54
48
50
55
o3
133
144
109
94
77
62
99
125
172
140
172
195
169
141
125
100
67
48
88
106
pm10
58
66
70
61
110
90
103
92
59
43
48
65
75
72
91
110
124
111
116
90
so2
8.7
9.3
9.9
6.9
6.8
7.8
9.9
8.3
7.7
7.6
6.8
8.4
13
12
12
10
12
9.6
5.5
11
* Pollution data source:
https://openaq.org
(ChinaAQIData)
The data is licensed under CC-By 4.0
PM10 179 (Very bad Hazardous)
PM2,5 35 (Unhealthy for Sensitive Groups)
O3 0 (Good)
NO2 0 (Good)
SO2 0 (Good)
Data on air pollution from recent days in Kuishan
| index | 2022-05-27 |
|---|---|
| pm10 | 56 Unhealthy for Sensitive Groups |
| pm25 | 56 Unhealthy |
| o3 | 0 Good |
| no2 | 0 Good |
| so2 | 0 Good |

| index | 2020-05 | 2020-04 | 2020-03 | 2020-02 | 2020-01 | 2019-12 | 2019-11 | 2019-10 | 2019-09 | 2019-08 | 2019-07 | 2019-06 | 2019-05 | 2019-04 | 2019-03 | 2019-02 | 2019-01 | 2018-12 | 2018-11 | 2018-10 |
|---|---|---|---|---|---|---|---|---|---|---|---|---|---|---|---|---|---|---|---|---|
| pm25 | 33 (Moderate) | 39 (Unhealthy for Sensitive Groups) | 49 (Unhealthy for Sensitive Groups) | 58 (Unhealthy) | 111 (Very bad Hazardous) | 84 (Very Unhealthy) | 67 (Unhealthy) | 55 (Unhealthy) | 36 (Unhealthy for Sensitive Groups) | 25 (Moderate) | 32 (Moderate) | 37 (Unhealthy for Sensitive Groups) | 39 (Unhealthy for Sensitive Groups) | 52 (Unhealthy for Sensitive Groups) | 61 (Unhealthy) | 94 (Very Unhealthy) | 102 (Very Unhealthy) | 79 (Very Unhealthy) | 95 (Very Unhealthy) | 58 (Unhealthy) |
| co | 726 (Good) | 715 (Good) | 828 (Good) | 844 (Good) | 1 (Good) | 1 (Good) | 892 (Good) | 929 (Good) | 834 (Good) | 773 (Good) | 725 (Good) | 634 (Good) | 609 (Good) | 708 (Good) | 661 (Good) | 929 (Good) | 1 (Good) | 831 (Good) | 878 (Good) | 610 (Good) |
| no2 | 21 (Good) | 32 (Good) | 33 (Good) | 18 (Good) | 35 (Good) | 46 (Moderate) | 45 (Moderate) | 39 (Good) | 29 (Good) | 22 (Good) | 20 (Good) | 20 (Good) | 26 (Good) | 32 (Good) | 38 (Good) | 31 (Good) | 54 (Moderate) | 48 (Moderate) | 50 (Moderate) | 55 (Moderate) |
| o3 | 133 (Unhealthy for Sensitive Groups) | 144 (Unhealthy for Sensitive Groups) | 109 (Moderate) | 94 (Moderate) | 77 (Moderate) | 62 (Good) | 99 (Moderate) | 125 (Unhealthy for Sensitive Groups) | 172 (Unhealthy) | 140 (Unhealthy for Sensitive Groups) | 172 (Unhealthy) | 195 (Very Unhealthy) | 169 (Unhealthy) | 141 (Unhealthy for Sensitive Groups) | 125 (Unhealthy for Sensitive Groups) | 100 (Moderate) | 67 (Good) | 48 (Good) | 88 (Moderate) | 106 (Moderate) |
| pm10 | 58 (Unhealthy for Sensitive Groups) | 66 (Unhealthy for Sensitive Groups) | 70 (Unhealthy for Sensitive Groups) | 61 (Unhealthy for Sensitive Groups) | 110 (Very Unhealthy) | 90 (Unhealthy) | 103 (Unhealthy) | 92 (Unhealthy) | 59 (Unhealthy for Sensitive Groups) | 43 (Moderate) | 48 (Moderate) | 65 (Unhealthy for Sensitive Groups) | 75 (Unhealthy for Sensitive Groups) | 72 (Unhealthy for Sensitive Groups) | 91 (Unhealthy) | 110 (Very Unhealthy) | 124 (Very Unhealthy) | 111 (Very Unhealthy) | 116 (Very Unhealthy) | 90 (Unhealthy) |
| so2 | 8.7 (Good) | 9.3 (Good) | 9.9 (Good) | 6.9 (Good) | 6.8 (Good) | 7.8 (Good) | 9.9 (Good) | 8.3 (Good) | 7.7 (Good) | 7.6 (Good) | 6.8 (Good) | 8.4 (Good) | 13 (Good) | 12 (Good) | 12 (Good) | 10 (Good) | 12 (Good) | 9.6 (Good) | 5.5 (Good) | 11 (Good) |
PM10 179 (Very bad Hazardous)
particulate matter (PM10) suspended dustPM2,5 35 (Unhealthy for Sensitive Groups)
particulate matter (PM2.5) dustO3 0.04 (Good)
ozone (O3)NO2 0 (Good)
nitrogen dioxide (NO2)SO2 0 (Good)
sulfur dioxide (SO2)淮塔
| index | 2022-05-27 |
|---|---|
| pm10 | 56 |
| pm25 | 56 |
| o3 | 0.03 |
| no2 | 0 |
| so2 | 0 |
淮塔
| index | 2020-05 | 2020-04 | 2020-03 | 2020-02 | 2020-01 | 2019-12 | 2019-11 | 2019-10 | 2019-09 | 2019-08 | 2019-07 | 2019-06 | 2019-05 | 2019-04 | 2019-03 | 2019-02 | 2019-01 | 2018-12 | 2018-11 | 2018-10 |
|---|---|---|---|---|---|---|---|---|---|---|---|---|---|---|---|---|---|---|---|---|
| pm25 | 33 | 39 | 49 | 58 | 111 | 84 | 67 | 55 | 36 | 25 | 32 | 37 | 39 | 52 | 61 | 94 | 102 | 79 | 95 | 58 |
| co | 726 | 715 | 828 | 844 | 1 | 1 | 892 | 929 | 834 | 773 | 725 | 634 | 609 | 708 | 661 | 929 | 1 | 831 | 878 | 610 |
| no2 | 21 | 32 | 33 | 18 | 35 | 46 | 45 | 39 | 29 | 22 | 20 | 20 | 26 | 32 | 38 | 31 | 54 | 48 | 50 | 55 |
| o3 | 133 | 144 | 109 | 94 | 77 | 62 | 99 | 125 | 172 | 140 | 172 | 195 | 169 | 141 | 125 | 100 | 67 | 48 | 88 | 106 |
| pm10 | 58 | 66 | 70 | 61 | 110 | 90 | 103 | 92 | 59 | 43 | 48 | 65 | 75 | 72 | 91 | 110 | 124 | 111 | 116 | 90 |
| so2 | 8.7 | 9.3 | 9.9 | 6.9 | 6.8 | 7.8 | 9.9 | 8.3 | 7.7 | 7.6 | 6.8 | 8.4 | 13 | 12 | 12 | 10 | 12 | 9.6 | 5.5 | 11 |