Air Pollution in Kunming: Real-time Air Quality Index and smog alert.
Pollution and air quality forecast for Kunming. Today is Tuesday, June 16, 2026. The following air pollution values have been recorded for Kunming:- particulate matter (PM2.5) dust - 61 (Unhealthy)
- nitrogen dioxide (NO2) - 22 (Good)
- particulate matter (PM10) suspended dust - 69 (Unhealthy for Sensitive Groups)
- carbon monoxide (CO) - 219 (Good)
- ozone (O3) - 0 (Good)
- sulfur dioxide (SO2) - 8 (Good)

What is the air quality in Kunming today? Is the air polluted in Kunming?. Is there smog?
What is the current level of PM2.5 in Kunming? (particulate matter (PM2.5) dust)
Today's PM2.5 level is:
61 (Unhealthy)
For comparison, the highest level of PM2.5 in Kunming in the last 7 days was: 28 (Friday, May 27, 2022) and the lowest: 28 (Friday, May 27, 2022).
The highest PM2.5 values were recorded: 39 (April 2019).
The lowest level of particulate matter PM2.5 pollution occurs in month: July (14).
How high is the level of NO2? (nitrogen dioxide (NO2))
22 (Good)
What is the level of PM10 today in Kunming? (particulate matter (PM10) suspended dust)
The current level of particulate matter PM10 in Kunming is:
69 (Unhealthy for Sensitive Groups)
The highest PM10 values usually occur in month: 63 (April 2019).
The lowest value of particulate matter PM10 pollution in Kunming is usually recorded in: July (25).
How high is the CO level? (carbon monoxide (CO))
219 (Good)
How is the O3 level today in Kunming? (ozone (O3))
0 (Good)
What is the level of SO2 pollution? (sulfur dioxide (SO2))
8 (Good)
Current data Friday, May 27, 2022, 3:00 PM
PM2,5 61 (Unhealthy)
NO2 22 (Good)
PM10 69 (Unhealthy for Sensitive Groups)
CO 219 (Good)
O3 0 (Good)
SO2 8 (Good)
Data on air pollution from recent days in Kunming
index
2022-05-27
pm25
28
Moderate
no2
22
Good
pm10
35
Moderate
co
579
Good
o3
22
Good
so2
5
Good
data source »
Air pollution in Kunming from October 2018 to May 2020
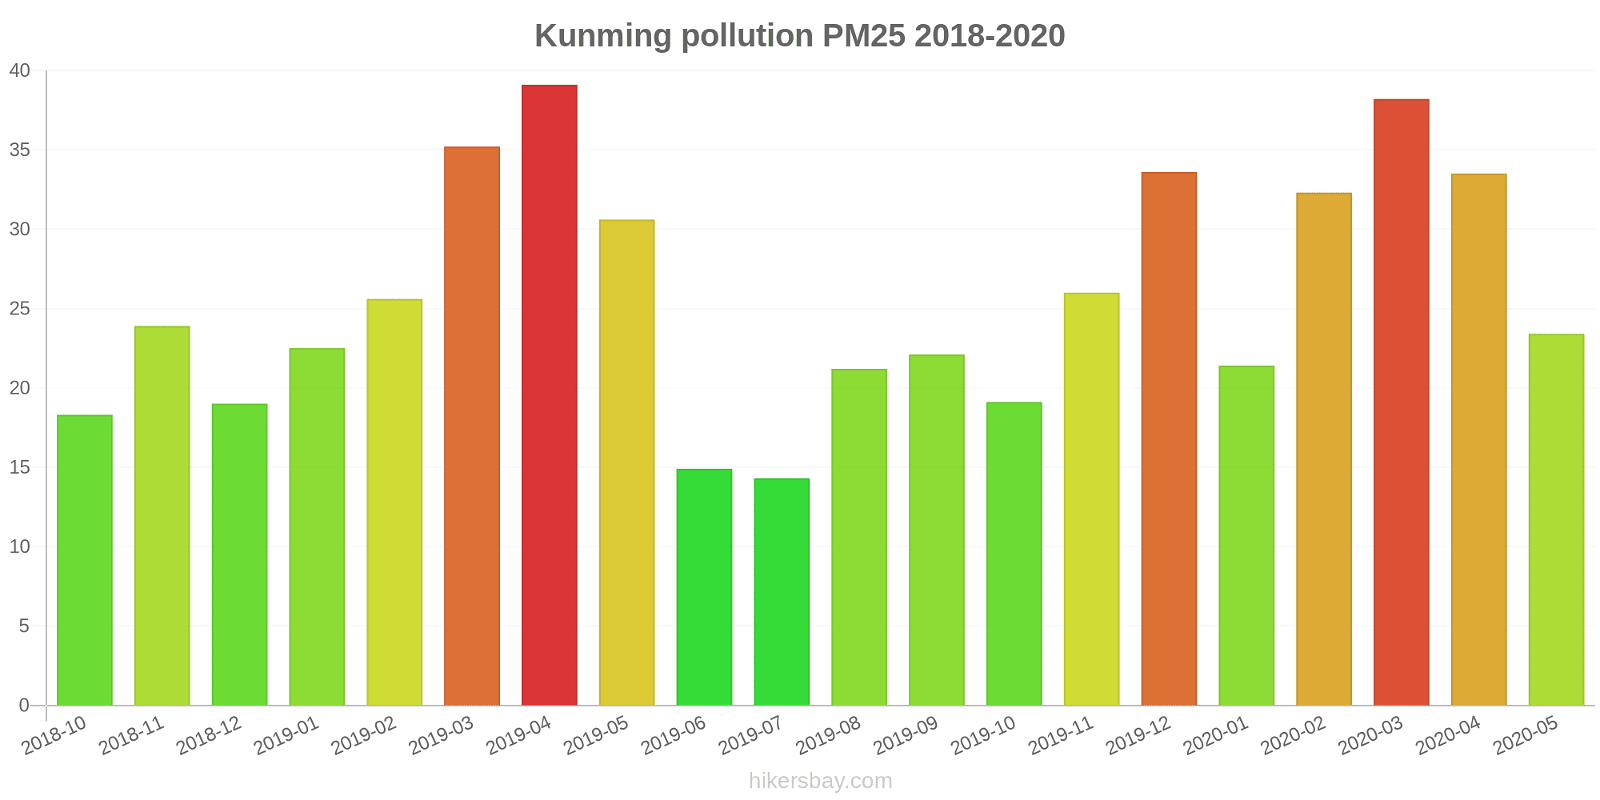
index
2020-05
2020-04
2020-03
2020-02
2020-01
2019-12
2019-11
2019-10
2019-09
2019-08
2019-07
2019-06
2019-05
2019-04
2019-03
2019-02
2019-01
2018-12
2018-11
2018-10
pm25
23 (Moderate)
34 (Moderate)
38 (Unhealthy for Sensitive Groups)
32 (Moderate)
21 (Moderate)
34 (Moderate)
26 (Moderate)
19 (Moderate)
22 (Moderate)
21 (Moderate)
14 (Moderate)
15 (Moderate)
31 (Moderate)
39 (Unhealthy for Sensitive Groups)
35 (Unhealthy for Sensitive Groups)
26 (Moderate)
23 (Moderate)
19 (Moderate)
24 (Moderate)
18 (Moderate)
co
616 (Good)
769 (Good)
763 (Good)
689 (Good)
708 (Good)
943 (Good)
862 (Good)
719 (Good)
620 (Good)
619 (Good)
665 (Good)
622 (Good)
610 (Good)
742 (Good)
791 (Good)
706 (Good)
939 (Good)
879 (Good)
793 (Good)
750 (Good)
no2
29 (Good)
29 (Good)
32 (Good)
14 (Good)
26 (Good)
43 (Moderate)
38 (Good)
33 (Good)
30 (Good)
28 (Good)
26 (Good)
24 (Good)
27 (Good)
33 (Good)
33 (Good)
25 (Good)
35 (Good)
32 (Good)
40 (Good)
30 (Good)
o3
126 (Unhealthy for Sensitive Groups)
121 (Unhealthy for Sensitive Groups)
119 (Moderate)
102 (Moderate)
75 (Moderate)
71 (Moderate)
73 (Moderate)
82 (Moderate)
92 (Moderate)
113 (Moderate)
76 (Moderate)
98 (Moderate)
142 (Unhealthy for Sensitive Groups)
133 (Unhealthy for Sensitive Groups)
107 (Moderate)
96 (Moderate)
77 (Moderate)
66 (Good)
78 (Moderate)
73 (Moderate)
pm10
47 (Moderate)
57 (Unhealthy for Sensitive Groups)
61 (Unhealthy for Sensitive Groups)
40 (Moderate)
33 (Moderate)
57 (Unhealthy for Sensitive Groups)
45 (Moderate)
33 (Moderate)
36 (Moderate)
37 (Moderate)
25 (Moderate)
27 (Moderate)
57 (Unhealthy for Sensitive Groups)
63 (Unhealthy for Sensitive Groups)
59 (Unhealthy for Sensitive Groups)
44 (Moderate)
41 (Moderate)
38 (Moderate)
49 (Moderate)
40 (Moderate)
so2
10 (Good)
9.3 (Good)
9.2 (Good)
9.7 (Good)
11 (Good)
11 (Good)
14 (Good)
11 (Good)
8.9 (Good)
8.4 (Good)
6.5 (Good)
7 (Good)
10 (Good)
17 (Good)
16 (Good)
16 (Good)
12 (Good)
12 (Good)
12 (Good)
11 (Good)
data source »
Quality of life in Kunming
Green and Parks in the City
Kunming
84%
Mongolia: 27%
Bhutan: 82%
Hong Kong: 52%
Myanmar: 33%
particulate matter PM2.5
Kunming
28 (Moderate)
Pleasure of spending time in the city
Kunming
65%
Mongolia: 22%
Bhutan: 61%
Hong Kong: 43%
Myanmar: 24%
particulate matter PM10
Kunming
55 (Unhealthy for Sensitive Groups)
Air Pollution
Kunming
38%
Mongolia: 87%
Bhutan: 45%
Hong Kong: 67%
Myanmar: 83%
Garbage Disposal
Kunming
66%
Mongolia: 27%
Bhutan: 47%
Hong Kong: 52%
Myanmar: 12%
Availability and quality of drinking water
Kunming
65%
Mongolia: 46%
Bhutan: 64%
Hong Kong: 66%
Myanmar: 34%
Cleanliness and tidiness
Kunming
73%
Mongolia: 29%
Bhutan: 57%
Hong Kong: 54%
Myanmar: 18%
Noise and Light pollution
Kunming
48%
Mongolia: 48%
Bhutan: 55%
Hong Kong: 66%
Myanmar: 52%
Water Pollution
Kunming
73%
Mongolia: 68%
Bhutan: 56%
Hong Kong: 53%
Myanmar: 74%
Source: Numbeo
东风东路
Friday, May 27, 2022, 3:00 PM
PM2,5 61 (Unhealthy)
particulate matter (PM2.5) dust
NO2 22 (Good)
nitrogen dioxide (NO2)
PM10 69 (Unhealthy for Sensitive Groups)
particulate matter (PM10) suspended dust
CO 219 (Good)
carbon monoxide (CO)
O3 0.05 (Good)
ozone (O3)
SO2 7.7 (Good)
sulfur dioxide (SO2)
东风东路
index
2022-05-27
pm25
28
no2
22
pm10
35
co
579
o3
22
so2
4.6
东风东路
2018-10 2020-05

index
2020-05
2020-04
2020-03
2020-02
2020-01
2019-12
2019-11
2019-10
2019-09
2019-08
2019-07
2019-06
2019-05
2019-04
2019-03
2019-02
2019-01
2018-12
2018-11
2018-10
pm25
23
34
38
32
21
34
26
19
22
21
14
15
31
39
35
26
23
19
24
18
co
616
769
763
689
708
943
862
719
620
619
665
622
610
742
791
706
939
879
793
750
no2
29
29
32
14
26
43
38
33
30
28
26
24
27
33
33
25
35
32
40
30
o3
126
121
119
102
75
71
73
82
92
113
76
98
142
133
107
96
77
66
78
73
pm10
47
57
61
40
33
57
45
33
36
37
25
27
57
63
59
44
41
38
49
40
so2
10
9.3
9.2
9.7
11
11
14
11
8.9
8.4
6.5
7
10
17
16
16
12
12
12
11
* Pollution data source:
https://openaq.org
(ChinaAQIData)
The data is licensed under CC-By 4.0
PM2,5 61 (Unhealthy)
NO2 22 (Good)
PM10 69 (Unhealthy for Sensitive Groups)
CO 219 (Good)
O3 0 (Good)
SO2 8 (Good)
Data on air pollution from recent days in Kunming
| index | 2022-05-27 |
|---|---|
| pm25 | 28 Moderate |
| no2 | 22 Good |
| pm10 | 35 Moderate |
| co | 579 Good |
| o3 | 22 Good |
| so2 | 5 Good |

| index | 2020-05 | 2020-04 | 2020-03 | 2020-02 | 2020-01 | 2019-12 | 2019-11 | 2019-10 | 2019-09 | 2019-08 | 2019-07 | 2019-06 | 2019-05 | 2019-04 | 2019-03 | 2019-02 | 2019-01 | 2018-12 | 2018-11 | 2018-10 |
|---|---|---|---|---|---|---|---|---|---|---|---|---|---|---|---|---|---|---|---|---|
| pm25 | 23 (Moderate) | 34 (Moderate) | 38 (Unhealthy for Sensitive Groups) | 32 (Moderate) | 21 (Moderate) | 34 (Moderate) | 26 (Moderate) | 19 (Moderate) | 22 (Moderate) | 21 (Moderate) | 14 (Moderate) | 15 (Moderate) | 31 (Moderate) | 39 (Unhealthy for Sensitive Groups) | 35 (Unhealthy for Sensitive Groups) | 26 (Moderate) | 23 (Moderate) | 19 (Moderate) | 24 (Moderate) | 18 (Moderate) |
| co | 616 (Good) | 769 (Good) | 763 (Good) | 689 (Good) | 708 (Good) | 943 (Good) | 862 (Good) | 719 (Good) | 620 (Good) | 619 (Good) | 665 (Good) | 622 (Good) | 610 (Good) | 742 (Good) | 791 (Good) | 706 (Good) | 939 (Good) | 879 (Good) | 793 (Good) | 750 (Good) |
| no2 | 29 (Good) | 29 (Good) | 32 (Good) | 14 (Good) | 26 (Good) | 43 (Moderate) | 38 (Good) | 33 (Good) | 30 (Good) | 28 (Good) | 26 (Good) | 24 (Good) | 27 (Good) | 33 (Good) | 33 (Good) | 25 (Good) | 35 (Good) | 32 (Good) | 40 (Good) | 30 (Good) |
| o3 | 126 (Unhealthy for Sensitive Groups) | 121 (Unhealthy for Sensitive Groups) | 119 (Moderate) | 102 (Moderate) | 75 (Moderate) | 71 (Moderate) | 73 (Moderate) | 82 (Moderate) | 92 (Moderate) | 113 (Moderate) | 76 (Moderate) | 98 (Moderate) | 142 (Unhealthy for Sensitive Groups) | 133 (Unhealthy for Sensitive Groups) | 107 (Moderate) | 96 (Moderate) | 77 (Moderate) | 66 (Good) | 78 (Moderate) | 73 (Moderate) |
| pm10 | 47 (Moderate) | 57 (Unhealthy for Sensitive Groups) | 61 (Unhealthy for Sensitive Groups) | 40 (Moderate) | 33 (Moderate) | 57 (Unhealthy for Sensitive Groups) | 45 (Moderate) | 33 (Moderate) | 36 (Moderate) | 37 (Moderate) | 25 (Moderate) | 27 (Moderate) | 57 (Unhealthy for Sensitive Groups) | 63 (Unhealthy for Sensitive Groups) | 59 (Unhealthy for Sensitive Groups) | 44 (Moderate) | 41 (Moderate) | 38 (Moderate) | 49 (Moderate) | 40 (Moderate) |
| so2 | 10 (Good) | 9.3 (Good) | 9.2 (Good) | 9.7 (Good) | 11 (Good) | 11 (Good) | 14 (Good) | 11 (Good) | 8.9 (Good) | 8.4 (Good) | 6.5 (Good) | 7 (Good) | 10 (Good) | 17 (Good) | 16 (Good) | 16 (Good) | 12 (Good) | 12 (Good) | 12 (Good) | 11 (Good) |
Green and Parks in the City
Kunming 84%
Mongolia: 27% Bhutan: 82% Hong Kong: 52% Myanmar: 33%particulate matter PM2.5
Kunming 28 (Moderate)
Pleasure of spending time in the city
Kunming 65%
Mongolia: 22% Bhutan: 61% Hong Kong: 43% Myanmar: 24%particulate matter PM10
Kunming 55 (Unhealthy for Sensitive Groups)
Air Pollution
Kunming 38%
Mongolia: 87% Bhutan: 45% Hong Kong: 67% Myanmar: 83%Garbage Disposal
Kunming 66%
Mongolia: 27% Bhutan: 47% Hong Kong: 52% Myanmar: 12%Availability and quality of drinking water
Kunming 65%
Mongolia: 46% Bhutan: 64% Hong Kong: 66% Myanmar: 34%Cleanliness and tidiness
Kunming 73%
Mongolia: 29% Bhutan: 57% Hong Kong: 54% Myanmar: 18%Noise and Light pollution
Kunming 48%
Mongolia: 48% Bhutan: 55% Hong Kong: 66% Myanmar: 52%Water Pollution
Kunming 73%
Mongolia: 68% Bhutan: 56% Hong Kong: 53% Myanmar: 74%PM2,5 61 (Unhealthy)
particulate matter (PM2.5) dustNO2 22 (Good)
nitrogen dioxide (NO2)PM10 69 (Unhealthy for Sensitive Groups)
particulate matter (PM10) suspended dustCO 219 (Good)
carbon monoxide (CO)O3 0.05 (Good)
ozone (O3)SO2 7.7 (Good)
sulfur dioxide (SO2)东风东路
| index | 2022-05-27 |
|---|---|
| pm25 | 28 |
| no2 | 22 |
| pm10 | 35 |
| co | 579 |
| o3 | 22 |
| so2 | 4.6 |
东风东路

| index | 2020-05 | 2020-04 | 2020-03 | 2020-02 | 2020-01 | 2019-12 | 2019-11 | 2019-10 | 2019-09 | 2019-08 | 2019-07 | 2019-06 | 2019-05 | 2019-04 | 2019-03 | 2019-02 | 2019-01 | 2018-12 | 2018-11 | 2018-10 |
|---|---|---|---|---|---|---|---|---|---|---|---|---|---|---|---|---|---|---|---|---|
| pm25 | 23 | 34 | 38 | 32 | 21 | 34 | 26 | 19 | 22 | 21 | 14 | 15 | 31 | 39 | 35 | 26 | 23 | 19 | 24 | 18 |
| co | 616 | 769 | 763 | 689 | 708 | 943 | 862 | 719 | 620 | 619 | 665 | 622 | 610 | 742 | 791 | 706 | 939 | 879 | 793 | 750 |
| no2 | 29 | 29 | 32 | 14 | 26 | 43 | 38 | 33 | 30 | 28 | 26 | 24 | 27 | 33 | 33 | 25 | 35 | 32 | 40 | 30 |
| o3 | 126 | 121 | 119 | 102 | 75 | 71 | 73 | 82 | 92 | 113 | 76 | 98 | 142 | 133 | 107 | 96 | 77 | 66 | 78 | 73 |
| pm10 | 47 | 57 | 61 | 40 | 33 | 57 | 45 | 33 | 36 | 37 | 25 | 27 | 57 | 63 | 59 | 44 | 41 | 38 | 49 | 40 |
| so2 | 10 | 9.3 | 9.2 | 9.7 | 11 | 11 | 14 | 11 | 8.9 | 8.4 | 6.5 | 7 | 10 | 17 | 16 | 16 | 12 | 12 | 12 | 11 |