Air Pollution in Lanzhou Shi: Real-time Air Quality Index and smog alert.
Pollution and air quality forecast for Lanzhou Shi. Today is Tuesday, June 2, 2026. The following air pollution values have been recorded for Lanzhou Shi:- particulate matter (PM10) suspended dust - 179 (Very bad Hazardous)
- particulate matter (PM2.5) dust - 35 (Unhealthy for Sensitive Groups)
- ozone (O3) - 0 (Good)
- nitrogen dioxide (NO2) - 0 (Good)
- sulfur dioxide (SO2) - 0 (Good)

What is the air quality in Lanzhou Shi today? Is the air polluted in Lanzhou Shi?. Is there smog?
What is the level of PM10 today in Lanzhou Shi? (particulate matter (PM10) suspended dust)
The current level of particulate matter PM10 in Lanzhou Shi is:
179 (Very bad Hazardous)
The highest PM10 values usually occur in month: 175 (November 2018).
The lowest value of particulate matter PM10 pollution in Lanzhou Shi is usually recorded in: June (50).
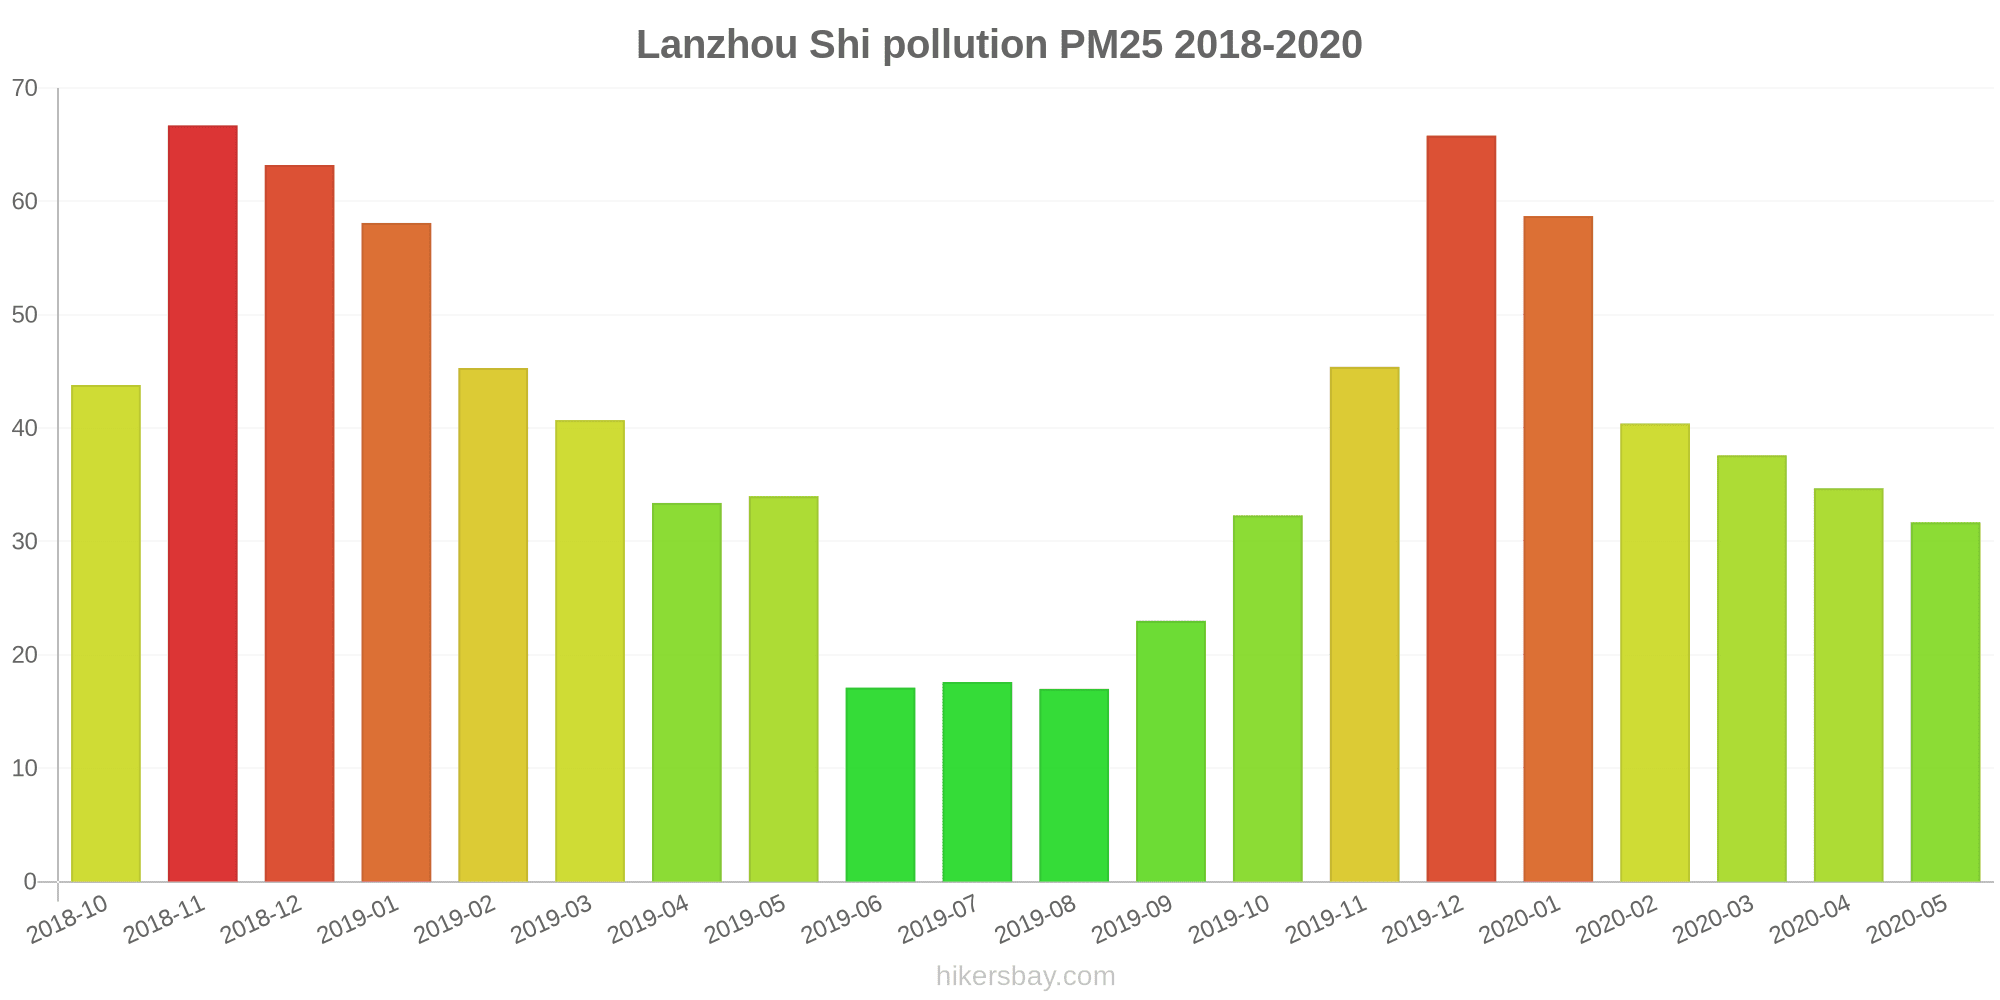
What is the current level of PM2.5 in Lanzhou Shi? (particulate matter (PM2.5) dust)
Today's PM2.5 level is:
35 (Unhealthy for Sensitive Groups)
For comparison, the highest level of PM2.5 in Lanzhou Shi in the last 7 days was: 56 (Friday, May 27, 2022) and the lowest: 56 (Friday, May 27, 2022).
The highest PM2.5 values were recorded: 67 (November 2018).
The lowest level of particulate matter PM2.5 pollution occurs in month: August (17).
How is the O3 level today in Lanzhou Shi? (ozone (O3))
0 (Good)
How high is the level of NO2? (nitrogen dioxide (NO2))
0 (Good)
What is the level of SO2 pollution? (sulfur dioxide (SO2))
0 (Good)
Current data Friday, May 27, 2022, 12:00 PM
PM10 179 (Very bad Hazardous)
PM2,5 35 (Unhealthy for Sensitive Groups)
O3 0 (Good)
NO2 0 (Good)
SO2 0 (Good)
Data on air pollution from recent days in Lanzhou Shi
index
2022-05-27
pm10
56
Unhealthy for Sensitive Groups
pm25
56
Unhealthy
o3
0
Good
no2
0
Good
so2
0
Good
data source »
Air pollution in Lanzhou Shi from October 2018 to May 2020

index
2020-05
2020-04
2020-03
2020-02
2020-01
2019-12
2019-11
2019-10
2019-09
2019-08
2019-07
2019-06
2019-05
2019-04
2019-03
2019-02
2019-01
2018-12
2018-11
2018-10
pm25
32 (Moderate)
35 (Moderate)
38 (Unhealthy for Sensitive Groups)
40 (Unhealthy for Sensitive Groups)
59 (Unhealthy)
66 (Unhealthy)
45 (Unhealthy for Sensitive Groups)
32 (Moderate)
23 (Moderate)
17 (Moderate)
18 (Moderate)
17 (Moderate)
34 (Moderate)
33 (Moderate)
41 (Unhealthy for Sensitive Groups)
45 (Unhealthy for Sensitive Groups)
58 (Unhealthy)
63 (Unhealthy)
67 (Unhealthy)
44 (Unhealthy for Sensitive Groups)
co
581 (Good)
931 (Good)
1 (Good)
1 (Good)
2 (Good)
2 (Good)
1 (Good)
1 (Good)
1 (Good)
1 (Good)
924 (Good)
785 (Good)
721 (Good)
887 (Good)
1 (Good)
1 (Good)
2 (Good)
1 (Good)
1 (Good)
963 (Good)
no2
53 (Moderate)
52 (Moderate)
55 (Moderate)
56 (Moderate)
75 (Moderate)
93 (Moderate)
69 (Moderate)
59 (Moderate)
53 (Moderate)
54 (Moderate)
54 (Moderate)
49 (Moderate)
47 (Moderate)
59 (Moderate)
66 (Moderate)
53 (Moderate)
70 (Moderate)
62 (Moderate)
66 (Moderate)
56 (Moderate)
o3
144 (Unhealthy for Sensitive Groups)
121 (Unhealthy for Sensitive Groups)
109 (Moderate)
100 (Moderate)
66 (Good)
49 (Good)
56 (Good)
70 (Good)
113 (Moderate)
144 (Unhealthy for Sensitive Groups)
151 (Unhealthy)
130 (Unhealthy for Sensitive Groups)
126 (Unhealthy for Sensitive Groups)
136 (Unhealthy for Sensitive Groups)
105 (Moderate)
76 (Moderate)
49 (Good)
34 (Good)
47 (Good)
76 (Moderate)
pm10
91 (Unhealthy)
102 (Unhealthy)
104 (Unhealthy)
94 (Unhealthy)
91 (Unhealthy)
126 (Very Unhealthy)
99 (Unhealthy)
73 (Unhealthy for Sensitive Groups)
56 (Unhealthy for Sensitive Groups)
53 (Unhealthy for Sensitive Groups)
57 (Unhealthy for Sensitive Groups)
50 (Unhealthy for Sensitive Groups)
118 (Very Unhealthy)
90 (Unhealthy)
107 (Unhealthy)
101 (Unhealthy)
104 (Unhealthy)
138 (Very Unhealthy)
175 (Very bad Hazardous)
108 (Unhealthy)
so2
11 (Good)
15 (Good)
15 (Good)
25 (Good)
27 (Good)
41 (Good)
21 (Good)
16 (Good)
13 (Good)
12 (Good)
11 (Good)
11 (Good)
10 (Good)
15 (Good)
20 (Good)
27 (Good)
42 (Good)
40 (Good)
35 (Good)
20 (Good)
data source »
Quality of life in Lanzhou Shi
Green and Parks in the City
Lanzhou Shi
58%
Mongolia: 27%
Bhutan: 82%
Hong Kong: 52%
Myanmar: 33%
particulate matter PM2.5
Lanzhou Shi
54 (Unhealthy for Sensitive Groups)
Pleasure of spending time in the city
Lanzhou Shi
45%
Mongolia: 22%
Bhutan: 61%
Hong Kong: 43%
Myanmar: 24%
particulate matter PM10
Lanzhou Shi
130 (Very Unhealthy)
Air Pollution
Lanzhou Shi
68%
Mongolia: 87%
Bhutan: 45%
Hong Kong: 67%
Myanmar: 83%
Garbage Disposal
Lanzhou Shi
83%
Mongolia: 27%
Bhutan: 47%
Hong Kong: 52%
Myanmar: 12%
Availability and quality of drinking water
Lanzhou Shi
75%
Mongolia: 46%
Bhutan: 64%
Hong Kong: 66%
Myanmar: 34%
Cleanliness and tidiness
Lanzhou Shi
75%
Mongolia: 29%
Bhutan: 57%
Hong Kong: 54%
Myanmar: 18%
Noise and Light pollution
Lanzhou Shi
8.3%
Mongolia: 48%
Bhutan: 55%
Hong Kong: 66%
Myanmar: 52%
Water Pollution
Lanzhou Shi
33%
Mongolia: 68%
Bhutan: 56%
Hong Kong: 53%
Myanmar: 74%
Source: Numbeo
铁路设计院
Friday, May 27, 2022, 12:00 PM
PM10 179 (Very bad Hazardous)
particulate matter (PM10) suspended dust
PM2,5 35 (Unhealthy for Sensitive Groups)
particulate matter (PM2.5) dust
O3 0.04 (Good)
ozone (O3)
NO2 0 (Good)
nitrogen dioxide (NO2)
SO2 0 (Good)
sulfur dioxide (SO2)
铁路设计院
index
2022-05-27
pm10
56
pm25
56
o3
0.03
no2
0
so2
0
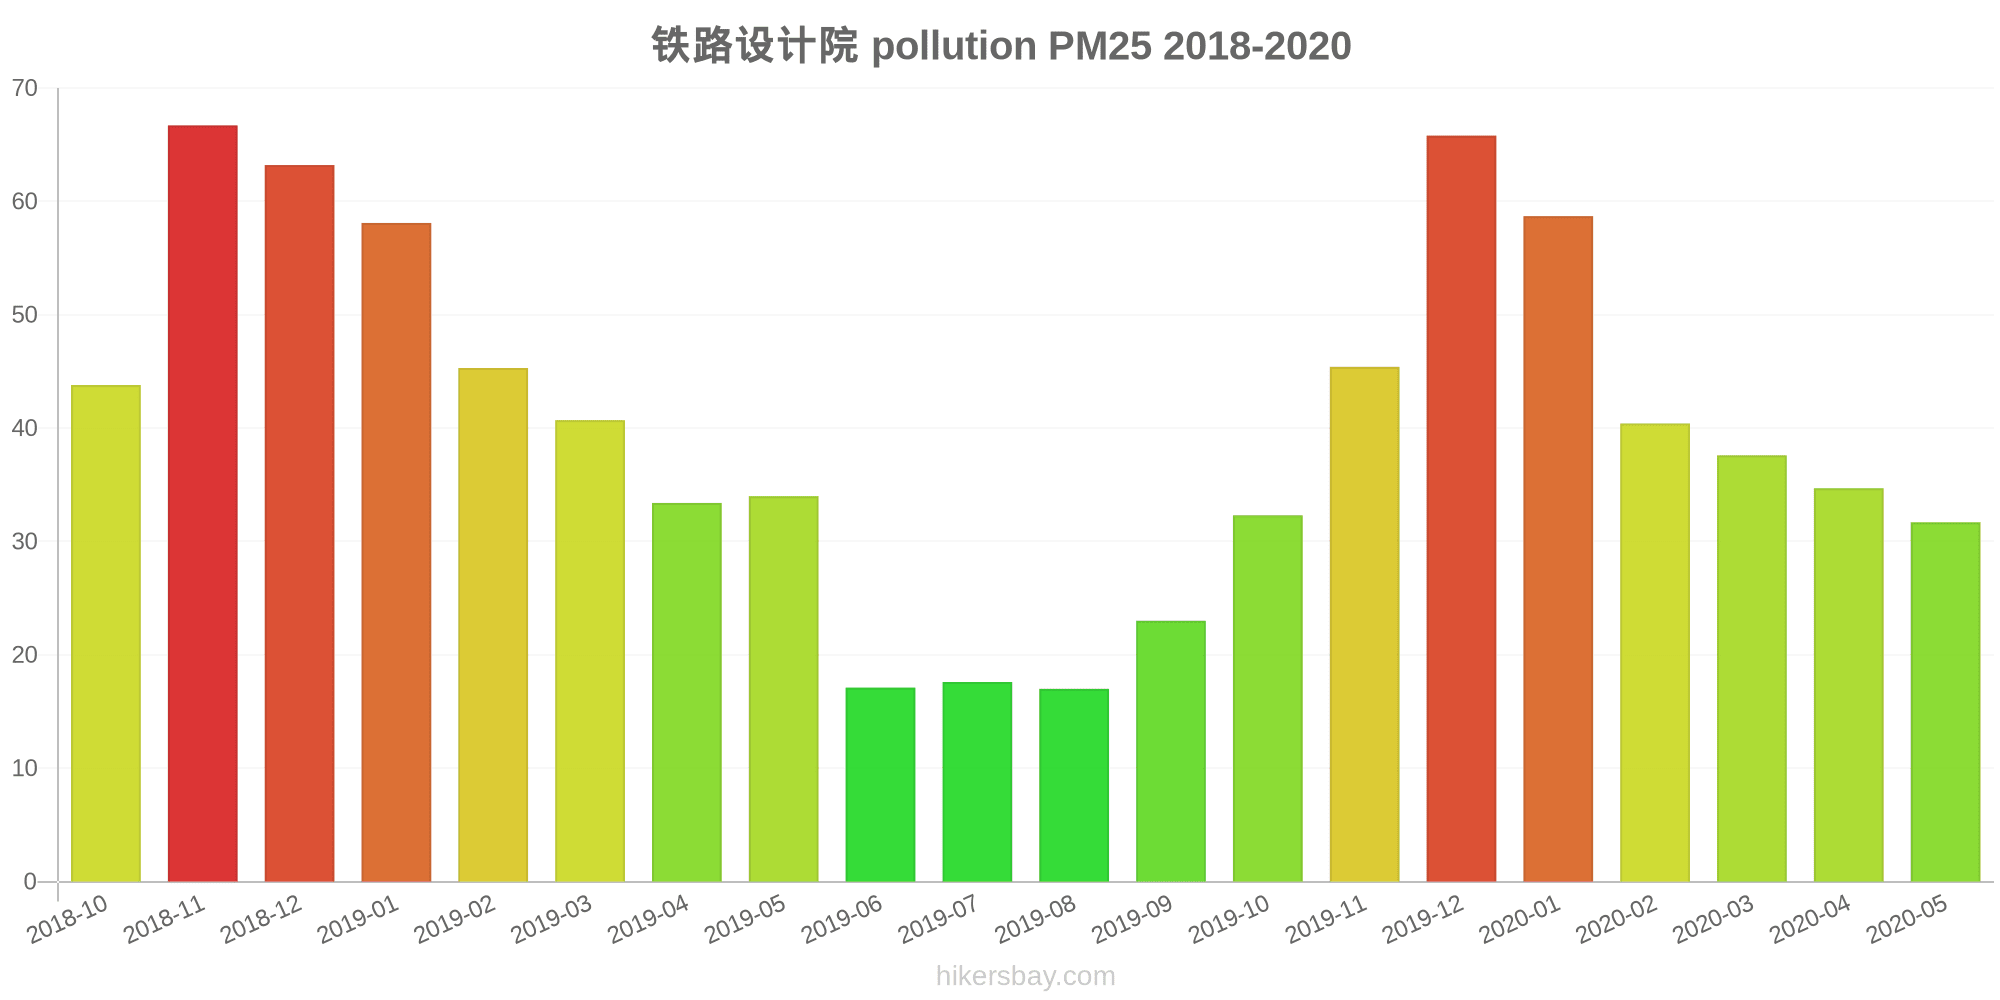
铁路设计院
2018-10 2020-05

index
2020-05
2020-04
2020-03
2020-02
2020-01
2019-12
2019-11
2019-10
2019-09
2019-08
2019-07
2019-06
2019-05
2019-04
2019-03
2019-02
2019-01
2018-12
2018-11
2018-10
pm25
32
35
38
40
59
66
45
32
23
17
18
17
34
33
41
45
58
63
67
44
co
581
931
1
1
2
2
1
1
1
1
924
785
721
887
1
1
2
1
1
963
no2
53
52
55
56
75
93
69
59
53
54
54
49
47
59
66
53
70
62
66
56
o3
144
121
109
100
66
49
56
70
113
144
151
130
126
136
105
76
49
34
47
76
pm10
91
102
104
94
91
126
99
73
56
53
57
50
118
90
107
101
104
138
175
108
so2
11
15
15
25
27
41
21
16
13
12
11
11
10
15
20
27
42
40
35
20
* Pollution data source:
https://openaq.org
(ChinaAQIData)
The data is licensed under CC-By 4.0
PM10 179 (Very bad Hazardous)
PM2,5 35 (Unhealthy for Sensitive Groups)
O3 0 (Good)
NO2 0 (Good)
SO2 0 (Good)
Data on air pollution from recent days in Lanzhou Shi
| index | 2022-05-27 |
|---|---|
| pm10 | 56 Unhealthy for Sensitive Groups |
| pm25 | 56 Unhealthy |
| o3 | 0 Good |
| no2 | 0 Good |
| so2 | 0 Good |
| index | 2020-05 | 2020-04 | 2020-03 | 2020-02 | 2020-01 | 2019-12 | 2019-11 | 2019-10 | 2019-09 | 2019-08 | 2019-07 | 2019-06 | 2019-05 | 2019-04 | 2019-03 | 2019-02 | 2019-01 | 2018-12 | 2018-11 | 2018-10 |
|---|---|---|---|---|---|---|---|---|---|---|---|---|---|---|---|---|---|---|---|---|
| pm25 | 32 (Moderate) | 35 (Moderate) | 38 (Unhealthy for Sensitive Groups) | 40 (Unhealthy for Sensitive Groups) | 59 (Unhealthy) | 66 (Unhealthy) | 45 (Unhealthy for Sensitive Groups) | 32 (Moderate) | 23 (Moderate) | 17 (Moderate) | 18 (Moderate) | 17 (Moderate) | 34 (Moderate) | 33 (Moderate) | 41 (Unhealthy for Sensitive Groups) | 45 (Unhealthy for Sensitive Groups) | 58 (Unhealthy) | 63 (Unhealthy) | 67 (Unhealthy) | 44 (Unhealthy for Sensitive Groups) |
| co | 581 (Good) | 931 (Good) | 1 (Good) | 1 (Good) | 2 (Good) | 2 (Good) | 1 (Good) | 1 (Good) | 1 (Good) | 1 (Good) | 924 (Good) | 785 (Good) | 721 (Good) | 887 (Good) | 1 (Good) | 1 (Good) | 2 (Good) | 1 (Good) | 1 (Good) | 963 (Good) |
| no2 | 53 (Moderate) | 52 (Moderate) | 55 (Moderate) | 56 (Moderate) | 75 (Moderate) | 93 (Moderate) | 69 (Moderate) | 59 (Moderate) | 53 (Moderate) | 54 (Moderate) | 54 (Moderate) | 49 (Moderate) | 47 (Moderate) | 59 (Moderate) | 66 (Moderate) | 53 (Moderate) | 70 (Moderate) | 62 (Moderate) | 66 (Moderate) | 56 (Moderate) |
| o3 | 144 (Unhealthy for Sensitive Groups) | 121 (Unhealthy for Sensitive Groups) | 109 (Moderate) | 100 (Moderate) | 66 (Good) | 49 (Good) | 56 (Good) | 70 (Good) | 113 (Moderate) | 144 (Unhealthy for Sensitive Groups) | 151 (Unhealthy) | 130 (Unhealthy for Sensitive Groups) | 126 (Unhealthy for Sensitive Groups) | 136 (Unhealthy for Sensitive Groups) | 105 (Moderate) | 76 (Moderate) | 49 (Good) | 34 (Good) | 47 (Good) | 76 (Moderate) |
| pm10 | 91 (Unhealthy) | 102 (Unhealthy) | 104 (Unhealthy) | 94 (Unhealthy) | 91 (Unhealthy) | 126 (Very Unhealthy) | 99 (Unhealthy) | 73 (Unhealthy for Sensitive Groups) | 56 (Unhealthy for Sensitive Groups) | 53 (Unhealthy for Sensitive Groups) | 57 (Unhealthy for Sensitive Groups) | 50 (Unhealthy for Sensitive Groups) | 118 (Very Unhealthy) | 90 (Unhealthy) | 107 (Unhealthy) | 101 (Unhealthy) | 104 (Unhealthy) | 138 (Very Unhealthy) | 175 (Very bad Hazardous) | 108 (Unhealthy) |
| so2 | 11 (Good) | 15 (Good) | 15 (Good) | 25 (Good) | 27 (Good) | 41 (Good) | 21 (Good) | 16 (Good) | 13 (Good) | 12 (Good) | 11 (Good) | 11 (Good) | 10 (Good) | 15 (Good) | 20 (Good) | 27 (Good) | 42 (Good) | 40 (Good) | 35 (Good) | 20 (Good) |
Green and Parks in the City
Lanzhou Shi 58%
Mongolia: 27% Bhutan: 82% Hong Kong: 52% Myanmar: 33%particulate matter PM2.5
Lanzhou Shi 54 (Unhealthy for Sensitive Groups)
Pleasure of spending time in the city
Lanzhou Shi 45%
Mongolia: 22% Bhutan: 61% Hong Kong: 43% Myanmar: 24%particulate matter PM10
Lanzhou Shi 130 (Very Unhealthy)
Air Pollution
Lanzhou Shi 68%
Mongolia: 87% Bhutan: 45% Hong Kong: 67% Myanmar: 83%Garbage Disposal
Lanzhou Shi 83%
Mongolia: 27% Bhutan: 47% Hong Kong: 52% Myanmar: 12%Availability and quality of drinking water
Lanzhou Shi 75%
Mongolia: 46% Bhutan: 64% Hong Kong: 66% Myanmar: 34%Cleanliness and tidiness
Lanzhou Shi 75%
Mongolia: 29% Bhutan: 57% Hong Kong: 54% Myanmar: 18%Noise and Light pollution
Lanzhou Shi 8.3%
Mongolia: 48% Bhutan: 55% Hong Kong: 66% Myanmar: 52%Water Pollution
Lanzhou Shi 33%
Mongolia: 68% Bhutan: 56% Hong Kong: 53% Myanmar: 74%PM10 179 (Very bad Hazardous)
particulate matter (PM10) suspended dustPM2,5 35 (Unhealthy for Sensitive Groups)
particulate matter (PM2.5) dustO3 0.04 (Good)
ozone (O3)NO2 0 (Good)
nitrogen dioxide (NO2)SO2 0 (Good)
sulfur dioxide (SO2)铁路设计院
| index | 2022-05-27 |
|---|---|
| pm10 | 56 |
| pm25 | 56 |
| o3 | 0.03 |
| no2 | 0 |
| so2 | 0 |
铁路设计院
| index | 2020-05 | 2020-04 | 2020-03 | 2020-02 | 2020-01 | 2019-12 | 2019-11 | 2019-10 | 2019-09 | 2019-08 | 2019-07 | 2019-06 | 2019-05 | 2019-04 | 2019-03 | 2019-02 | 2019-01 | 2018-12 | 2018-11 | 2018-10 |
|---|---|---|---|---|---|---|---|---|---|---|---|---|---|---|---|---|---|---|---|---|
| pm25 | 32 | 35 | 38 | 40 | 59 | 66 | 45 | 32 | 23 | 17 | 18 | 17 | 34 | 33 | 41 | 45 | 58 | 63 | 67 | 44 |
| co | 581 | 931 | 1 | 1 | 2 | 2 | 1 | 1 | 1 | 1 | 924 | 785 | 721 | 887 | 1 | 1 | 2 | 1 | 1 | 963 |
| no2 | 53 | 52 | 55 | 56 | 75 | 93 | 69 | 59 | 53 | 54 | 54 | 49 | 47 | 59 | 66 | 53 | 70 | 62 | 66 | 56 |
| o3 | 144 | 121 | 109 | 100 | 66 | 49 | 56 | 70 | 113 | 144 | 151 | 130 | 126 | 136 | 105 | 76 | 49 | 34 | 47 | 76 |
| pm10 | 91 | 102 | 104 | 94 | 91 | 126 | 99 | 73 | 56 | 53 | 57 | 50 | 118 | 90 | 107 | 101 | 104 | 138 | 175 | 108 |
| so2 | 11 | 15 | 15 | 25 | 27 | 41 | 21 | 16 | 13 | 12 | 11 | 11 | 10 | 15 | 20 | 27 | 42 | 40 | 35 | 20 |