Air Pollution in Linzi: Real-time Air Quality Index and smog alert.
Pollution and air quality forecast for Linzi. Today is Tuesday, June 16, 2026. The following air pollution values have been recorded for Linzi:- particulate matter (PM10) suspended dust - 53 (Unhealthy for Sensitive Groups)
- ozone (O3) - 0 (Good)
- particulate matter (PM2.5) dust - 7 (Good)
- sulfur dioxide (SO2) - 18 (Good)
- nitrogen dioxide (NO2) - 3 (Good)
- carbon monoxide (CO) - 1 (Good)

What is the air quality in Linzi today? Is the air polluted in Linzi?. Is there smog?
What is the level of PM10 today in Linzi? (particulate matter (PM10) suspended dust)
The current level of particulate matter PM10 in Linzi is:
53 (Unhealthy for Sensitive Groups)
The highest PM10 values usually occur in month: 165 (January 2019).
The lowest value of particulate matter PM10 pollution in Linzi is usually recorded in: August (49).
How is the O3 level today in Linzi? (ozone (O3))
0 (Good)
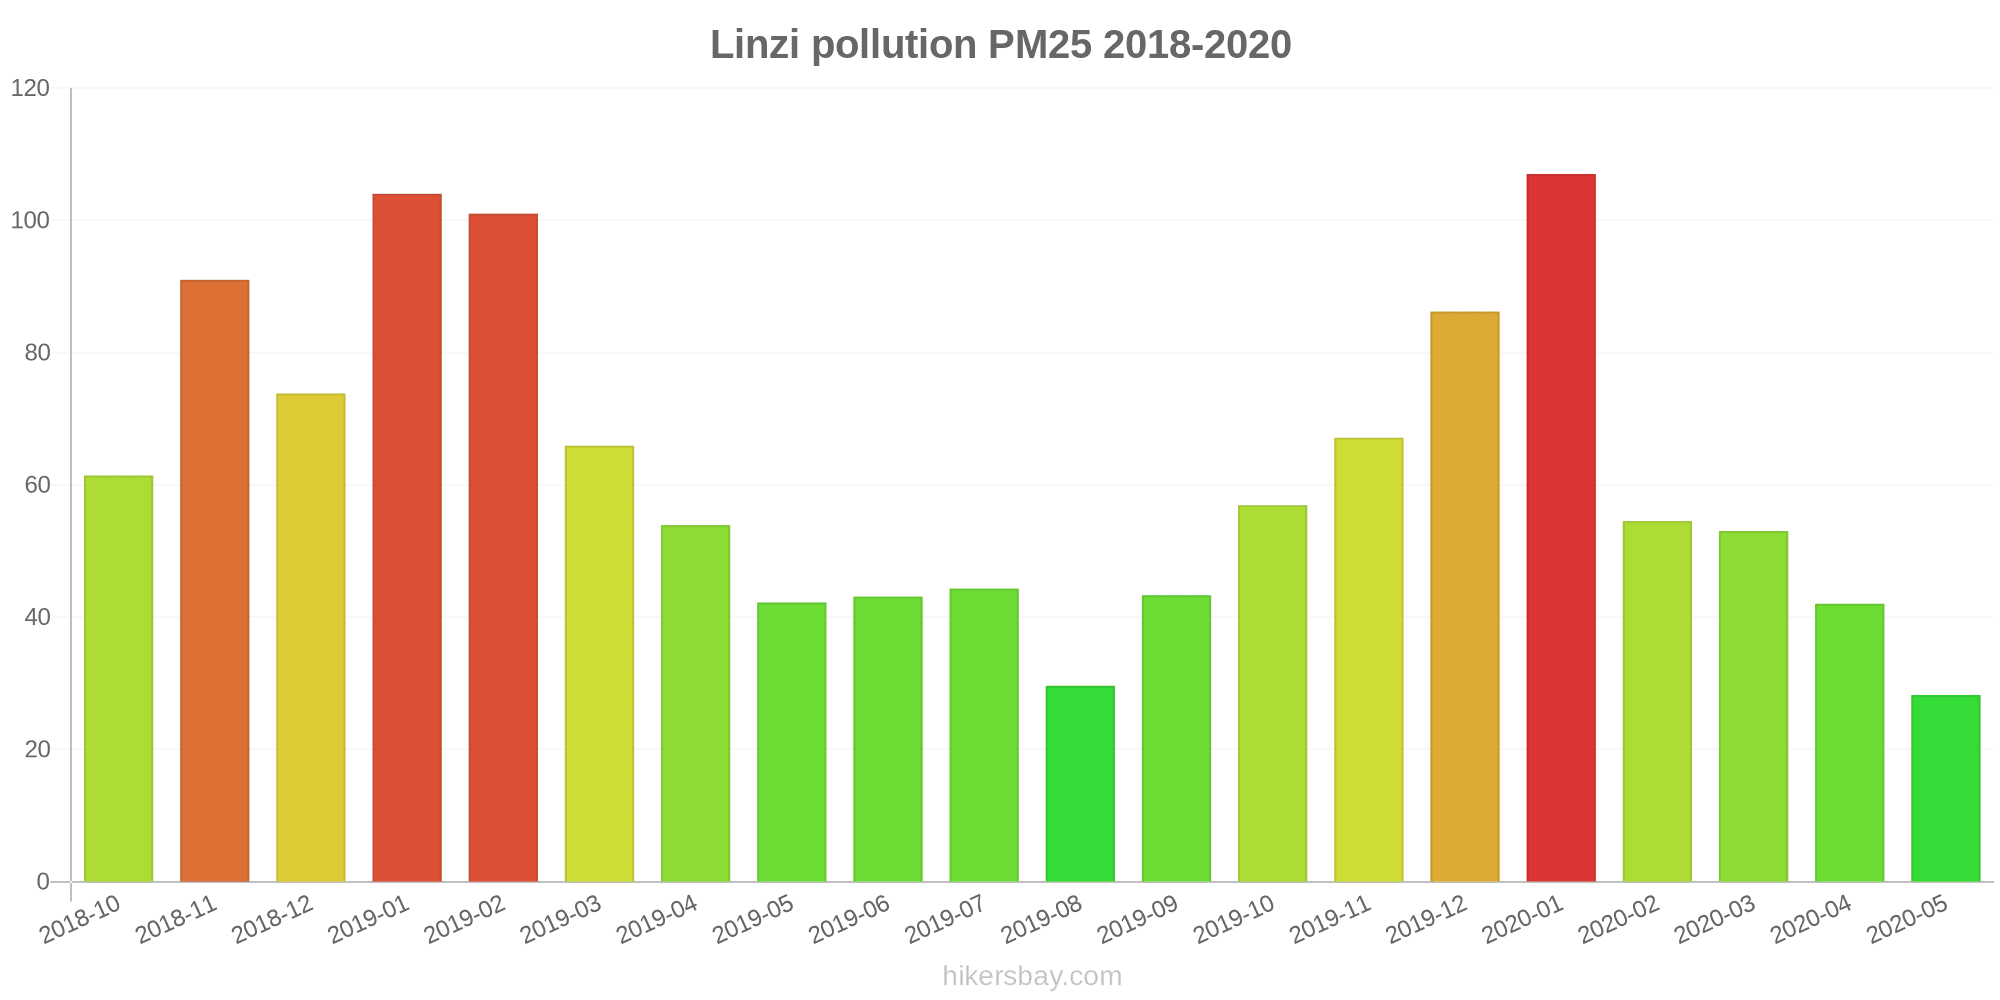
What is the current level of PM2.5 in Linzi? (particulate matter (PM2.5) dust)
Today's PM2.5 level is:
7 (Good)
For comparison, the highest level of PM2.5 in Linzi in the last 7 days was: 21 (Friday, May 27, 2022) and the lowest: 21 (Friday, May 27, 2022).
The highest PM2.5 values were recorded: 107 (January 2020).
The lowest level of particulate matter PM2.5 pollution occurs in month: May (28).
What is the level of SO2 pollution? (sulfur dioxide (SO2))
18 (Good)
How high is the level of NO2? (nitrogen dioxide (NO2))
3 (Good)
How high is the CO level? (carbon monoxide (CO))
1 (Good)
Current data Friday, May 27, 2022, 12:00 PM
PM10 53 (Unhealthy for Sensitive Groups)
O3 0 (Good)
PM2,5 7 (Good)
SO2 18 (Good)
NO2 3 (Good)
CO 1 (Good)
Data on air pollution from recent days in Linzi
index
2022-05-27
pm10
51
Unhealthy for Sensitive Groups
o3
0
Good
pm25
21
Moderate
so2
10
Good
no2
0
Good
co
1
Good
data source »
Air pollution in Linzi from October 2018 to May 2020

index
2020-05
2020-04
2020-03
2020-02
2020-01
2019-12
2019-11
2019-10
2019-09
2019-08
2019-07
2019-06
2019-05
2019-04
2019-03
2019-02
2019-01
2018-12
2018-11
2018-10
pm25
28 (Moderate)
42 (Unhealthy for Sensitive Groups)
53 (Unhealthy for Sensitive Groups)
55 (Unhealthy for Sensitive Groups)
107 (Very Unhealthy)
86 (Very Unhealthy)
67 (Unhealthy)
57 (Unhealthy)
43 (Unhealthy for Sensitive Groups)
30 (Moderate)
44 (Unhealthy for Sensitive Groups)
43 (Unhealthy for Sensitive Groups)
42 (Unhealthy for Sensitive Groups)
54 (Unhealthy for Sensitive Groups)
66 (Unhealthy)
101 (Very Unhealthy)
104 (Very Unhealthy)
74 (Unhealthy)
91 (Very Unhealthy)
61 (Unhealthy)
co
735 (Good)
1 (Good)
1 (Good)
1 (Good)
2 (Good)
1 (Good)
1 (Good)
1 (Good)
1 (Good)
748 (Good)
971 (Good)
881 (Good)
1 (Good)
1 (Good)
1 (Good)
1 (Good)
1 (Good)
1 (Good)
1 (Good)
2 (Good)
no2
25 (Good)
37 (Good)
36 (Good)
25 (Good)
47 (Moderate)
50 (Moderate)
50 (Moderate)
46 (Moderate)
37 (Good)
26 (Good)
27 (Good)
25 (Good)
34 (Good)
32 (Good)
43 (Moderate)
42 (Moderate)
53 (Moderate)
50 (Moderate)
47 (Moderate)
43 (Moderate)
o3
146 (Unhealthy for Sensitive Groups)
141 (Unhealthy for Sensitive Groups)
123 (Unhealthy for Sensitive Groups)
96 (Moderate)
75 (Moderate)
57 (Good)
91 (Moderate)
138 (Unhealthy for Sensitive Groups)
187 (Very Unhealthy)
150 (Unhealthy)
202 (Very Unhealthy)
227 (Very Unhealthy)
189 (Very Unhealthy)
155 (Unhealthy)
132 (Unhealthy for Sensitive Groups)
103 (Moderate)
72 (Moderate)
59 (Good)
91 (Moderate)
112 (Moderate)
pm10
65 (Unhealthy for Sensitive Groups)
99 (Unhealthy)
110 (Very Unhealthy)
75 (Unhealthy for Sensitive Groups)
143 (Very Unhealthy)
132 (Very Unhealthy)
137 (Very Unhealthy)
122 (Very Unhealthy)
83 (Unhealthy)
49 (Moderate)
67 (Unhealthy for Sensitive Groups)
82 (Unhealthy)
101 (Unhealthy)
114 (Very Unhealthy)
128 (Very Unhealthy)
146 (Very Unhealthy)
165 (Very bad Hazardous)
133 (Very Unhealthy)
162 (Very bad Hazardous)
133 (Very Unhealthy)
so2
8.2 (Good)
16 (Good)
17 (Good)
14 (Good)
28 (Good)
21 (Good)
16 (Good)
15 (Good)
11 (Good)
13 (Good)
12 (Good)
17 (Good)
24 (Good)
24 (Good)
32 (Good)
36 (Good)
38 (Good)
31 (Good)
21 (Good)
27 (Good)
data source »
莆田园
Friday, May 27, 2022, 12:00 PM
PM10 53 (Unhealthy for Sensitive Groups)
particulate matter (PM10) suspended dust
O3 0.02 (Good)
ozone (O3)
PM2,5 6.6 (Good)
particulate matter (PM2.5) dust
SO2 18 (Good)
sulfur dioxide (SO2)
NO2 3 (Good)
nitrogen dioxide (NO2)
CO 1.3 (Good)
carbon monoxide (CO)
莆田园
index
2022-05-27
pm10
51
o3
0.02
pm25
21
so2
9.6
no2
0.38
co
0.64
莆田园
2018-10 2020-05

index
2020-05
2020-04
2020-03
2020-02
2020-01
2019-12
2019-11
2019-10
2019-09
2019-08
2019-07
2019-06
2019-05
2019-04
2019-03
2019-02
2019-01
2018-12
2018-11
2018-10
pm25
28
42
53
55
107
86
67
57
43
30
44
43
42
54
66
101
104
74
91
61
co
735
1
1
1
2
1
1
1
1
748
971
881
1
1
1
1
1
1
1
2
no2
25
37
36
25
47
50
50
46
37
26
27
25
34
32
43
42
53
50
47
43
o3
146
141
123
96
75
57
91
138
187
150
202
227
189
155
132
103
72
59
91
112
pm10
65
99
110
75
143
132
137
122
83
49
67
82
101
114
128
146
165
133
162
133
so2
8.2
16
17
14
28
21
16
15
11
13
12
17
24
24
32
36
38
31
21
27
* Pollution data source:
https://openaq.org
(ChinaAQIData)
The data is licensed under CC-By 4.0
PM10 53 (Unhealthy for Sensitive Groups)
O3 0 (Good)
PM2,5 7 (Good)
SO2 18 (Good)
NO2 3 (Good)
CO 1 (Good)
Data on air pollution from recent days in Linzi
| index | 2022-05-27 |
|---|---|
| pm10 | 51 Unhealthy for Sensitive Groups |
| o3 | 0 Good |
| pm25 | 21 Moderate |
| so2 | 10 Good |
| no2 | 0 Good |
| co | 1 Good |
| index | 2020-05 | 2020-04 | 2020-03 | 2020-02 | 2020-01 | 2019-12 | 2019-11 | 2019-10 | 2019-09 | 2019-08 | 2019-07 | 2019-06 | 2019-05 | 2019-04 | 2019-03 | 2019-02 | 2019-01 | 2018-12 | 2018-11 | 2018-10 |
|---|---|---|---|---|---|---|---|---|---|---|---|---|---|---|---|---|---|---|---|---|
| pm25 | 28 (Moderate) | 42 (Unhealthy for Sensitive Groups) | 53 (Unhealthy for Sensitive Groups) | 55 (Unhealthy for Sensitive Groups) | 107 (Very Unhealthy) | 86 (Very Unhealthy) | 67 (Unhealthy) | 57 (Unhealthy) | 43 (Unhealthy for Sensitive Groups) | 30 (Moderate) | 44 (Unhealthy for Sensitive Groups) | 43 (Unhealthy for Sensitive Groups) | 42 (Unhealthy for Sensitive Groups) | 54 (Unhealthy for Sensitive Groups) | 66 (Unhealthy) | 101 (Very Unhealthy) | 104 (Very Unhealthy) | 74 (Unhealthy) | 91 (Very Unhealthy) | 61 (Unhealthy) |
| co | 735 (Good) | 1 (Good) | 1 (Good) | 1 (Good) | 2 (Good) | 1 (Good) | 1 (Good) | 1 (Good) | 1 (Good) | 748 (Good) | 971 (Good) | 881 (Good) | 1 (Good) | 1 (Good) | 1 (Good) | 1 (Good) | 1 (Good) | 1 (Good) | 1 (Good) | 2 (Good) |
| no2 | 25 (Good) | 37 (Good) | 36 (Good) | 25 (Good) | 47 (Moderate) | 50 (Moderate) | 50 (Moderate) | 46 (Moderate) | 37 (Good) | 26 (Good) | 27 (Good) | 25 (Good) | 34 (Good) | 32 (Good) | 43 (Moderate) | 42 (Moderate) | 53 (Moderate) | 50 (Moderate) | 47 (Moderate) | 43 (Moderate) |
| o3 | 146 (Unhealthy for Sensitive Groups) | 141 (Unhealthy for Sensitive Groups) | 123 (Unhealthy for Sensitive Groups) | 96 (Moderate) | 75 (Moderate) | 57 (Good) | 91 (Moderate) | 138 (Unhealthy for Sensitive Groups) | 187 (Very Unhealthy) | 150 (Unhealthy) | 202 (Very Unhealthy) | 227 (Very Unhealthy) | 189 (Very Unhealthy) | 155 (Unhealthy) | 132 (Unhealthy for Sensitive Groups) | 103 (Moderate) | 72 (Moderate) | 59 (Good) | 91 (Moderate) | 112 (Moderate) |
| pm10 | 65 (Unhealthy for Sensitive Groups) | 99 (Unhealthy) | 110 (Very Unhealthy) | 75 (Unhealthy for Sensitive Groups) | 143 (Very Unhealthy) | 132 (Very Unhealthy) | 137 (Very Unhealthy) | 122 (Very Unhealthy) | 83 (Unhealthy) | 49 (Moderate) | 67 (Unhealthy for Sensitive Groups) | 82 (Unhealthy) | 101 (Unhealthy) | 114 (Very Unhealthy) | 128 (Very Unhealthy) | 146 (Very Unhealthy) | 165 (Very bad Hazardous) | 133 (Very Unhealthy) | 162 (Very bad Hazardous) | 133 (Very Unhealthy) |
| so2 | 8.2 (Good) | 16 (Good) | 17 (Good) | 14 (Good) | 28 (Good) | 21 (Good) | 16 (Good) | 15 (Good) | 11 (Good) | 13 (Good) | 12 (Good) | 17 (Good) | 24 (Good) | 24 (Good) | 32 (Good) | 36 (Good) | 38 (Good) | 31 (Good) | 21 (Good) | 27 (Good) |
PM10 53 (Unhealthy for Sensitive Groups)
particulate matter (PM10) suspended dustO3 0.02 (Good)
ozone (O3)PM2,5 6.6 (Good)
particulate matter (PM2.5) dustSO2 18 (Good)
sulfur dioxide (SO2)NO2 3 (Good)
nitrogen dioxide (NO2)CO 1.3 (Good)
carbon monoxide (CO)莆田园
| index | 2022-05-27 |
|---|---|
| pm10 | 51 |
| o3 | 0.02 |
| pm25 | 21 |
| so2 | 9.6 |
| no2 | 0.38 |
| co | 0.64 |
莆田园

| index | 2020-05 | 2020-04 | 2020-03 | 2020-02 | 2020-01 | 2019-12 | 2019-11 | 2019-10 | 2019-09 | 2019-08 | 2019-07 | 2019-06 | 2019-05 | 2019-04 | 2019-03 | 2019-02 | 2019-01 | 2018-12 | 2018-11 | 2018-10 |
|---|---|---|---|---|---|---|---|---|---|---|---|---|---|---|---|---|---|---|---|---|
| pm25 | 28 | 42 | 53 | 55 | 107 | 86 | 67 | 57 | 43 | 30 | 44 | 43 | 42 | 54 | 66 | 101 | 104 | 74 | 91 | 61 |
| co | 735 | 1 | 1 | 1 | 2 | 1 | 1 | 1 | 1 | 748 | 971 | 881 | 1 | 1 | 1 | 1 | 1 | 1 | 1 | 2 |
| no2 | 25 | 37 | 36 | 25 | 47 | 50 | 50 | 46 | 37 | 26 | 27 | 25 | 34 | 32 | 43 | 42 | 53 | 50 | 47 | 43 |
| o3 | 146 | 141 | 123 | 96 | 75 | 57 | 91 | 138 | 187 | 150 | 202 | 227 | 189 | 155 | 132 | 103 | 72 | 59 | 91 | 112 |
| pm10 | 65 | 99 | 110 | 75 | 143 | 132 | 137 | 122 | 83 | 49 | 67 | 82 | 101 | 114 | 128 | 146 | 165 | 133 | 162 | 133 |
| so2 | 8.2 | 16 | 17 | 14 | 28 | 21 | 16 | 15 | 11 | 13 | 12 | 17 | 24 | 24 | 32 | 36 | 38 | 31 | 21 | 27 |