Air Pollution in Longquan: Real-time Air Quality Index and smog alert.
Pollution and air quality forecast for Longquan. Today is Tuesday, June 16, 2026. The following air pollution values have been recorded for Longquan:- particulate matter (PM2.5) dust - 61 (Unhealthy)
- nitrogen dioxide (NO2) - 22 (Good)
- particulate matter (PM10) suspended dust - 69 (Unhealthy for Sensitive Groups)
- carbon monoxide (CO) - 219 (Good)
- ozone (O3) - 0 (Good)
- sulfur dioxide (SO2) - 8 (Good)

What is the air quality in Longquan today? Is the air polluted in Longquan?. Is there smog?
What is the current level of PM2.5 in Longquan? (particulate matter (PM2.5) dust)
Today's PM2.5 level is:
61 (Unhealthy)
For comparison, the highest level of PM2.5 in Longquan in the last 7 days was: 28 (Friday, May 27, 2022) and the lowest: 28 (Friday, May 27, 2022).
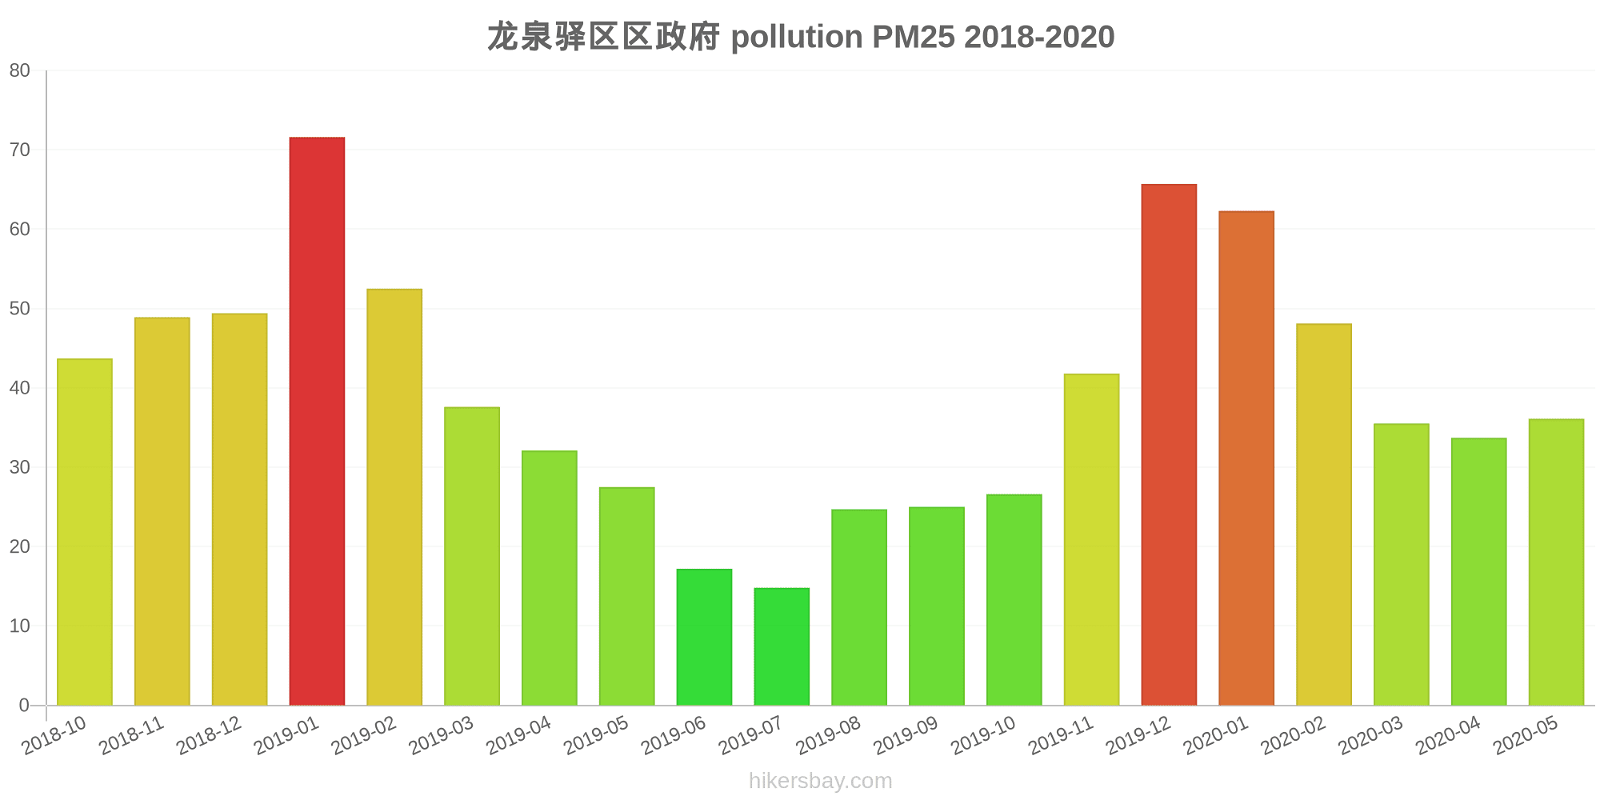
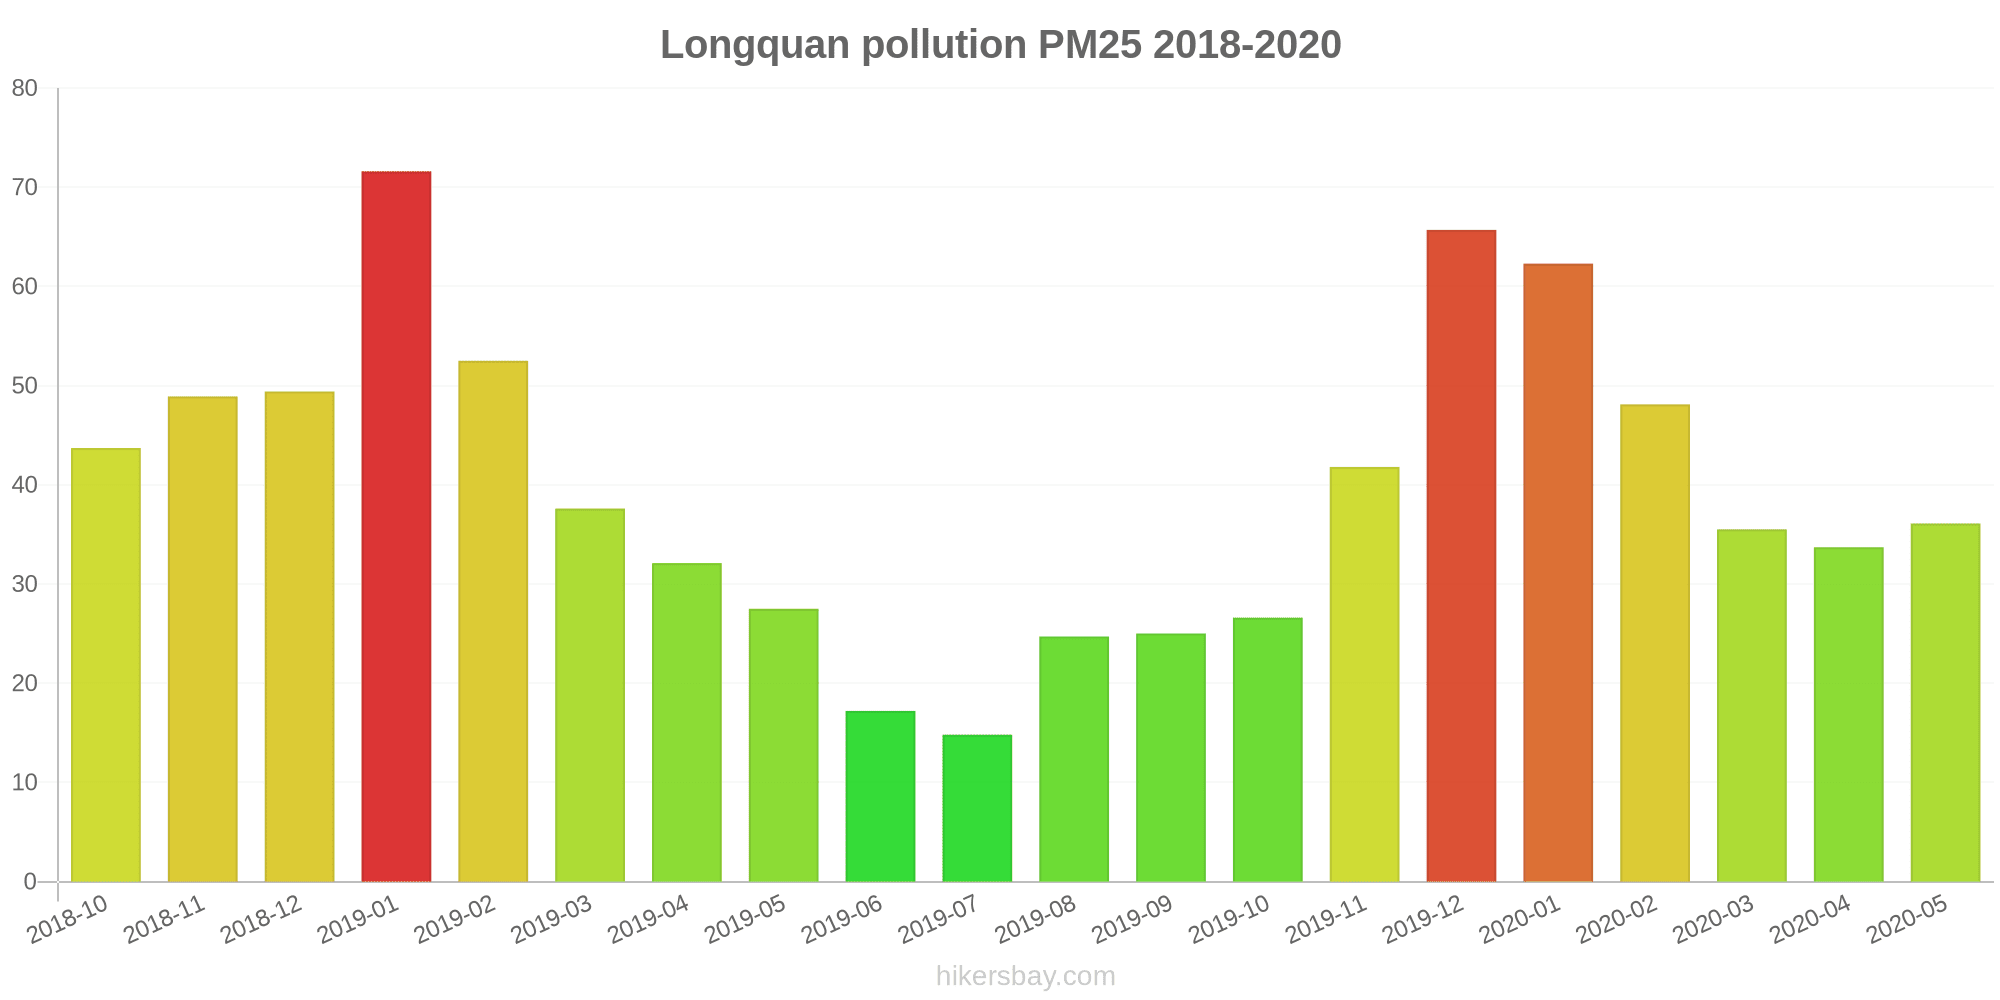
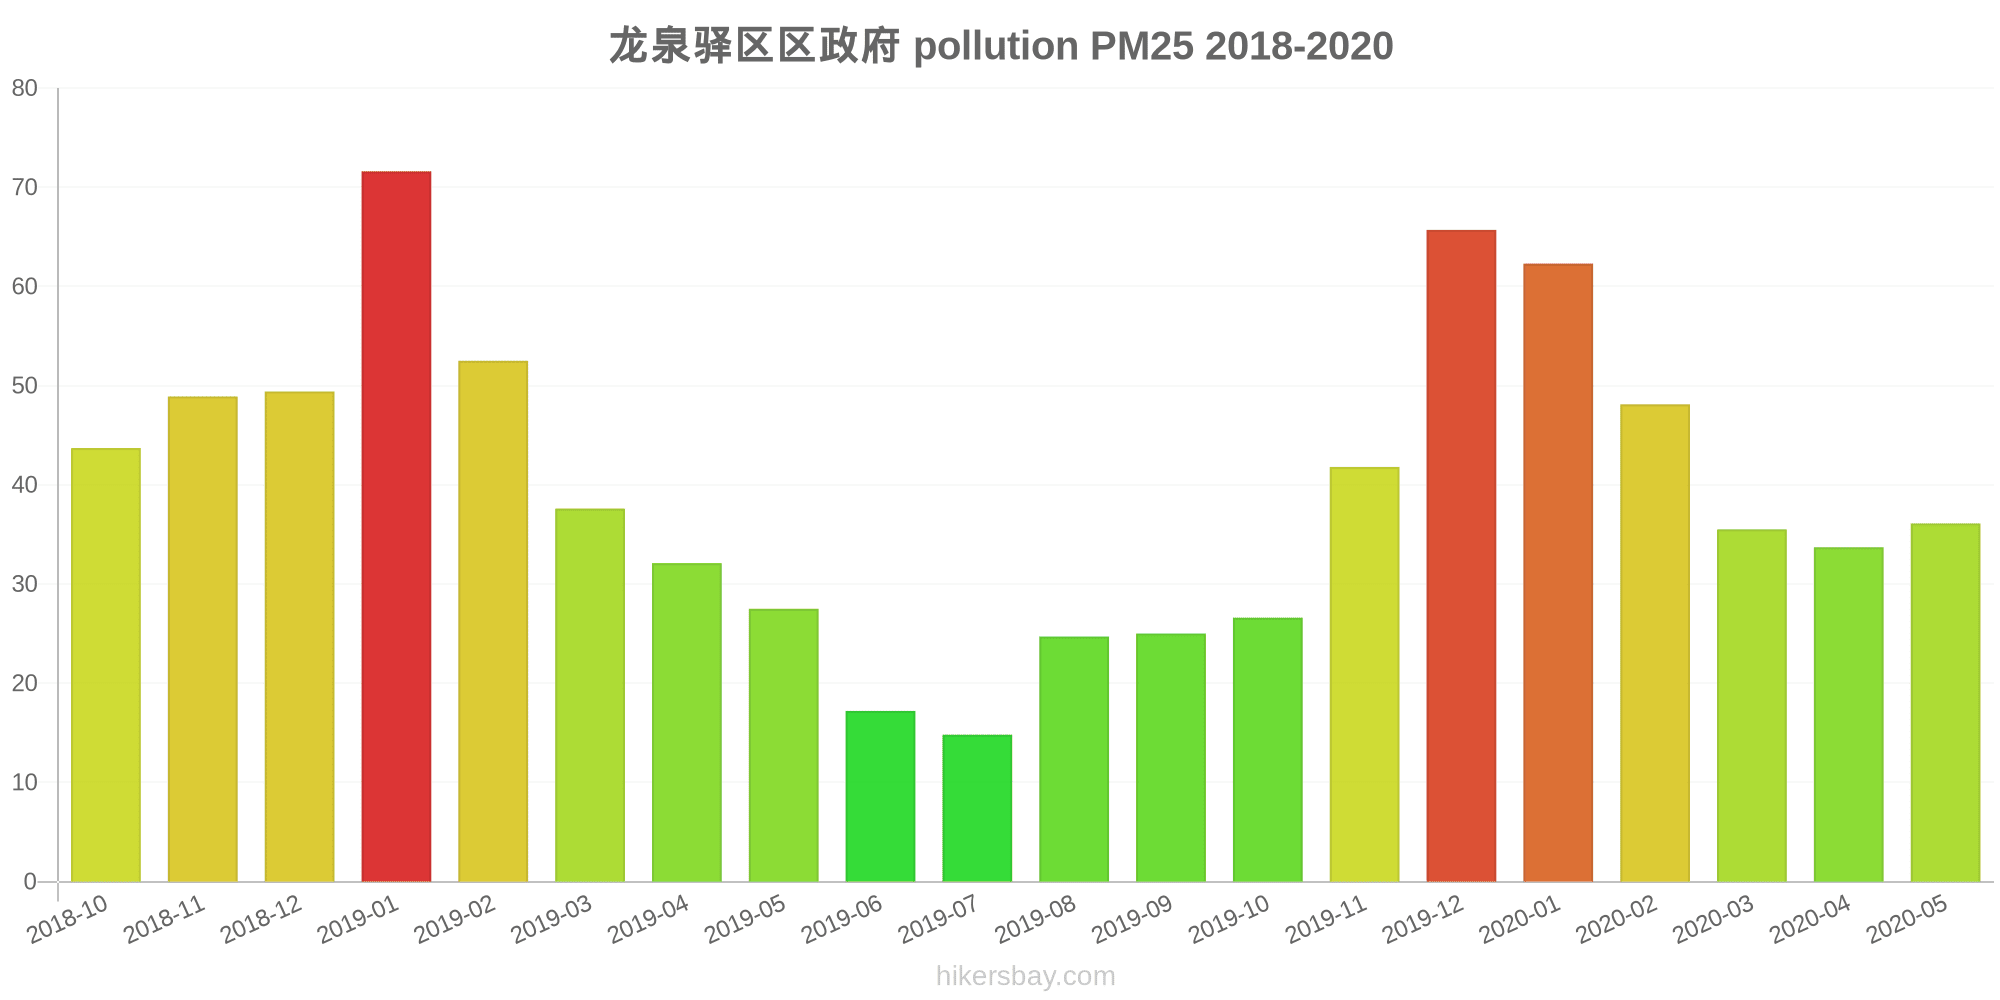
The highest PM2.5 values were recorded: 72 (January 2019).
The lowest level of particulate matter PM2.5 pollution occurs in month: July (15).
How high is the level of NO2? (nitrogen dioxide (NO2))
22 (Good)
What is the level of PM10 today in Longquan? (particulate matter (PM10) suspended dust)
The current level of particulate matter PM10 in Longquan is:
69 (Unhealthy for Sensitive Groups)
The highest PM10 values usually occur in month: 96 (January 2019).
The lowest value of particulate matter PM10 pollution in Longquan is usually recorded in: July (28).
How high is the CO level? (carbon monoxide (CO))
219 (Good)
How is the O3 level today in Longquan? (ozone (O3))
0 (Good)
What is the level of SO2 pollution? (sulfur dioxide (SO2))
8 (Good)
Current data Friday, May 27, 2022, 3:00 PM
PM2,5 61 (Unhealthy)
NO2 22 (Good)
PM10 69 (Unhealthy for Sensitive Groups)
CO 219 (Good)
O3 0 (Good)
SO2 8 (Good)
Data on air pollution from recent days in Longquan
index
2022-05-27
pm25
28
Moderate
no2
22
Good
pm10
35
Moderate
co
579
Good
o3
22
Good
so2
5
Good
data source »
Air pollution in Longquan from October 2018 to May 2020

index
2020-05
2020-04
2020-03
2020-02
2020-01
2019-12
2019-11
2019-10
2019-09
2019-08
2019-07
2019-06
2019-05
2019-04
2019-03
2019-02
2019-01
2018-12
2018-11
2018-10
pm25
36 (Unhealthy for Sensitive Groups)
34 (Moderate)
36 (Unhealthy for Sensitive Groups)
48 (Unhealthy for Sensitive Groups)
62 (Unhealthy)
66 (Unhealthy)
42 (Unhealthy for Sensitive Groups)
27 (Moderate)
25 (Moderate)
25 (Moderate)
15 (Moderate)
17 (Moderate)
28 (Moderate)
32 (Moderate)
38 (Unhealthy for Sensitive Groups)
53 (Unhealthy for Sensitive Groups)
72 (Unhealthy)
49 (Unhealthy for Sensitive Groups)
49 (Unhealthy for Sensitive Groups)
44 (Unhealthy for Sensitive Groups)
co
510 (Good)
600 (Good)
645 (Good)
750 (Good)
987 (Good)
856 (Good)
614 (Good)
627 (Good)
701 (Good)
684 (Good)
594 (Good)
777 (Good)
735 (Good)
800 (Good)
789 (Good)
843 (Good)
1 (Good)
834 (Good)
836 (Good)
791 (Good)
no2
31 (Good)
35 (Good)
33 (Good)
15 (Good)
28 (Good)
37 (Good)
30 (Good)
26 (Good)
25 (Good)
26 (Good)
22 (Good)
20 (Good)
22 (Good)
30 (Good)
36 (Good)
28 (Good)
42 (Moderate)
34 (Good)
30 (Good)
27 (Good)
o3
155 (Unhealthy)
119 (Moderate)
105 (Moderate)
82 (Moderate)
63 (Good)
65 (Good)
68 (Good)
91 (Moderate)
100 (Moderate)
169 (Unhealthy)
112 (Moderate)
142 (Unhealthy for Sensitive Groups)
127 (Unhealthy for Sensitive Groups)
138 (Unhealthy for Sensitive Groups)
102 (Moderate)
74 (Moderate)
71 (Moderate)
52 (Good)
72 (Moderate)
84 (Moderate)
pm10
69 (Unhealthy for Sensitive Groups)
55 (Unhealthy for Sensitive Groups)
63 (Unhealthy for Sensitive Groups)
64 (Unhealthy for Sensitive Groups)
78 (Unhealthy for Sensitive Groups)
87 (Unhealthy)
65 (Unhealthy for Sensitive Groups)
40 (Moderate)
39 (Moderate)
39 (Moderate)
28 (Moderate)
33 (Moderate)
49 (Moderate)
54 (Unhealthy for Sensitive Groups)
59 (Unhealthy for Sensitive Groups)
70 (Unhealthy for Sensitive Groups)
96 (Unhealthy)
79 (Unhealthy for Sensitive Groups)
68 (Unhealthy for Sensitive Groups)
60 (Unhealthy for Sensitive Groups)
so2
8.3 (Good)
7.7 (Good)
8.9 (Good)
6.8 (Good)
5.6 (Good)
6.2 (Good)
5.5 (Good)
4.6 (Good)
4.2 (Good)
6.9 (Good)
5.6 (Good)
4.8 (Good)
4.6 (Good)
9.8 (Good)
7.9 (Good)
6.5 (Good)
6.4 (Good)
5.2 (Good)
6.7 (Good)
12 (Good)
data source »
龙泉驿区区政府
Friday, May 27, 2022, 3:00 PM
PM2,5 61 (Unhealthy)
particulate matter (PM2.5) dust
NO2 22 (Good)
nitrogen dioxide (NO2)
PM10 69 (Unhealthy for Sensitive Groups)
particulate matter (PM10) suspended dust
CO 219 (Good)
carbon monoxide (CO)
O3 0.05 (Good)
ozone (O3)
SO2 7.7 (Good)
sulfur dioxide (SO2)
龙泉驿区区政府
index
2022-05-27
pm25
28
no2
22
pm10
35
co
579
o3
22
so2
4.6
龙泉驿区区政府
2018-10 2020-05
index
2020-05
2020-04
2020-03
2020-02
2020-01
2019-12
2019-11
2019-10
2019-09
2019-08
2019-07
2019-06
2019-05
2019-04
2019-03
2019-02
2019-01
2018-12
2018-11
2018-10
pm25
36
34
36
48
62
66
42
27
25
25
15
17
28
32
38
53
72
49
49
44
co
510
600
645
750
987
856
614
627
701
684
594
777
735
800
789
843
1
834
836
791
no2
31
35
33
15
28
37
30
26
25
26
22
20
22
30
36
28
42
34
30
27
o3
155
119
105
82
63
65
68
91
100
169
112
142
127
138
102
74
71
52
72
84
pm10
69
55
63
64
78
87
65
40
39
39
28
33
49
54
59
70
96
79
68
60
so2
8.3
7.7
8.9
6.8
5.6
6.2
5.5
4.6
4.2
6.9
5.6
4.8
4.6
9.8
7.9
6.5
6.4
5.2
6.7
12
* Pollution data source:
https://openaq.org
(ChinaAQIData)
The data is licensed under CC-By 4.0
PM2,5 61 (Unhealthy)
NO2 22 (Good)
PM10 69 (Unhealthy for Sensitive Groups)
CO 219 (Good)
O3 0 (Good)
SO2 8 (Good)
Data on air pollution from recent days in Longquan
| index | 2022-05-27 |
|---|---|
| pm25 | 28 Moderate |
| no2 | 22 Good |
| pm10 | 35 Moderate |
| co | 579 Good |
| o3 | 22 Good |
| so2 | 5 Good |
| index | 2020-05 | 2020-04 | 2020-03 | 2020-02 | 2020-01 | 2019-12 | 2019-11 | 2019-10 | 2019-09 | 2019-08 | 2019-07 | 2019-06 | 2019-05 | 2019-04 | 2019-03 | 2019-02 | 2019-01 | 2018-12 | 2018-11 | 2018-10 |
|---|---|---|---|---|---|---|---|---|---|---|---|---|---|---|---|---|---|---|---|---|
| pm25 | 36 (Unhealthy for Sensitive Groups) | 34 (Moderate) | 36 (Unhealthy for Sensitive Groups) | 48 (Unhealthy for Sensitive Groups) | 62 (Unhealthy) | 66 (Unhealthy) | 42 (Unhealthy for Sensitive Groups) | 27 (Moderate) | 25 (Moderate) | 25 (Moderate) | 15 (Moderate) | 17 (Moderate) | 28 (Moderate) | 32 (Moderate) | 38 (Unhealthy for Sensitive Groups) | 53 (Unhealthy for Sensitive Groups) | 72 (Unhealthy) | 49 (Unhealthy for Sensitive Groups) | 49 (Unhealthy for Sensitive Groups) | 44 (Unhealthy for Sensitive Groups) |
| co | 510 (Good) | 600 (Good) | 645 (Good) | 750 (Good) | 987 (Good) | 856 (Good) | 614 (Good) | 627 (Good) | 701 (Good) | 684 (Good) | 594 (Good) | 777 (Good) | 735 (Good) | 800 (Good) | 789 (Good) | 843 (Good) | 1 (Good) | 834 (Good) | 836 (Good) | 791 (Good) |
| no2 | 31 (Good) | 35 (Good) | 33 (Good) | 15 (Good) | 28 (Good) | 37 (Good) | 30 (Good) | 26 (Good) | 25 (Good) | 26 (Good) | 22 (Good) | 20 (Good) | 22 (Good) | 30 (Good) | 36 (Good) | 28 (Good) | 42 (Moderate) | 34 (Good) | 30 (Good) | 27 (Good) |
| o3 | 155 (Unhealthy) | 119 (Moderate) | 105 (Moderate) | 82 (Moderate) | 63 (Good) | 65 (Good) | 68 (Good) | 91 (Moderate) | 100 (Moderate) | 169 (Unhealthy) | 112 (Moderate) | 142 (Unhealthy for Sensitive Groups) | 127 (Unhealthy for Sensitive Groups) | 138 (Unhealthy for Sensitive Groups) | 102 (Moderate) | 74 (Moderate) | 71 (Moderate) | 52 (Good) | 72 (Moderate) | 84 (Moderate) |
| pm10 | 69 (Unhealthy for Sensitive Groups) | 55 (Unhealthy for Sensitive Groups) | 63 (Unhealthy for Sensitive Groups) | 64 (Unhealthy for Sensitive Groups) | 78 (Unhealthy for Sensitive Groups) | 87 (Unhealthy) | 65 (Unhealthy for Sensitive Groups) | 40 (Moderate) | 39 (Moderate) | 39 (Moderate) | 28 (Moderate) | 33 (Moderate) | 49 (Moderate) | 54 (Unhealthy for Sensitive Groups) | 59 (Unhealthy for Sensitive Groups) | 70 (Unhealthy for Sensitive Groups) | 96 (Unhealthy) | 79 (Unhealthy for Sensitive Groups) | 68 (Unhealthy for Sensitive Groups) | 60 (Unhealthy for Sensitive Groups) |
| so2 | 8.3 (Good) | 7.7 (Good) | 8.9 (Good) | 6.8 (Good) | 5.6 (Good) | 6.2 (Good) | 5.5 (Good) | 4.6 (Good) | 4.2 (Good) | 6.9 (Good) | 5.6 (Good) | 4.8 (Good) | 4.6 (Good) | 9.8 (Good) | 7.9 (Good) | 6.5 (Good) | 6.4 (Good) | 5.2 (Good) | 6.7 (Good) | 12 (Good) |
PM2,5 61 (Unhealthy)
particulate matter (PM2.5) dustNO2 22 (Good)
nitrogen dioxide (NO2)PM10 69 (Unhealthy for Sensitive Groups)
particulate matter (PM10) suspended dustCO 219 (Good)
carbon monoxide (CO)O3 0.05 (Good)
ozone (O3)SO2 7.7 (Good)
sulfur dioxide (SO2)龙泉驿区区政府
| index | 2022-05-27 |
|---|---|
| pm25 | 28 |
| no2 | 22 |
| pm10 | 35 |
| co | 579 |
| o3 | 22 |
| so2 | 4.6 |
龙泉驿区区政府
| index | 2020-05 | 2020-04 | 2020-03 | 2020-02 | 2020-01 | 2019-12 | 2019-11 | 2019-10 | 2019-09 | 2019-08 | 2019-07 | 2019-06 | 2019-05 | 2019-04 | 2019-03 | 2019-02 | 2019-01 | 2018-12 | 2018-11 | 2018-10 |
|---|---|---|---|---|---|---|---|---|---|---|---|---|---|---|---|---|---|---|---|---|
| pm25 | 36 | 34 | 36 | 48 | 62 | 66 | 42 | 27 | 25 | 25 | 15 | 17 | 28 | 32 | 38 | 53 | 72 | 49 | 49 | 44 |
| co | 510 | 600 | 645 | 750 | 987 | 856 | 614 | 627 | 701 | 684 | 594 | 777 | 735 | 800 | 789 | 843 | 1 | 834 | 836 | 791 |
| no2 | 31 | 35 | 33 | 15 | 28 | 37 | 30 | 26 | 25 | 26 | 22 | 20 | 22 | 30 | 36 | 28 | 42 | 34 | 30 | 27 |
| o3 | 155 | 119 | 105 | 82 | 63 | 65 | 68 | 91 | 100 | 169 | 112 | 142 | 127 | 138 | 102 | 74 | 71 | 52 | 72 | 84 |
| pm10 | 69 | 55 | 63 | 64 | 78 | 87 | 65 | 40 | 39 | 39 | 28 | 33 | 49 | 54 | 59 | 70 | 96 | 79 | 68 | 60 |
| so2 | 8.3 | 7.7 | 8.9 | 6.8 | 5.6 | 6.2 | 5.5 | 4.6 | 4.2 | 6.9 | 5.6 | 4.8 | 4.6 | 9.8 | 7.9 | 6.5 | 6.4 | 5.2 | 6.7 | 12 |