Air Pollution in Lu’an Shi: Real-time Air Quality Index and smog alert.
Pollution and air quality forecast for Lu’an Shi. Today is Tuesday, June 16, 2026. The following air pollution values have been recorded for Lu’an Shi:- particulate matter (PM10) suspended dust - 179 (Very bad Hazardous)
- particulate matter (PM2.5) dust - 35 (Unhealthy for Sensitive Groups)
- ozone (O3) - 0 (Good)
- nitrogen dioxide (NO2) - 0 (Good)
- sulfur dioxide (SO2) - 0 (Good)

What is the air quality in Lu’an Shi today? Is the air polluted in Lu’an Shi?. Is there smog?
What is the level of PM10 today in Lu’an Shi? (particulate matter (PM10) suspended dust)
The current level of particulate matter PM10 in Lu’an Shi is:
179 (Very bad Hazardous)
The highest PM10 values usually occur in month: 134 (January 2019).
The lowest value of particulate matter PM10 pollution in Lu’an Shi is usually recorded in: July (43).
What is the current level of PM2.5 in Lu’an Shi? (particulate matter (PM2.5) dust)
Today's PM2.5 level is:
35 (Unhealthy for Sensitive Groups)
For comparison, the highest level of PM2.5 in Lu’an Shi in the last 7 days was: 56 (Friday, May 27, 2022) and the lowest: 56 (Friday, May 27, 2022).
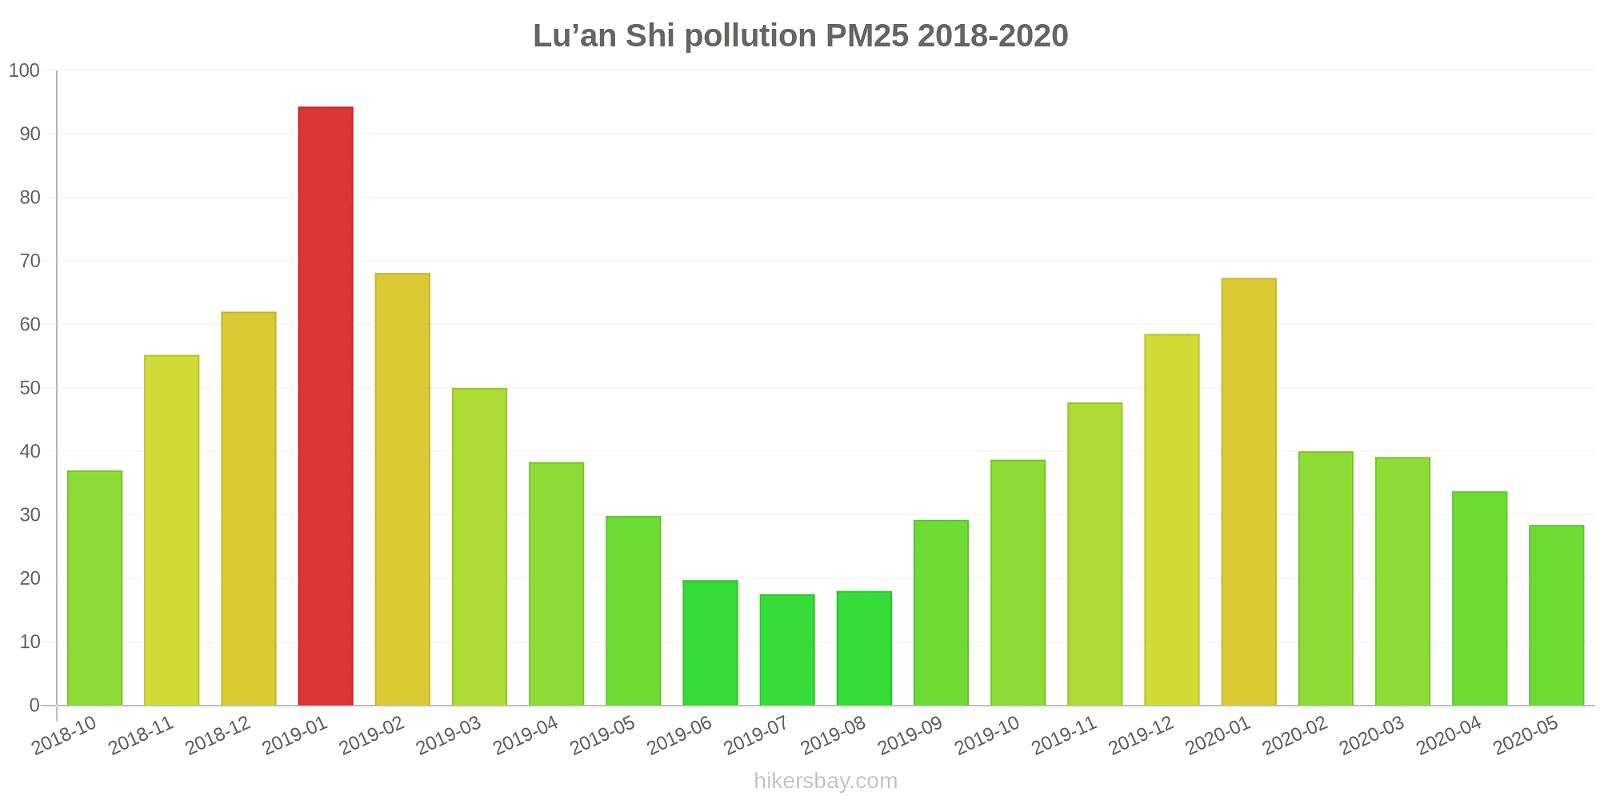
The highest PM2.5 values were recorded: 94 (January 2019).
The lowest level of particulate matter PM2.5 pollution occurs in month: July (18).
How is the O3 level today in Lu’an Shi? (ozone (O3))
0 (Good)
How high is the level of NO2? (nitrogen dioxide (NO2))
0 (Good)
What is the level of SO2 pollution? (sulfur dioxide (SO2))
0 (Good)
Current data Friday, May 27, 2022, 12:00 PM
PM10 179 (Very bad Hazardous)
PM2,5 35 (Unhealthy for Sensitive Groups)
O3 0 (Good)
NO2 0 (Good)
SO2 0 (Good)
Data on air pollution from recent days in Lu’an Shi
index
2022-05-27
pm10
56
Unhealthy for Sensitive Groups
pm25
56
Unhealthy
o3
0
Good
no2
0
Good
so2
0
Good
data source »
Air pollution in Lu’an Shi from October 2018 to May 2020
index
2020-05
2020-04
2020-03
2020-02
2020-01
2019-12
2019-11
2019-10
2019-09
2019-08
2019-07
2019-06
2019-05
2019-04
2019-03
2019-02
2019-01
2018-12
2018-11
2018-10
pm25
28 (Moderate)
34 (Moderate)
39 (Unhealthy for Sensitive Groups)
40 (Unhealthy for Sensitive Groups)
67 (Unhealthy)
59 (Unhealthy)
48 (Unhealthy for Sensitive Groups)
39 (Unhealthy for Sensitive Groups)
29 (Moderate)
18 (Moderate)
18 (Moderate)
20 (Moderate)
30 (Moderate)
38 (Unhealthy for Sensitive Groups)
50 (Unhealthy for Sensitive Groups)
68 (Unhealthy)
94 (Very Unhealthy)
62 (Unhealthy)
55 (Unhealthy)
37 (Unhealthy for Sensitive Groups)
co
685 (Good)
664 (Good)
744 (Good)
721 (Good)
986 (Good)
941 (Good)
690 (Good)
755 (Good)
708 (Good)
592 (Good)
630 (Good)
602 (Good)
493 (Good)
534 (Good)
617 (Good)
764 (Good)
968 (Good)
808 (Good)
767 (Good)
527 (Good)
no2
21 (Good)
23 (Good)
23 (Good)
14 (Good)
24 (Good)
37 (Good)
37 (Good)
33 (Good)
24 (Good)
13 (Good)
14 (Good)
15 (Good)
24 (Good)
23 (Good)
34 (Good)
26 (Good)
45 (Moderate)
57 (Moderate)
42 (Moderate)
36 (Good)
o3
136 (Unhealthy for Sensitive Groups)
130 (Unhealthy for Sensitive Groups)
103 (Moderate)
85 (Moderate)
66 (Good)
77 (Moderate)
107 (Moderate)
122 (Unhealthy for Sensitive Groups)
153 (Unhealthy)
140 (Unhealthy for Sensitive Groups)
127 (Unhealthy for Sensitive Groups)
98 (Moderate)
73 (Moderate)
77 (Moderate)
76 (Moderate)
59 (Good)
87 (Moderate)
64 (Good)
95 (Moderate)
104 (Moderate)
pm10
57 (Unhealthy for Sensitive Groups)
73 (Unhealthy for Sensitive Groups)
77 (Unhealthy for Sensitive Groups)
59 (Unhealthy for Sensitive Groups)
84 (Unhealthy)
84 (Unhealthy)
89 (Unhealthy)
83 (Unhealthy)
68 (Unhealthy for Sensitive Groups)
49 (Moderate)
43 (Moderate)
43 (Moderate)
64 (Unhealthy for Sensitive Groups)
77 (Unhealthy for Sensitive Groups)
94 (Unhealthy)
94 (Unhealthy)
134 (Very Unhealthy)
105 (Unhealthy)
98 (Unhealthy)
78 (Unhealthy for Sensitive Groups)
so2
4.5 (Good)
4.3 (Good)
4.2 (Good)
4.2 (Good)
4.3 (Good)
5 (Good)
4.7 (Good)
4.3 (Good)
4.5 (Good)
4.4 (Good)
4.4 (Good)
3.4 (Good)
3.8 (Good)
4.9 (Good)
5 (Good)
4.9 (Good)
6.5 (Good)
11 (Good)
5.6 (Good)
5 (Good)
data source »
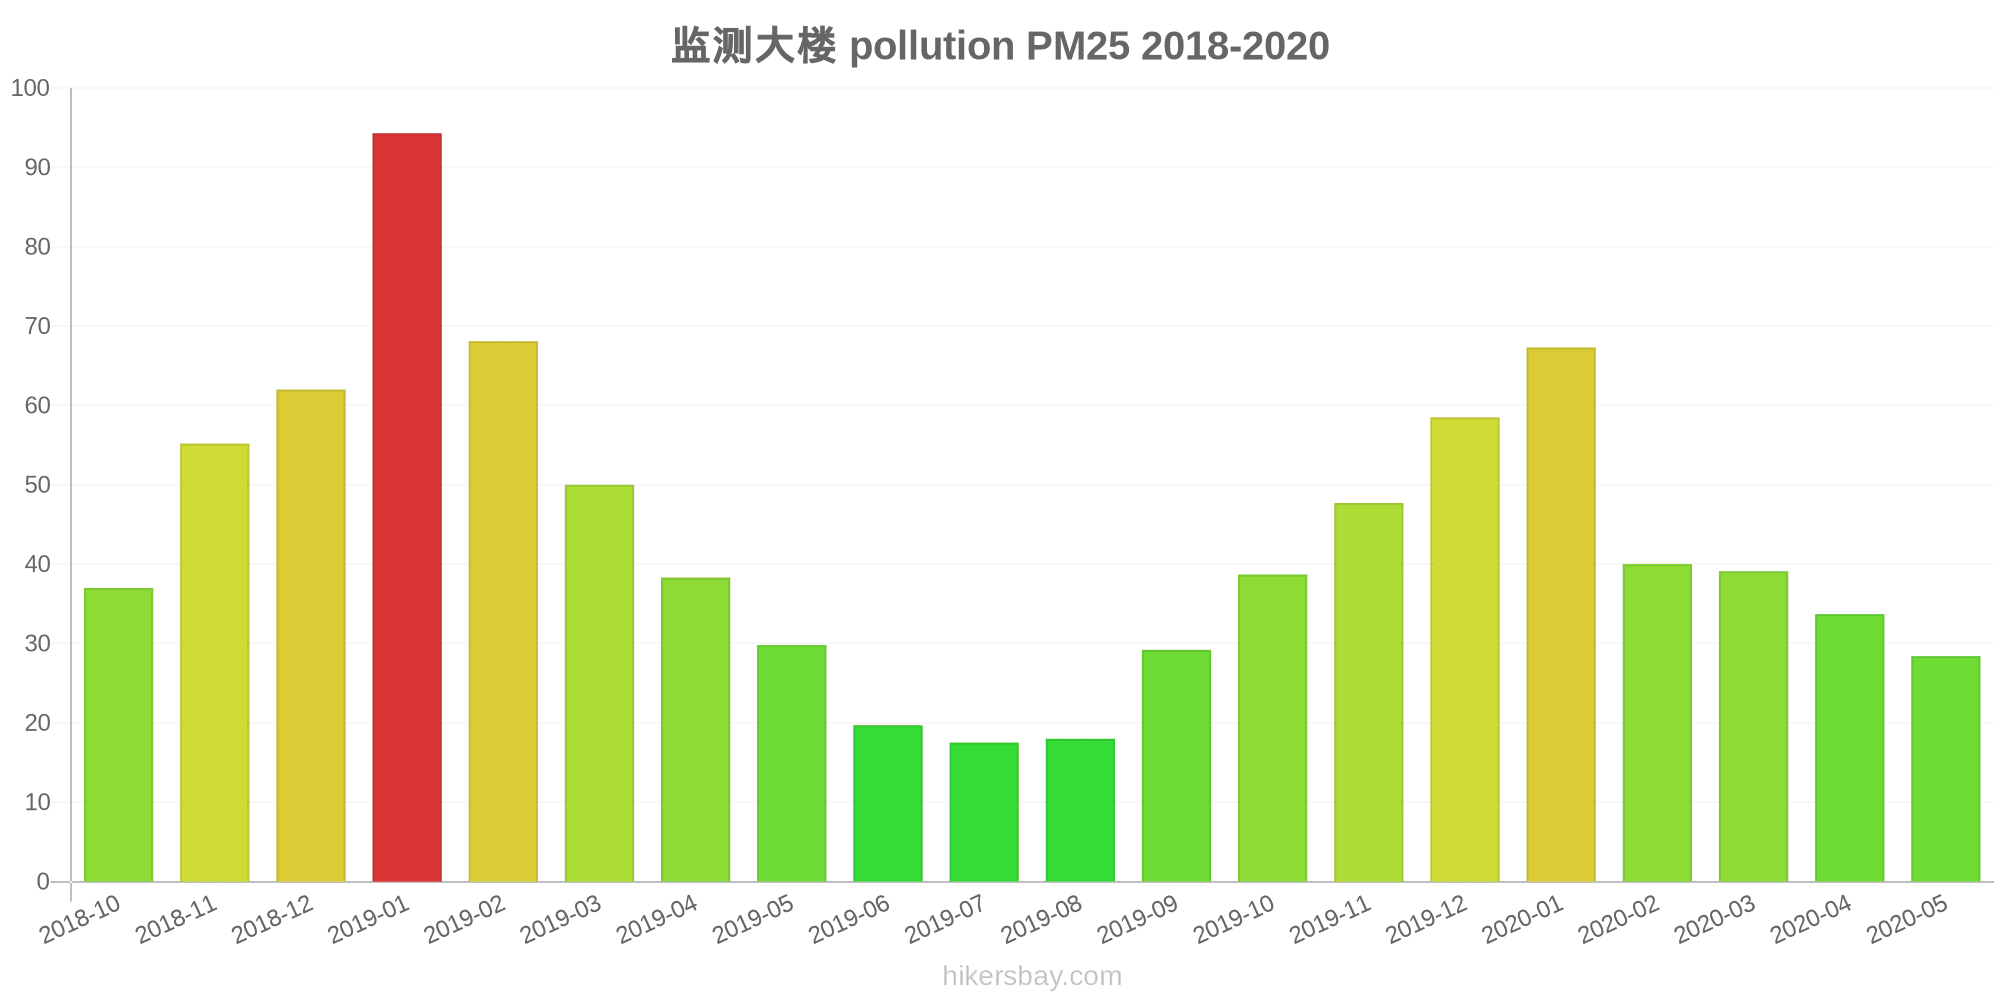
监测大楼
Friday, May 27, 2022, 12:00 PM
PM10 179 (Very bad Hazardous)
particulate matter (PM10) suspended dust
PM2,5 35 (Unhealthy for Sensitive Groups)
particulate matter (PM2.5) dust
O3 0.04 (Good)
ozone (O3)
NO2 0 (Good)
nitrogen dioxide (NO2)
SO2 0 (Good)
sulfur dioxide (SO2)
监测大楼
index
2022-05-27
pm10
56
pm25
56
o3
0.03
no2
0
so2
0
监测大楼
2018-10 2020-05

index
2020-05
2020-04
2020-03
2020-02
2020-01
2019-12
2019-11
2019-10
2019-09
2019-08
2019-07
2019-06
2019-05
2019-04
2019-03
2019-02
2019-01
2018-12
2018-11
2018-10
pm25
28
34
39
40
67
59
48
39
29
18
18
20
30
38
50
68
94
62
55
37
co
685
664
744
721
986
941
690
755
708
592
630
602
493
534
617
764
968
808
767
527
no2
21
23
23
14
24
37
37
33
24
13
14
15
24
23
34
26
45
57
42
36
o3
136
130
103
85
66
77
107
122
153
140
127
98
73
77
76
59
87
64
95
104
pm10
57
73
77
59
84
84
89
83
68
49
43
43
64
77
94
94
134
105
98
78
so2
4.5
4.3
4.2
4.2
4.3
5
4.7
4.3
4.5
4.4
4.4
3.4
3.8
4.9
5
4.9
6.5
11
5.6
5
* Pollution data source:
https://openaq.org
(ChinaAQIData)
The data is licensed under CC-By 4.0
PM10 179 (Very bad Hazardous)
PM2,5 35 (Unhealthy for Sensitive Groups)
O3 0 (Good)
NO2 0 (Good)
SO2 0 (Good)
Data on air pollution from recent days in Lu’an Shi
| index | 2022-05-27 |
|---|---|
| pm10 | 56 Unhealthy for Sensitive Groups |
| pm25 | 56 Unhealthy |
| o3 | 0 Good |
| no2 | 0 Good |
| so2 | 0 Good |

| index | 2020-05 | 2020-04 | 2020-03 | 2020-02 | 2020-01 | 2019-12 | 2019-11 | 2019-10 | 2019-09 | 2019-08 | 2019-07 | 2019-06 | 2019-05 | 2019-04 | 2019-03 | 2019-02 | 2019-01 | 2018-12 | 2018-11 | 2018-10 |
|---|---|---|---|---|---|---|---|---|---|---|---|---|---|---|---|---|---|---|---|---|
| pm25 | 28 (Moderate) | 34 (Moderate) | 39 (Unhealthy for Sensitive Groups) | 40 (Unhealthy for Sensitive Groups) | 67 (Unhealthy) | 59 (Unhealthy) | 48 (Unhealthy for Sensitive Groups) | 39 (Unhealthy for Sensitive Groups) | 29 (Moderate) | 18 (Moderate) | 18 (Moderate) | 20 (Moderate) | 30 (Moderate) | 38 (Unhealthy for Sensitive Groups) | 50 (Unhealthy for Sensitive Groups) | 68 (Unhealthy) | 94 (Very Unhealthy) | 62 (Unhealthy) | 55 (Unhealthy) | 37 (Unhealthy for Sensitive Groups) |
| co | 685 (Good) | 664 (Good) | 744 (Good) | 721 (Good) | 986 (Good) | 941 (Good) | 690 (Good) | 755 (Good) | 708 (Good) | 592 (Good) | 630 (Good) | 602 (Good) | 493 (Good) | 534 (Good) | 617 (Good) | 764 (Good) | 968 (Good) | 808 (Good) | 767 (Good) | 527 (Good) |
| no2 | 21 (Good) | 23 (Good) | 23 (Good) | 14 (Good) | 24 (Good) | 37 (Good) | 37 (Good) | 33 (Good) | 24 (Good) | 13 (Good) | 14 (Good) | 15 (Good) | 24 (Good) | 23 (Good) | 34 (Good) | 26 (Good) | 45 (Moderate) | 57 (Moderate) | 42 (Moderate) | 36 (Good) |
| o3 | 136 (Unhealthy for Sensitive Groups) | 130 (Unhealthy for Sensitive Groups) | 103 (Moderate) | 85 (Moderate) | 66 (Good) | 77 (Moderate) | 107 (Moderate) | 122 (Unhealthy for Sensitive Groups) | 153 (Unhealthy) | 140 (Unhealthy for Sensitive Groups) | 127 (Unhealthy for Sensitive Groups) | 98 (Moderate) | 73 (Moderate) | 77 (Moderate) | 76 (Moderate) | 59 (Good) | 87 (Moderate) | 64 (Good) | 95 (Moderate) | 104 (Moderate) |
| pm10 | 57 (Unhealthy for Sensitive Groups) | 73 (Unhealthy for Sensitive Groups) | 77 (Unhealthy for Sensitive Groups) | 59 (Unhealthy for Sensitive Groups) | 84 (Unhealthy) | 84 (Unhealthy) | 89 (Unhealthy) | 83 (Unhealthy) | 68 (Unhealthy for Sensitive Groups) | 49 (Moderate) | 43 (Moderate) | 43 (Moderate) | 64 (Unhealthy for Sensitive Groups) | 77 (Unhealthy for Sensitive Groups) | 94 (Unhealthy) | 94 (Unhealthy) | 134 (Very Unhealthy) | 105 (Unhealthy) | 98 (Unhealthy) | 78 (Unhealthy for Sensitive Groups) |
| so2 | 4.5 (Good) | 4.3 (Good) | 4.2 (Good) | 4.2 (Good) | 4.3 (Good) | 5 (Good) | 4.7 (Good) | 4.3 (Good) | 4.5 (Good) | 4.4 (Good) | 4.4 (Good) | 3.4 (Good) | 3.8 (Good) | 4.9 (Good) | 5 (Good) | 4.9 (Good) | 6.5 (Good) | 11 (Good) | 5.6 (Good) | 5 (Good) |
PM10 179 (Very bad Hazardous)
particulate matter (PM10) suspended dustPM2,5 35 (Unhealthy for Sensitive Groups)
particulate matter (PM2.5) dustO3 0.04 (Good)
ozone (O3)NO2 0 (Good)
nitrogen dioxide (NO2)SO2 0 (Good)
sulfur dioxide (SO2)监测大楼
| index | 2022-05-27 |
|---|---|
| pm10 | 56 |
| pm25 | 56 |
| o3 | 0.03 |
| no2 | 0 |
| so2 | 0 |
监测大楼
| index | 2020-05 | 2020-04 | 2020-03 | 2020-02 | 2020-01 | 2019-12 | 2019-11 | 2019-10 | 2019-09 | 2019-08 | 2019-07 | 2019-06 | 2019-05 | 2019-04 | 2019-03 | 2019-02 | 2019-01 | 2018-12 | 2018-11 | 2018-10 |
|---|---|---|---|---|---|---|---|---|---|---|---|---|---|---|---|---|---|---|---|---|
| pm25 | 28 | 34 | 39 | 40 | 67 | 59 | 48 | 39 | 29 | 18 | 18 | 20 | 30 | 38 | 50 | 68 | 94 | 62 | 55 | 37 |
| co | 685 | 664 | 744 | 721 | 986 | 941 | 690 | 755 | 708 | 592 | 630 | 602 | 493 | 534 | 617 | 764 | 968 | 808 | 767 | 527 |
| no2 | 21 | 23 | 23 | 14 | 24 | 37 | 37 | 33 | 24 | 13 | 14 | 15 | 24 | 23 | 34 | 26 | 45 | 57 | 42 | 36 |
| o3 | 136 | 130 | 103 | 85 | 66 | 77 | 107 | 122 | 153 | 140 | 127 | 98 | 73 | 77 | 76 | 59 | 87 | 64 | 95 | 104 |
| pm10 | 57 | 73 | 77 | 59 | 84 | 84 | 89 | 83 | 68 | 49 | 43 | 43 | 64 | 77 | 94 | 94 | 134 | 105 | 98 | 78 |
| so2 | 4.5 | 4.3 | 4.2 | 4.2 | 4.3 | 5 | 4.7 | 4.3 | 4.5 | 4.4 | 4.4 | 3.4 | 3.8 | 4.9 | 5 | 4.9 | 6.5 | 11 | 5.6 | 5 |