Air Pollution in Meishan: Real-time Air Quality Index and smog alert.
Pollution and air quality forecast for Meishan. Today is Tuesday, June 16, 2026. The following air pollution values have been recorded for Meishan:- particulate matter (PM2.5) dust - 61 (Unhealthy)
- nitrogen dioxide (NO2) - 22 (Good)
- particulate matter (PM10) suspended dust - 69 (Unhealthy for Sensitive Groups)
- carbon monoxide (CO) - 219 (Good)
- ozone (O3) - 0 (Good)
- sulfur dioxide (SO2) - 8 (Good)

What is the air quality in Meishan today? Is the air polluted in Meishan?. Is there smog?
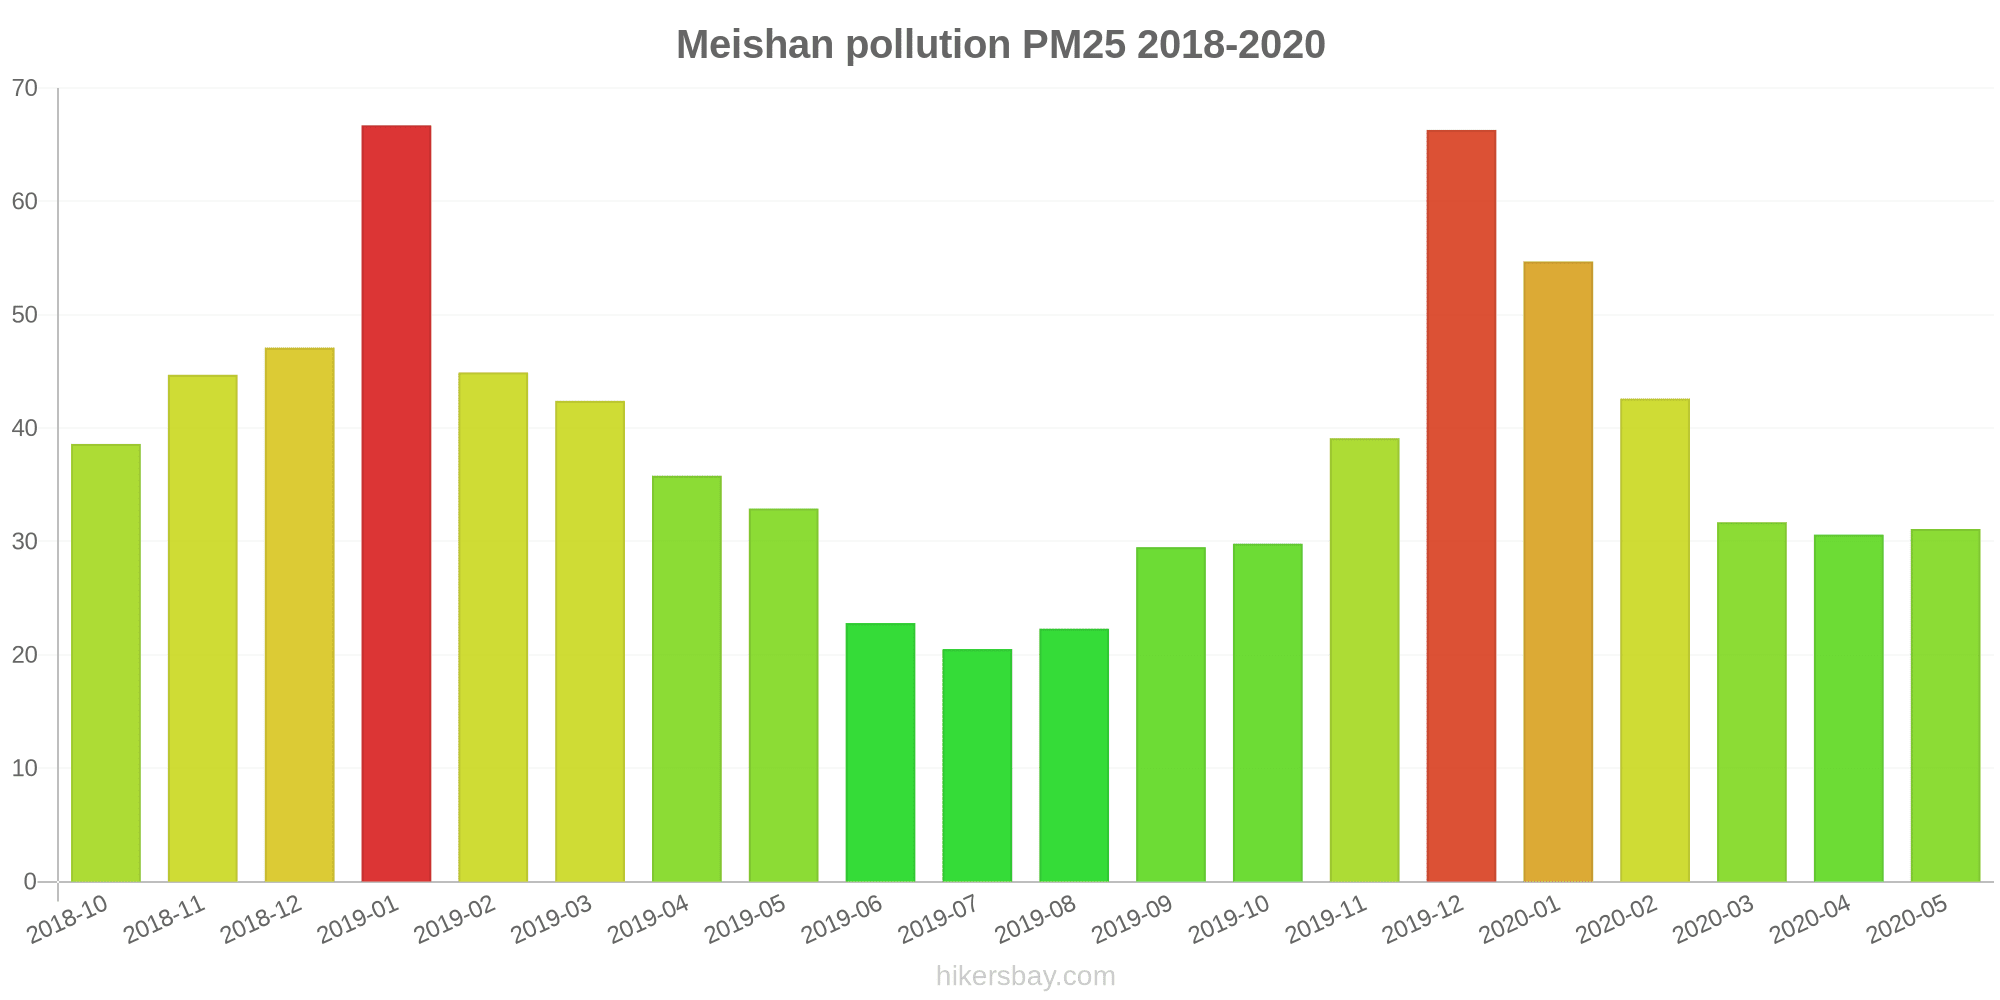
What is the current level of PM2.5 in Meishan? (particulate matter (PM2.5) dust)
Today's PM2.5 level is:
61 (Unhealthy)
For comparison, the highest level of PM2.5 in Meishan in the last 7 days was: 28 (Friday, May 27, 2022) and the lowest: 28 (Friday, May 27, 2022).
The highest PM2.5 values were recorded: 67 (January 2019).
The lowest level of particulate matter PM2.5 pollution occurs in month: July (21).
How high is the level of NO2? (nitrogen dioxide (NO2))
22 (Good)
What is the level of PM10 today in Meishan? (particulate matter (PM10) suspended dust)
The current level of particulate matter PM10 in Meishan is:
69 (Unhealthy for Sensitive Groups)
The highest PM10 values usually occur in month: 101 (January 2019).
The lowest value of particulate matter PM10 pollution in Meishan is usually recorded in: July (34).
How high is the CO level? (carbon monoxide (CO))
219 (Good)
How is the O3 level today in Meishan? (ozone (O3))
0 (Good)
What is the level of SO2 pollution? (sulfur dioxide (SO2))
8 (Good)
Current data Friday, May 27, 2022, 3:00 PM
PM2,5 61 (Unhealthy)
NO2 22 (Good)
PM10 69 (Unhealthy for Sensitive Groups)
CO 219 (Good)
O3 0 (Good)
SO2 8 (Good)
Data on air pollution from recent days in Meishan
index
2022-05-27
pm25
28
Moderate
no2
22
Good
pm10
35
Moderate
co
579
Good
o3
22
Good
so2
5
Good
data source »
Air pollution in Meishan from October 2018 to May 2020

index
2020-05
2020-04
2020-03
2020-02
2020-01
2019-12
2019-11
2019-10
2019-09
2019-08
2019-07
2019-06
2019-05
2019-04
2019-03
2019-02
2019-01
2018-12
2018-11
2018-10
pm25
31 (Moderate)
31 (Moderate)
32 (Moderate)
43 (Unhealthy for Sensitive Groups)
55 (Unhealthy for Sensitive Groups)
66 (Unhealthy)
39 (Unhealthy for Sensitive Groups)
30 (Moderate)
30 (Moderate)
22 (Moderate)
21 (Moderate)
23 (Moderate)
33 (Moderate)
36 (Unhealthy for Sensitive Groups)
42 (Unhealthy for Sensitive Groups)
45 (Unhealthy for Sensitive Groups)
67 (Unhealthy)
47 (Unhealthy for Sensitive Groups)
45 (Unhealthy for Sensitive Groups)
39 (Unhealthy for Sensitive Groups)
co
615 (Good)
764 (Good)
719 (Good)
835 (Good)
1 (Good)
1 (Good)
770 (Good)
738 (Good)
738 (Good)
630 (Good)
587 (Good)
585 (Good)
574 (Good)
624 (Good)
681 (Good)
979 (Good)
1 (Good)
948 (Good)
772 (Good)
739 (Good)
no2
45 (Moderate)
38 (Good)
34 (Good)
19 (Good)
40 (Good)
49 (Moderate)
40 (Good)
35 (Good)
30 (Good)
27 (Good)
26 (Good)
28 (Good)
29 (Good)
42 (Moderate)
46 (Moderate)
37 (Good)
54 (Moderate)
46 (Moderate)
41 (Moderate)
42 (Moderate)
o3
177 (Unhealthy)
127 (Unhealthy for Sensitive Groups)
117 (Moderate)
84 (Moderate)
59 (Good)
55 (Good)
59 (Good)
84 (Moderate)
102 (Moderate)
155 (Unhealthy)
128 (Unhealthy for Sensitive Groups)
155 (Unhealthy)
126 (Unhealthy for Sensitive Groups)
150 (Unhealthy)
100 (Moderate)
77 (Moderate)
59 (Good)
39 (Good)
68 (Good)
70 (Good)
pm10
62 (Unhealthy for Sensitive Groups)
55 (Unhealthy for Sensitive Groups)
58 (Unhealthy for Sensitive Groups)
61 (Unhealthy for Sensitive Groups)
76 (Unhealthy for Sensitive Groups)
96 (Unhealthy)
66 (Unhealthy for Sensitive Groups)
48 (Moderate)
47 (Moderate)
38 (Moderate)
34 (Moderate)
41 (Moderate)
55 (Unhealthy for Sensitive Groups)
64 (Unhealthy for Sensitive Groups)
72 (Unhealthy for Sensitive Groups)
68 (Unhealthy for Sensitive Groups)
101 (Unhealthy)
80 (Unhealthy for Sensitive Groups)
70 (Unhealthy for Sensitive Groups)
64 (Unhealthy for Sensitive Groups)
so2
16 (Good)
12 (Good)
9.4 (Good)
5.9 (Good)
8.8 (Good)
13 (Good)
11 (Good)
9.8 (Good)
10 (Good)
10 (Good)
12 (Good)
12 (Good)
10 (Good)
11 (Good)
10 (Good)
9.8 (Good)
12 (Good)
9.6 (Good)
8.8 (Good)
11 (Good)
data source »
区人社局
Friday, May 27, 2022, 3:00 PM
PM2,5 61 (Unhealthy)
particulate matter (PM2.5) dust
NO2 22 (Good)
nitrogen dioxide (NO2)
PM10 69 (Unhealthy for Sensitive Groups)
particulate matter (PM10) suspended dust
CO 219 (Good)
carbon monoxide (CO)
O3 0.05 (Good)
ozone (O3)
SO2 7.7 (Good)
sulfur dioxide (SO2)
区人社局
index
2022-05-27
pm25
28
no2
22
pm10
35
co
579
o3
22
so2
4.6
区人社局
2018-10 2020-05

index
2020-05
2020-04
2020-03
2020-02
2020-01
2019-12
2019-11
2019-10
2019-09
2019-08
2019-07
2019-06
2019-05
2019-04
2019-03
2019-02
2019-01
2018-12
2018-11
2018-10
pm25
31
31
32
43
55
66
39
30
30
22
21
23
33
36
42
45
67
47
45
39
co
615
764
719
835
1
1
770
738
738
630
587
585
574
624
681
979
1
948
772
739
no2
45
38
34
19
40
49
40
35
30
27
26
28
29
42
46
37
54
46
41
42
o3
177
127
117
84
59
55
59
84
102
155
128
155
126
150
100
77
59
39
68
70
pm10
62
55
58
61
76
96
66
48
47
38
34
41
55
64
72
68
101
80
70
64
so2
16
12
9.4
5.9
8.8
13
11
9.8
10
10
12
12
10
11
10
9.8
12
9.6
8.8
11
* Pollution data source:
https://openaq.org
(ChinaAQIData)
The data is licensed under CC-By 4.0
PM2,5 61 (Unhealthy)
NO2 22 (Good)
PM10 69 (Unhealthy for Sensitive Groups)
CO 219 (Good)
O3 0 (Good)
SO2 8 (Good)
Data on air pollution from recent days in Meishan
| index | 2022-05-27 |
|---|---|
| pm25 | 28 Moderate |
| no2 | 22 Good |
| pm10 | 35 Moderate |
| co | 579 Good |
| o3 | 22 Good |
| so2 | 5 Good |
| index | 2020-05 | 2020-04 | 2020-03 | 2020-02 | 2020-01 | 2019-12 | 2019-11 | 2019-10 | 2019-09 | 2019-08 | 2019-07 | 2019-06 | 2019-05 | 2019-04 | 2019-03 | 2019-02 | 2019-01 | 2018-12 | 2018-11 | 2018-10 |
|---|---|---|---|---|---|---|---|---|---|---|---|---|---|---|---|---|---|---|---|---|
| pm25 | 31 (Moderate) | 31 (Moderate) | 32 (Moderate) | 43 (Unhealthy for Sensitive Groups) | 55 (Unhealthy for Sensitive Groups) | 66 (Unhealthy) | 39 (Unhealthy for Sensitive Groups) | 30 (Moderate) | 30 (Moderate) | 22 (Moderate) | 21 (Moderate) | 23 (Moderate) | 33 (Moderate) | 36 (Unhealthy for Sensitive Groups) | 42 (Unhealthy for Sensitive Groups) | 45 (Unhealthy for Sensitive Groups) | 67 (Unhealthy) | 47 (Unhealthy for Sensitive Groups) | 45 (Unhealthy for Sensitive Groups) | 39 (Unhealthy for Sensitive Groups) |
| co | 615 (Good) | 764 (Good) | 719 (Good) | 835 (Good) | 1 (Good) | 1 (Good) | 770 (Good) | 738 (Good) | 738 (Good) | 630 (Good) | 587 (Good) | 585 (Good) | 574 (Good) | 624 (Good) | 681 (Good) | 979 (Good) | 1 (Good) | 948 (Good) | 772 (Good) | 739 (Good) |
| no2 | 45 (Moderate) | 38 (Good) | 34 (Good) | 19 (Good) | 40 (Good) | 49 (Moderate) | 40 (Good) | 35 (Good) | 30 (Good) | 27 (Good) | 26 (Good) | 28 (Good) | 29 (Good) | 42 (Moderate) | 46 (Moderate) | 37 (Good) | 54 (Moderate) | 46 (Moderate) | 41 (Moderate) | 42 (Moderate) |
| o3 | 177 (Unhealthy) | 127 (Unhealthy for Sensitive Groups) | 117 (Moderate) | 84 (Moderate) | 59 (Good) | 55 (Good) | 59 (Good) | 84 (Moderate) | 102 (Moderate) | 155 (Unhealthy) | 128 (Unhealthy for Sensitive Groups) | 155 (Unhealthy) | 126 (Unhealthy for Sensitive Groups) | 150 (Unhealthy) | 100 (Moderate) | 77 (Moderate) | 59 (Good) | 39 (Good) | 68 (Good) | 70 (Good) |
| pm10 | 62 (Unhealthy for Sensitive Groups) | 55 (Unhealthy for Sensitive Groups) | 58 (Unhealthy for Sensitive Groups) | 61 (Unhealthy for Sensitive Groups) | 76 (Unhealthy for Sensitive Groups) | 96 (Unhealthy) | 66 (Unhealthy for Sensitive Groups) | 48 (Moderate) | 47 (Moderate) | 38 (Moderate) | 34 (Moderate) | 41 (Moderate) | 55 (Unhealthy for Sensitive Groups) | 64 (Unhealthy for Sensitive Groups) | 72 (Unhealthy for Sensitive Groups) | 68 (Unhealthy for Sensitive Groups) | 101 (Unhealthy) | 80 (Unhealthy for Sensitive Groups) | 70 (Unhealthy for Sensitive Groups) | 64 (Unhealthy for Sensitive Groups) |
| so2 | 16 (Good) | 12 (Good) | 9.4 (Good) | 5.9 (Good) | 8.8 (Good) | 13 (Good) | 11 (Good) | 9.8 (Good) | 10 (Good) | 10 (Good) | 12 (Good) | 12 (Good) | 10 (Good) | 11 (Good) | 10 (Good) | 9.8 (Good) | 12 (Good) | 9.6 (Good) | 8.8 (Good) | 11 (Good) |
PM2,5 61 (Unhealthy)
particulate matter (PM2.5) dustNO2 22 (Good)
nitrogen dioxide (NO2)PM10 69 (Unhealthy for Sensitive Groups)
particulate matter (PM10) suspended dustCO 219 (Good)
carbon monoxide (CO)O3 0.05 (Good)
ozone (O3)SO2 7.7 (Good)
sulfur dioxide (SO2)区人社局
| index | 2022-05-27 |
|---|---|
| pm25 | 28 |
| no2 | 22 |
| pm10 | 35 |
| co | 579 |
| o3 | 22 |
| so2 | 4.6 |
区人社局

| index | 2020-05 | 2020-04 | 2020-03 | 2020-02 | 2020-01 | 2019-12 | 2019-11 | 2019-10 | 2019-09 | 2019-08 | 2019-07 | 2019-06 | 2019-05 | 2019-04 | 2019-03 | 2019-02 | 2019-01 | 2018-12 | 2018-11 | 2018-10 |
|---|---|---|---|---|---|---|---|---|---|---|---|---|---|---|---|---|---|---|---|---|
| pm25 | 31 | 31 | 32 | 43 | 55 | 66 | 39 | 30 | 30 | 22 | 21 | 23 | 33 | 36 | 42 | 45 | 67 | 47 | 45 | 39 |
| co | 615 | 764 | 719 | 835 | 1 | 1 | 770 | 738 | 738 | 630 | 587 | 585 | 574 | 624 | 681 | 979 | 1 | 948 | 772 | 739 |
| no2 | 45 | 38 | 34 | 19 | 40 | 49 | 40 | 35 | 30 | 27 | 26 | 28 | 29 | 42 | 46 | 37 | 54 | 46 | 41 | 42 |
| o3 | 177 | 127 | 117 | 84 | 59 | 55 | 59 | 84 | 102 | 155 | 128 | 155 | 126 | 150 | 100 | 77 | 59 | 39 | 68 | 70 |
| pm10 | 62 | 55 | 58 | 61 | 76 | 96 | 66 | 48 | 47 | 38 | 34 | 41 | 55 | 64 | 72 | 68 | 101 | 80 | 70 | 64 |
| so2 | 16 | 12 | 9.4 | 5.9 | 8.8 | 13 | 11 | 9.8 | 10 | 10 | 12 | 12 | 10 | 11 | 10 | 9.8 | 12 | 9.6 | 8.8 | 11 |